Inventory Turnover Ratio: What It Is, How to Calculate It, and How Ecommerce Brands Improve It

Last updated on February 17, 2026
In this article
 26 minutes
- What inventory turnover ratio actually measures
- Understanding goods sold and average inventory
- What good and bad turnover actually look like in ecommerce
- How low turnover traps cash and multiplies risk
- How excessively high turnover triggers operational problems
- How fulfillment speed and returns directly influence turnover
- Practical ways to improve turnover without sacrificing service levels
- The relationship between turnover and business model sustainability
- Frequently Asked Questions
Inventory turnover ratio (also called stock turnover) measures how many times a company sells and replaces its inventory during an accounting period. For ecommerce brands, this metric reveals far more than operational efficiency. It exposes cash conversion speed, obsolescence risk, and whether your inventory strategy aligns with customer demand. A Shopify brand holding $200,000 in average inventory while generating $1.2 million in annual COGS turns inventory six times per year, meaning each dollar tied up in stock converts to sales roughly every 60 days. That conversion speed determines whether you’re funding growth with customer revenue or depleting cash reserves to finance unsold goods.
The trap most mid-market brands fall into is treating turnover as a purely operational metric to maximize without understanding the trade-offs. Pushing turnover higher by cutting stock levels can trigger stockouts that damage customer satisfaction and increase expedited shipping costs. Conversely, low turnover signals that cash is trapped in slow-moving inventory, accumulating storage costs while opportunity costs compound. Inventory values used in the calculation are typically obtained from the balance sheet. The inventory turnover ratio is increasingly viewed as a strategic differentiator for companies. This guide explains how inventory turnover actually works in ecommerce operations, what the number reveals about business health, and how to improve turnover without sacrificing the fulfillment speed customers expect.
Monitoring inventory turnover helps businesses make better decisions regarding pricing, marketing, and inventory management.
What inventory turnover ratio actually measures
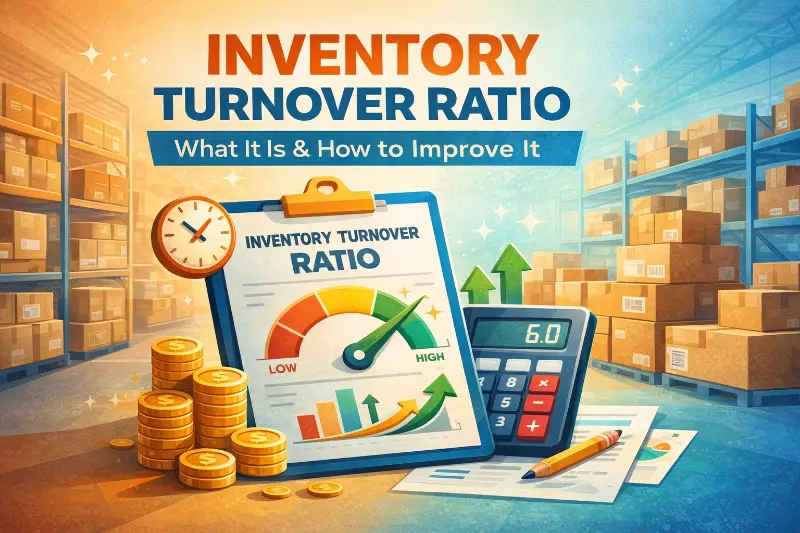
The inventory turnover ratio is an important inventory ratio that shows how efficiently a company converts inventory into sales by calculating how many times the entire inventory stock sells and gets replaced during a given period. Calculating inventory turnover involves dividing Cost of Goods Sold (COGS) by the average value of inventory held during the same period:
Inventory Turnover Ratio = Cost of Goods Sold ÷ Average Inventory
COGS represents the direct costs attributable to producing the goods sold during the period, including product acquisition cost, inbound freight, customs duties, and fulfillment costs directly tied to orders. The average inventory value is calculated as (Beginning Inventory + Ending Inventory) ÷ 2, representing the typical inventory value held throughout the same period. Both COGS and average inventory should be measured over the same period and use the same valuation method, typically cost rather than retail price. This inventory ratio can also be expressed as inventory divided by sales or COGS, depending on the context.
A concrete example illustrates the inventory turnover calculation. A DTC skincare brand reports $1,800,000 in COGS for the year. Beginning inventory on January 1 was $250,000, and ending inventory on December 31 was $350,000. Average inventory equals ($250,000 + $350,000) ÷ 2 = $300,000. The inventory turnover ratio is $1,800,000 ÷ $300,000 = 6.0, meaning the brand sold and replaced its entire inventory six times during the year.
The ratio translates to days using a simple conversion: 365 days ÷ Inventory Turnover Ratio = Days to Sell Inventory. A turnover ratio of 6.0 means 365 ÷ 6 = approximately 61 days to sell through the average inventory level. This days-to-sell metric often resonates more clearly with operations teams than the abstract ratio itself.
The inventory turnover ratio measures operational efficiency in converting inventory investment into revenue, capital efficiency in how quickly cash tied up in inventory returns through sales, and demand alignment showing whether inventory levels match actual customer demand. High turnover suggests strong sales relative to inventory levels, efficient inventory processes, and lower holding costs. Low turnover indicates weak sales relative to stock on hand, excess inventory accumulation, or obsolete inventory taking up warehouse space.
Calculating the inventory turnover ratio helps businesses make smarter decisions in areas like pricing, manufacturing, and purchasing.
Slash Your Fulfillment Costs by Up to 30%
Cut shipping expenses by 30% and boost profit with Cahoot's AI-optimized fulfillment services and modern tech —no overheads and no humans required!
I'm Interested in Saving Time and MoneyUnderstanding goods sold and average inventory
To accurately calculate inventory turnover and assess your inventory management processes, it’s essential to understand two foundational concepts: goods sold and average inventory. In ecommerce, “goods sold” refers to the cost of goods sold (COGS)—the direct costs associated with producing or purchasing the products that are actually sold during a given period. This includes expenses like raw materials, manufacturing labor, and direct shipping or fulfillment costs. COGS is a critical figure because it reflects the real investment made to generate sales, not just the sticker price of your products.
Average inventory, on the other hand, represents the typical inventory value your business holds over a specific period—often calculated monthly, quarterly, or annually. To determine average inventory, you add your beginning inventory (the inventory value at the start of the period) to your ending inventory (the value at the end of the period) and divide by two. This average inventory value smooths out fluctuations and provides a more accurate picture of the inventory levels you’re managing throughout the sales cycle.
The inventory turnover ratio measures how many times your company’s inventory is sold and replaced within a given period. The formula is straightforward: divide your cost of goods sold by your average inventory value. For example, if your ecommerce store has a COGS of $100,000 and an average inventory of $20,000, your inventory turnover ratio is 5. This means you’re selling and replenishing your inventory five times during that period—a sign of strong sales and efficient inventory management.
A good inventory turnover ratio varies by industry, but for most ecommerce businesses, a ratio between 2 and 6 is considered ideal. This range typically indicates you have enough inventory to meet customer demand without tying up excessive capital in unsold stock or incurring unnecessary holding costs. A high inventory turnover ratio often signals strong sales and operational efficiency, but if it’s too high, it could mean you’re not keeping enough inventory on hand, risking stockouts and lost sales opportunities. Conversely, a low inventory turnover ratio may point to weak sales, excess inventory, or inadequate inventory stocking, all of which can increase storage costs and reduce profitability.
Striking the right balance is crucial. Too much inventory leads to excessive inventory and higher holding costs, while too little can result in inadequate inventory and lost sales. Monitoring your inventory turnover ratio, along with related metrics like days sales of inventory (DSI)—which measures the average number of days it takes to sell your inventory—can help you fine-tune your inventory management strategies. By analyzing these efficiency ratios, you can identify areas for improvement, optimize inventory levels, and better align your stock with actual customer demand.
Ultimately, understanding goods sold and average inventory, and how they factor into the inventory turnover formula, empowers ecommerce brands to make smarter decisions. Effective inventory management not only supports sales and customer satisfaction but also drives business performance by reducing costs and freeing up capital for growth. By keeping a close eye on your inventory turnover rate and related metrics, you can ensure your business remains agile, efficient, and ready to meet market demand.
What good and bad turnover actually look like in ecommerce
Defining “good” turnover for ecommerce requires context that extends beyond simple numerical thresholds. The appropriate turnover ratio depends on product category characteristics, business model, and growth stage rather than universal benchmarks. The ideal inventory turnover ratio varies by industry, and understanding this benchmark is crucial for effective inventory management.
Product categories with naturally high turnover ratio include consumables and supplements that customers reorder frequently, fast fashion and trending items with short product lifecycles, and low-cost impulse purchases where customers don’t deliberate extensively. These categories often see higher inventory turnover ratios of 8-15 times annually because products move quickly and brands can maintain leaner inventory positions. A higher ratio generally indicates strong sales, efficient inventory management, and increased market demand, but it can also present challenges such as supply chain vulnerabilities and potential stockouts.
Product categories with naturally low ratio include furniture and large durable goods with infrequent purchase cycles, luxury items with smaller customer bases and longer consideration periods, and seasonal products concentrated in specific selling windows. These categories may operate successfully with low turnover ratios of 3-5 times annually because the business model anticipates longer inventory holding periods. A low ratio can indicate weak sales, excess inventory, or market demand issues, and may require adjustments in pricing, marketing, or supply chain strategies.
The business model also shapes appropriate turnover expectations. Dropshipping or made-to-order models can achieve extremely high turnover (or infinite turnover in pure dropship cases) because inventory never sits in owned warehouses. Brands holding their own inventory for immediate fulfillment typically target turnover ratios of 4-8 times annually, balancing stock availability against cash efficiency. Brands with long production lead times from overseas manufacturers may accept lower turnover of 3-4 times annually to maintain stock buffers that prevent stockouts.
The inventory turnover ratio is important for assessing inventory management efficiency. It helps businesses identify excess stock, improve cash flow, and make informed decisions to optimize operations.
For most industries, the ideal inventory turnover ratio is between 5 and 10. However, for industries with perishable goods, such as florists and grocers, the ideal ratio will be higher to prevent inventory losses. Industry benchmarks for inventory turnover ratios can be found through online searches or databases managed by industry associations. High-volume, low-margin industries tend to have high inventory turnovers, while low-volume, high-margin industries tend to have much lower inventory turnover ratios.
Signs of healthy turnover include steady sales velocity without frequent stockouts, inventory age reports showing minimal obsolete or slow-moving stock, cash flow that supports operations without constant emergency financing, and the ability to respond to demand shifts without massive overstock. The absolute number matters less than whether turnover supports sustainable operations.
Signs of problematic turnover manifest differently depending on whether turnover is too low or too high. Excessively low turnover creates warning signals including warehouse space consumed by slow-moving products, cash tied up in inventory that could fund marketing or growth, increasing obsolescence risk as products age or trends shift, and rising storage costs eating into margins. Excessively high turnover generates different problems: frequent stockouts damaging customer experience, expedited shipping costs to fulfill orders from distant warehouses, lost sales when products are unavailable during demand spikes, and stressed supplier relationships from constant rush orders.
The Goldilocks principle applies: turnover should be high enough to prevent cash from stagnating in unsold inventory, but low enough to maintain service levels and fulfillment speed that meet customer expectations. The right number depends on your specific situation rather than external benchmarks.
Looking for a New 3PL? Start with this Free RFP Template
Cut weeks off your selection process. Avoid pitfalls. Get the only 3PL RFP checklist built for ecommerce brands, absolutely free.
Get My Free 3PL RFPHow low turnover traps cash and multiplies risk
Low inventory turnover creates a cash flow problem disguised as an inventory management issue. When products sit unsold for extended periods, the cash used to purchase that inventory remains locked in stock rather than cycling back through sales to fund operations. This working capital trap intensifies for growing brands where cash constraints limit marketing spend, product development, or expansion opportunities.
The holding costs of slower inventory compound over time. Storage costs for warehouse space scale with inventory volume, whether you’re paying 3PL storage fees per pallet or carrying your own facility costs. Insurance costs typically calculate as a percentage of inventory value, meaning higher inventory levels directly increase premiums. Obsolescence risk grows as products age, particularly for items with expiration dates, seasonal relevance, or style sensitivity. For beauty and supplement brands, products approaching expiration dates may become unsellable at full price or even total write-offs.
Opportunity cost represents the hidden damage from low turnover. Every dollar trapped in slower inventory is a dollar unavailable for customer acquisition, product development, or operational improvements. A brand with $400,000 in excess inventory earning a turnover ratio of 2.0 instead of 6.0 has roughly $267,000 in capital that could fund growth initiatives if deployed differently.
The risk concentration intensifies when low turnover stems from poor inventory mix decisions. Having the wrong products in stock creates dual problems: the products you do have aren’t selling (low turnover), and the products customers want aren’t available (stockouts). Insufficient inventory can lead to missed sales opportunities during demand spikes or supply chain issues, further impacting profitability and customer satisfaction. This inventory mismatch destroys profitability from both directions while tying up capital in the least productive way possible.
Brands with low turnover often face a vicious cycle where cash constraints prevent ordering fast-moving inventory because too much capital is tied up in slower inventory. The inventory mix deteriorates further, turnover drops, and the cash position weakens. Breaking this cycle requires decisive action on slower inventory through promotions, bundling, or liquidation to free capital for better-performing products.
Conducting a comprehensive assessment of inventory management processes can help identify the causes of low turnover ratios.
How excessively high turnover triggers operational problems
While low turnover clearly signals problems, excessively high turnover creates a different set of operational challenges that can be equally damaging. Brands chasing a higher ratio by cutting stock levels too aggressively often discover that the cure is worse than the disease, especially if their supply chain is not robust enough to handle rapid replenishment.
Stockouts become frequent when inventory levels drop below safety stock requirements. Each stockout carries multiple costs: immediate lost sales from customers who won’t wait, long-term customer relationship damage when shoppers lose confidence in product availability, and competitive disadvantage as customers discover alternative brands during stockout periods. Aligning inventory with consumer demand is crucial to prevent these stockouts and optimize sales opportunities. Research consistently shows that 21-43% of customers who encounter stockouts will buy from a competitor rather than wait, representing permanent customer loss rather than delayed revenue.
Fulfillment costs increase when lean inventory forces multi-location shipping. A brand with one central warehouse maintaining minimal stock may need to split orders across multiple shipments when local inventory runs out, doubling shipping costs. Expedited shipping from distant warehouses to meet delivery promises further erodes margins. The per-order fulfillment cost can easily increase 30-60% when inventory positioning forces inefficient shipping patterns.
Supplier relationships suffer under constant pressure for rush orders. Manufacturers and wholesalers typically offer better pricing for planned, larger orders with reasonable lead times. Brands operating with razor-thin inventory constantly requesting expedited production or shipping forfeit these discounts, pay premium rates for rush service, and risk supplier prioritization of more stable customers during capacity constraints. Supply chain vulnerabilities can further exacerbate these issues, making it harder to maintain consistent stock levels.
The lost sales opportunities extend beyond immediate stockouts. Products with inconsistent availability lose organic search visibility as algorithms deprioritize unreliable listings, and customer reviews often mention availability issues even after problems are resolved. The compounding effect of these visibility losses can persist long after inventory levels stabilize.
Operational chaos emerges when teams spend excessive time firefighting inventory issues rather than executing strategic work. Expedited shipping decisions, supplier escalations, customer service for stockouts, and constant demand forecasting adjustments all consume management attention that could drive growth initiatives.
The paradox of a high turnover ratio is that while it appears to signal efficiency and strong sales, it often masks operational fragility. A higher ratio can indicate increased demand or efficient inventory management, but it also raises the risk of stock shortages if the supply chain cannot keep up. High inventory turnover is particularly important for businesses dealing with perishable goods to avoid losses from spoilage. A brand turning inventory 12 times annually might be optimally efficient or might be one demand spike away from customer satisfaction collapse. Context matters more than the number itself.
How fulfillment speed and returns directly influence turnover
The relationship between inventory turnover and ecommerce fulfillment operations runs deeper than most brands recognize. Decisions about warehouse location, stock distribution, and returns processing directly impact the turnover ratio through mechanisms that aren’t obvious from the formula alone.
Multi-warehouse distribution affects turnover through stock fragmentation, with inventory divided across multiple locations. Splitting inventory across three warehouses to reduce shipping costs and delivery times means each location holds partial stock. A SKU with 300 total units might have 100 at each location. If one location experiences stockouts while another location has slow-moving inventory, the aggregate turnover may appear healthy while location-level turnover varies wildly. This fragmentation often increases total inventory requirements by 20-40% compared to centralized storage because safety stock must be maintained at each location.
The safety stock penalty for faster fulfillment is real. Brands promising 1-2 day delivery must maintain higher inventory buffers than brands offering 5-7 day delivery, simply because forecast error compounds over shorter time horizons and there’s less opportunity to replenish between order and shipment. This higher safety stock directly reduces turnover ratio by increasing the denominator (average inventory) without proportionally increasing the numerator (COGS).
Returns processing speed affects turnover in ways rarely captured in standard metrics. When returned products sit in inspection queues for days or weeks before returning to sellable inventory, the effective inventory available to support sales drops while the accounting inventory (and thus the turnover calculation) remains unchanged. Slow returns processing creates phantom inventory that looks available on paper but cannot actually fulfill orders, forcing brands to carry higher overall inventory levels to maintain service levels.
Returns destination decisions also matter. Products returned to customers’ nearest warehouse may create inventory imbalances where some locations accumulate returned inventory while others face stockouts. The brand’s total inventory position may be adequate, but poor distribution drives both stockouts and excess inventory simultaneously, killing turnover efficiency.
Managing the company’s inventory across multiple warehouses requires holistic tracking and optimization to ensure that inventory is efficiently allocated and converted into sales, supporting both operational efficiency and liquidity.
The inventory velocity variance between fulfillment models creates dramatically different turnover profiles. Amazon FBA inventory often turns faster than owned warehouse inventory for the same products because Amazon’s algorithm-driven demand forecasting and nationwide distribution network enable tighter inventory management. However, brands lose control over inventory placement decisions, and FBA storage fees for slow-moving inventory can become prohibitively expensive, forcing liquidation or removal. Learn more about low-cost bulk storage options like Amazon AWD for FBA sellers.
Ecommerce brands must recognize that fulfillment strategy decisions (warehouse count, location, delivery speed promises, returns routing) directly drive inventory requirements and therefore turnover ratios. Optimizing turnover requires coordinated decisions across inventory purchasing, warehouse placement, and fulfillment promises rather than treating these as independent variables.
Practical ways to improve turnover without sacrificing service levels
To effectively manage inventory and optimize turnover, businesses need a systematic approach that addresses demand forecasting, inventory mix, and operational execution simultaneously.
Improve demand forecasting accuracy to reduce safety stock requirements. Most mid-market ecommerce brands rely on simple historical averages or gut instinct for purchasing decisions. Implementing statistical forecasting that accounts for seasonality, trends, and promotional impacts can reduce forecast error by 20-40%, directly enabling lower safety stock levels without increasing stockout risk. Modern demand forecasting strategies leverage inventory turnover alongside AI and predictive analytics to further enhance accuracy. Cloud-based inventory management platforms and enterprise resource planning (ERP) systems like Cin7, Inventory Planner, or Brightpearl automate this analysis for brands lacking dedicated inventory planners, integrating inventory tracking, replenishment, and quality traceability to improve operational efficiency.
The ABC analysis focuses inventory investment on products that drive revenue. Classify products into A items (top 20% of SKUs driving 80% of revenue), B items (middle 30% driving 15% of revenue), and C items (bottom 50% driving 5% of revenue). Maintain higher turnover targets and tighter inventory control for A items, moderate buffers for B items, and minimal stock or made-to-order approaches for C items. This segmentation prevents slow-moving C items from consuming cash better deployed supporting fast-moving A items.
Accelerate slow-moving inventory liquidation to free trapped cash. Identify products that haven’t sold in 90-180 days and implement aggressive clearance pricing, product bundling with fast-movers, or liquidation through secondary channels. The sooner slow inventory converts to cash (even at a loss), the sooner that capital can fund productive inventory. A product marked down 40% that sells in two weeks generates better returns than the same product sitting at full price for six months while accumulating storage costs.
Optimize reorder points and quantities using data rather than intuition. The Economic Order Quantity (EOQ) model balances ordering costs against holding costs to identify optimal purchase quantities. While the classic EOQ formula makes assumptions that don’t perfectly fit ecommerce, the principle of balancing setup costs against carrying costs remains valid. Brands ordering too frequently incur excessive order fulfillment costs and administrative costs; brands ordering too infrequently tie up excess capital. Most brands should reorder A items more frequently in smaller quantities while B and C items can use larger, less frequent orders.
Negotiate better payment terms with suppliers to reduce working capital pressure. Extended payment terms (Net 60 or Net 90 instead of Net 30) mean products can sell before payment is due, reducing the cash tied up in inventory. Some suppliers offer early payment discounts (2/10 Net 30), and brands should calculate whether the discount percentage exceeds their cost of capital before deciding whether to pay early.
Implement consignment or drop-ship arrangements for slow-moving or long-tail products. Products that sell infrequently don’t justify inventory investment when suppliers can ship directly to customers. The gross margin may be lower due to higher per-unit costs, but the elimination of inventory carrying costs and obsolescence risk often produces better overall profitability.
Vendor-Managed Inventory (VMI) is another effective strategy, where businesses share inventory turnover data with suppliers to maintain optimal stock levels. This collaborative approach helps ensure that inventory is replenished efficiently, reducing the risk of stockouts or overstocking.
Improve inventory visibility across all channels to prevent overbuying. Brands selling through Shopify, Amazon, wholesale partners, and other channels often struggle with fragmented inventory data. When purchasing decisions are made without complete visibility into what’s already in the channel, safety stock buffers multiply across each channel, bloating total inventory. Unified inventory management that aggregates all channel inventory into a single view enables more efficient purchasing.
Use pre-orders and made-to-order for predictable launches. Products with long lead times or uncertain demand can use pre-order strategies to collect orders before purchasing inventory. This shifts inventory risk from the brand to the customer, improving cash flow by collecting payment before inventory investment. The tradeoff is longer delivery times and potential customer frustration if production delays occur.
Optimize warehouse slotting to reduce pick times and improve fulfillment speed. Faster order processing enables same inventory to support higher order volumes, effectively increasing turnover. Placing fast-moving products in easily accessible locations reduces labor time per order, increasing daily order capacity without adding staff. This operational improvement may seem unrelated to inventory turnover but directly affects how much inventory is needed to support a given sales volume.
The inventory ratio is a key performance indicator for evaluating how efficiently a business manages its inventory. Monitoring the inventory turnover ratio is important because it helps businesses make better decisions regarding inventory management, reduce excess stock, and improve cash flow. By tracking this metric, companies can benchmark against industry standards and adjust their strategies to achieve optimal operational effectiveness.
Scale Faster with the World’s First Peer-to-Peer Fulfillment Network
Tap into a nationwide network of high-performance partner warehouses — expand capacity, cut shipping costs, and reach customers 1–2 days faster.
Explore Fulfillment NetworkThe relationship between turnover and business model sustainability
Inventory turnover, also known as stock turnover, ultimately reveals whether your business model’s unit economics are sustainable. The metric connects three critical business dimensions: cash conversion speed (how quickly invested capital returns through sales), operational efficiency (how effectively inventory supports sales volume), and risk exposure (how vulnerable the business is to obsolescence or market shifts). The inventory turnover ratio can also be used to assess a company’s forecasting, inventory management, and sales and marketing expertise.
A sustainable ecommerce business model maintains turnover that supports growth without constant external financing. Brands turning inventory 4-6 times annually while maintaining adequate service levels typically generate sufficient cash flow from operations to fund moderate growth. Brands with turnover below 3 times annually often require external capital to fund inventory purchases, making growth dependent on financing availability rather than operational performance.
The working capital requirement scales inversely with turnover. A brand with $2 million in annual COGS and 4x turnover needs $500,000 in average inventory ($2M ÷ 4). The same brand with 8x turnover needs only $250,000 in average inventory. That $250,000 difference represents freed capital available for marketing, product development, or growth initiatives. For brands in early growth stages where capital is scarce, doubling turnover can be more impactful than doubling revenue.
Cash flow timing creates the hidden constraint most founders underestimate. Even profitable brands with healthy margins can face cash crunches when inventory investment outpaces cash collection. A brand spending $100,000 on inventory in January that sells in March with Net 30 payment terms doesn’t collect cash until April, a 90-day cycle. If growth requires increasing inventory purchases each month, cash outflows can exceed cash inflows despite profitable operations. Higher turnover shortens this cycle and reduces working capital pressure.
The inventory turnover calculation is a key part of understanding these dynamics. The inventory turnover ratio shows how efficiently a company sells and replaces its inventory over a specific period. Inventory turnover also serves as an early warning system for business model problems. Declining turnover often signals weakening demand before revenue declines become obvious, particularly when sales growth masks deteriorating inventory efficiency. A brand growing revenue 20% while turnover drops from 6x to 4x is accumulating inventory faster than it’s selling, suggesting demand is softer than purchasing decisions assume.
Frequently Asked Questions
What is inventory turnover ratio and why does it matter for ecommerce?
Inventory turnover ratio measures how many times a company sells and replaces its inventory during an accounting period, calculated as Cost of Goods Sold divided by Average Inventory. For ecommerce brands, this metric reveals cash conversion speed, obsolescence risk, and whether inventory strategy aligns with customer demand. A brand with $1.2 million in annual COGS and $200,000 in average inventory has a turnover ratio of 6.0, meaning each dollar tied up in stock converts to sales roughly every 60 days. This conversion speed determines whether you’re funding growth with customer revenue or depleting cash reserves to finance unsold goods.
How do you calculate inventory turnover ratio?
The standard formula is: Inventory Turnover Ratio = Cost of Goods Sold (COGS) ÷ Average Inventory. COGS represents direct costs attributable to producing goods sold during the period (product acquisition, inbound freight, customs, fulfillment costs). Average Inventory equals (Beginning Inventory + Ending Inventory) ÷ 2. For example, a brand with $1,800,000 in annual COGS, $250,000 beginning inventory, and $350,000 ending inventory calculates: Average Inventory = ($250,000 + $350,000) ÷ 2 = $300,000. Turnover Ratio = $1,800,000 ÷ $300,000 = 6.0. This translates to 365 ÷ 6 = 61 days to sell through average inventory levels.
What is a good inventory turnover ratio for ecommerce brands?
There is no universal “good” turnover ratio because appropriate levels depend on product category, business model, and growth stage rather than fixed benchmarks. Consumables and fast fashion often achieve 8-15 times annually because products move quickly and brands maintain leaner inventory. Furniture and luxury items may operate successfully at 3-5 times annually because business models anticipate longer holding periods. Signs of healthy turnover include steady sales velocity without frequent stockouts, minimal obsolete stock, cash flow supporting operations without emergency financing, and ability to respond to demand shifts. The right number balances preventing cash stagnation against maintaining service levels and fulfillment speed.
How does low inventory turnover hurt ecommerce businesses?
Low turnover traps cash in unsold inventory rather than cycling back through sales to fund operations. A brand with $400,000 in excess inventory earning 2.0x turnover instead of 6.0x has roughly $267,000 in capital unavailable for customer acquisition or growth. Holding costs compound over time through storage fees, insurance costs (percentage of inventory value), and obsolescence risk (especially for products with expiration dates or seasonal relevance). Opportunity cost represents hidden damage where trapped capital cannot fund marketing or product development. Low turnover often creates a vicious cycle where cash constraints prevent ordering fast-moving inventory because too much capital is tied up in slow-movers, further deteriorating inventory mix.
Can inventory turnover be too high, and what problems does that create?
Excessively high turnover from cutting stock levels too aggressively creates serious operational problems. Frequent stockouts result when inventory drops below safety stock requirements, causing immediate lost sales (21-43% of customers buy from competitors rather than wait), long-term customer relationship damage, and competitive disadvantage. Fulfillment costs increase 30-60% per order when lean inventory forces multi-location shipping or expedited shipping from distant warehouses. Supplier relationships suffer under constant rush orders, forfeiting volume discounts and risking deprioritization during capacity constraints. Products with inconsistent availability lose organic search visibility and accumulate negative reviews. High turnover may signal optimal efficiency or operational fragility one demand spike away from customer satisfaction collapse.
How can ecommerce brands improve inventory turnover without increasing stockouts?
Improve turnover while maintaining service through systematic approaches: implement statistical demand forecasting accounting for seasonality/trends/promotions to reduce forecast error 20-40% and enable lower safety stock; use ABC analysis to maintain higher turnover for top 20% of SKUs driving 80% of revenue while accepting lower turnover for slow-movers; accelerate slow-moving inventory liquidation through aggressive clearance, bundling, or secondary channels to free trapped cash; optimize reorder points and quantities using data rather than intuition to balance ordering costs against holding costs; negotiate extended payment terms (Net 60-90) so products sell before payment is due; implement consignment or drop-ship for slow-moving products; improve inventory visibility across all channels to prevent overbuying safety stock; and use pre-orders for predictable launches to shift inventory risk from the brand to the customer.
Written By:

Indy Pereira
Indy Pereira helps ecommerce brands optimize their shipping and fulfillment with Cahoot’s technology. With a background in both sales and people operations, she bridges customer needs with strategic solutions that drive growth. Indy works closely with merchants every day and brings real-world insight into what makes logistics efficient and scalable.
Turn Returns Into New Revenue

Related Articles

TikTok Shop Fulfillment Requirements: How Sellers Can Protect LDR, OTDR, and Delivery Performance
TikTok Shop fulfillment requirements center on speed, tracking, and delivery performance: sellers need to dispatch orders within 2 business days, upload valid tracking information,...
The History of Ecommerce Returns (And Where It Broke)
Introduction Ecommerce returns did not arrive broken.

How to Introduce P2P Returns Without Breaking CX
Introducing peer-to-peer returns without breaking customer experience is mostly a change-management and trust-design problem, not a technology problem.