
The Shipping Speed Paradox: Why DTC Brands Are Slowing Down

In this article
 5 minutes
- The Delivery Arms Race: Amazon and Walmart Go-In
- Meanwhile, DTC Brands Are Quietly Slowing Down
- What Customers Actually Care About
- The Hidden Costs of Chasing Speed
- The Drone Mirage
- Slowing Down on Purpose Is Not the Same as Falling Behind
- The Strategic Path Forward
- Summary
- Frequently Asked Questions
Everyone’s talking about faster delivery. Amazon’s promising drone drops. Walmart’s turning stores into micro-fulfillment centers. And customer expectations? Sky high. But here’s the thing: most DTC brands aren’t speeding up, they’re tapping the brakes.
Sounds counterintuitive, right? But, slowing down might actually be the most strategic move you can make.
The Delivery Arms Race: Amazon and Walmart Go All-In
Let’s start with the big players. Amazon has spent the better part of a decade conditioning customers to expect one- or two-day delivery. In 2024, they doubled down again. More inventory was moved closer to end customers using their “regionalization” strategy, which chopped fulfillment distances in half. The result? According to Supply Chain Dive, 65% of Prime orders in Q2 2025 arrived the same day or the next day.
Walmart isn’t far behind. They’ve converted more than 4,500 stores into last-mile delivery hubs and are investing in AI-powered inventory placement. They’ve even launched parcel stations right inside their stores to boost local delivery capacity.
And yes, both are experimenting with drones. Amazon is testing lightweight drone delivery in a few southern U.S. zip codes. Walmart too. But let’s be honest: we’re still in science-project territory. Drone delivery may be flashy, but it’s barely scratching the surface of what really moves ecommerce.
Meanwhile, DTC Brands Are Quietly Slowing Down
This part of the story isn’t getting enough airtime. While the retail giants race toward one-hour windows, thousands of independent ecommerce brands are stepping back.
Not because they want to disappoint customers, but because they can’t afford to keep up, and chasing Amazon’s logistics playbook is a losing game when you don’t have Amazon’s budget.
You know what I’m seeing? Brands freezing SKUs. Shrinking warehouse footprints. Letting go of that “2-day everywhere” promise. Not because they’re failing, but because they’re adapting.
And it’s not just a gut feel. According to July 2025 reports, Shopify store closures now outpace new installs. Many of those closures are logistics-related, brands crushed under the weight of expectations they could no longer afford to meet.
What Customers Actually Care About
Let’s cut through the noise.
A 2025 McKinsey study shows customers care about three things in this order:
- Free shipping
- Reliable delivery timelines
- Speed (same/next day)
Sustainability? It ranked dead last.
In fact, only 26% of shoppers said they’d pay even $1–2 extra for eco-friendly delivery. And when researchers tracked actual conversions? Fewer than 10% followed through. So while “green shipping” sounds great in a press release, it’s rarely what gets the sale.
Translation: customers expect fast and free. That’s a tough combo for DTC brands with thin margins.
The Hidden Costs of Chasing Speed
The faster you ship, the more you pay. You either:
- Store more inventory closer to the customer (higher storage and distribution costs), or
- Ship from a central location via air (higher parcel and carrier fees), or
- Overstaff fulfillment ops and erode margin at scale
Speed isn’t free, and when volume slows or inventory piles up, you’re left with expensive sunk costs.
We’re seeing the result now. DTC brands are caught in the “stockpile trap,” where inventory equals cash sitting on shelves. Remember, inventory isn’t just product; it’s tied-up working capital. If you can’t sell it fast enough to fund reorders, you’re stuck.
The Drone Mirage
Let’s revisit the drones. They’re real. They’re operational in some pilot markets. But they’re limited to:
- Small packages under 5 pounds
- Favorable weather
- Specific delivery zones with limited obstructions
For the average brand selling apparel, home goods, or supplements, drones don’t meaningfully move the needle yet. And they won’t for most of 2025. If you’re betting your fulfillment future on drone scalability, you’re early. Way early.
Slowing Down on Purpose Is Not the Same as Falling Behind
When growth stalls, I don’t panic. I pause. I fix what’s broken, not what’s trending.
At Cahoot, we’re seeing smart brands slow down intentionally to:
- Vet new 3PLs or hybrid fulfillment solutions
- Reprice SKUs based on true landed cost
- Trim the fat from overbuilt operations
- Reallocate dollars from speed to retention
Slowing down doesn’t mean giving up. It means strengthening the core so you can scale sustainably when the market rebounds.
The Strategic Path Forward
Here’s the real takeaway: you don’t have to match Amazon or Walmart on delivery speed to win. You just have to meet your customers’ expectations and protect your margin while doing it.
Use 2025 to:
- Reaudit your shipping promises
- Simplify where needed
- Explore fulfillment partners that optimize speed and cost
- Make sure every dollar in ops contributes to LTV, not just CTR
Because speed is sexy, but resilience is what keeps you in the game.
Summary
The shipping speed paradox is reshaping ecommerce strategy. While Amazon and Walmart continue pushing toward same-day and next-day delivery, many DTC brands are deliberately slowing down because matching that level of speed can be expensive and difficult to sustain. Customers still prioritize free shipping and reliable delivery timelines over maximum speed, which gives brands an opportunity to focus on consistency, margin protection, and operational efficiency. By reassessing shipping promises, simplifying fulfillment, and optimizing for both cost and customer expectations, DTC brands can stay competitive without sacrificing profitability just to chase faster delivery.
Frequently Asked Questions
What is the “shipping speed paradox” in ecommerce?
It refers to the trend where retail giants are racing toward faster delivery, while many DTC brands are pulling back due to cost and sustainability constraints.
Are consumers really demanding same-day delivery?
Not necessarily. Most customers prioritize free shipping over speed. Same- or next-day delivery is nice to have, not a dealbreaker for most shoppers.
Why are DTC brands slowing down their delivery promises?
Because matching Amazon-level speed is expensive and often unsustainable for smaller brands without massive logistics infrastructure.
What’s the status of drone delivery for ecommerce brands in 2025?
Still very early. Amazon and Walmart are testing drone delivery, but it remains limited to small packages and specific markets.
How can DTC brands stay competitive without fast delivery?
By offering reliable shipping timelines, clear communication, and great post-purchase experiences. Fulfillment partners like Cahoot can also help streamline speed without killing margin.
Written By:

Manish Chowdhary
Manish Chowdhary is the founder and CEO of Cahoot, the most comprehensive post-purchase suite for ecommerce brands. A serial entrepreneur and industry thought leader, Manish has decades of experience building technologies that simplify ecommerce logistics—from order fulfillment to returns. His insights help brands stay ahead of market shifts and operational challenges.

Turn Returns Into New Revenue
Related Articles
Walmart Officially Allows Amazon Multi-Channel Fulfillment (MCF)
Big news for multichannel sellers: Walmart now officially allows Amazon Multi-Channel Fulfillment (MCF), Amazon’s service for using its fulfillment network to ship orders from mult...

Why More Automation Didn’t Lower Return Costs
Returns automation does improve returns operations: it cuts manual touches, smooths intake, speeds sorting, and makes workflow execution more consistent.
Shopify Subscription Payment Change: Why It Could Hurt Reactivation
Shopify changed how subscription payment information is handled at cancellation.
Why Cross-Border DTC Brands Are Moving Fulfillment Inside the US
In this article
18 minutes
- What the De Minimis Exemption Was and Why Its Removal Changes the Model
- The Aritzia Case: What Executing This Transition at Scale Looks Like
- What Relocation Operationally Requires
- This Is a Distribution Problem, Not a Manufacturing Problem
- When U.S. Domestic Fulfillment Makes Financial Sense
- Entering the U.S. Without a Long-Term Lease Commitment
- Frequently Asked Questions
Cross-border ecommerce fulfillment is the process of shipping ecommerce orders across national borders—often from warehouses outside the United States to U.S. consumers—and for brands built around direct-to-consumer parcel shipping, that model has lost its cost foundation. The elimination of the de minimis exemption has converted what was a variable, duty-free international shipping model into one that incurs import duties, customs processing fees, and brokerage costs on every single order. The rapid growth of global ecommerce and the surge in online shopping, especially during the COVID-19 pandemic, have increased both the complexity and importance of cross border ecommerce fulfillment. Rising consumer expectations for fast and affordable shipping are forcing brands, logistics managers, and ecommerce teams to rethink whether fulfilling U.S. customers from overseas still makes operational or financial sense.
For a growing number of cross-border DTC brands, the answer is no. The operational response is relocation: moving U.S. order fulfillment inside the country, shifting from a variable international shipping cost structure to fixed domestic infrastructure. This article examines what that shift looks like in practice, including the impact of de minimis removal, examples such as brands moving fulfillment closer to U.S. demand, the cost and working-capital tradeoffs of domestic fulfillment, tax and compliance requirements, and when flexible 3PL or distributed U.S. networks start to make sense. This is not a contingency plan. It is becoming the operational baseline for any brand with meaningful U.S. volume.
What the De Minimis Exemption Was and Why Its Removal Changes the Model
The de minimis exemption, codified under Section 321 of the U.S. Tariff Act, allowed imported shipments valued at $800 or less to enter the United States duty-free with minimal customs documentation. For cross-border DTC brands, this provision was the structural logic behind shipping individual consumer orders from a Canadian, European, or Asian warehouse directly to U.S. customers. The brand paid no duties on individual parcels below the threshold, kept fulfillment consolidated in one location, and the U.S. customer received their order without customs friction.
At its peak, more than 1 billion packages annually entered the United States under de minimis. The provision has now been eliminated for shipments from China and Hong Kong, and suspended globally, with permanent legislative repeal set for July 1, 2027. Every cross-border DTC parcel that previously entered duty-free now triggers import duties, customs duties, import taxes, per-shipment customs processing fees, and brokerage charges that can add $15 to $30 or more to the landed cost of a single consumer order.
The math breaks fast at any meaningful volume. A brand shipping 2,000 U.S. orders per month from Canada that previously paid zero duties on those shipments now faces a recurring monthly import cost that did not exist before. That cost does not scale down as the brand grows. It scales up. And unlike a carrier rate that can be negotiated or a warehouse lease that can be amortized, it hits on every order, every month, with no offset. Unexpected extra fees at checkout, such as customs duties and import taxes, can also lead to increased cart abandonment rates among U.S. customers.
The Aritzia Case: What Executing This Transition at Scale Looks Like
Aritzia, the Vancouver-based fashion retailer, is the most documented example of a cross-border brand executing a proactive U.S. fulfillment transition, similar to other brands highlighted in case studies on migrating fulfillment partners. The company had been fulfilling a portion of U.S. international orders from its Canadian distribution network, leveraging de minimis to ship individual parcels across the border duty-free.
Anticipating the exemption’s removal, Aritzia expanded its existing U.S. distribution center in Groveport, Ohio from roughly 240,000 square feet to approximately 560,000 square feet, more than doubling the physical footprint. This expansion allowed Aritzia to better serve the U.S. region. The company then transitioned from third-party to in-house operation of the facility, hired additional staff, and pulled forward equipment retrofitting work before the global suspension took effect in late August 2025.
When the exemption was removed, Aritzia had already relocated all U.S. order fulfillment to the Ohio facility. The company reported operating at triple the throughput capacity compared to its pre-transition baseline, with a path to quadruple capacity through further optimization. Critically, the company stated that service levels for U.S. customers were not impacted during the transition. Maintaining high service levels helped Aritzia retain its U.S. customer base throughout this period.
The financial disclosure was direct. Aritzia reported approximately 400 basis points of gross margin pressure from trade-related headwinds, with roughly one-third of that attributable specifically to the de minimis removal rather than broader tariff exposure. That is a real cost. It is also a cost the company absorbed without degrading delivery performance or customer experience, which is the operational benchmark other cross-border brands now have to work against.
The Aritzia case illustrates the central tension in this transition: the cost of relocating is visible and immediate, while the cost of not relocating compounds quietly until it becomes structural.
What Relocation Operationally Requires
Understanding that U.S. fulfillment is necessary is not the same as being ready to execute it. The transition involves several simultaneous operational changes, each with its own lead time and capital requirement.
Inventory repositioning is the first constraint. Effective supply chain management is crucial here, as brands must coordinate the movement of goods and maintain visibility across multiple locations. A brand that has been fulfilling U.S. demand from a home-country warehouse needs inventory management discipline to determine how much U.S.-facing inventory to pre-position domestically, establish inbound replenishment flows from suppliers or the origin warehouse to the new U.S. node, and manage the transition period when both locations are active, since maintaining inventory accuracy is critical for timely deliveries and avoiding out-of-stock situations during the transition. For seasonal or trend-driven categories, this requires demand-based planning rather than simply mirroring historical stock levels. That planning also depends on a deep understanding of market demand patterns and customer behavior. Regular inventory counts and close tracking of inventory movement are essential to keep accurate inventory records and reduce delayed shipments. Leveraging the resources of a third-party logistics provider can help ensure a smooth transition by providing the necessary infrastructure and expertise, especially when brands follow a structured approach to migrating to a new 3PL successfully and apply criteria for choosing the right 3PL company.
U.S. warehouse capacity is the second. Whether the brand is signing a direct lease or engaging a third-party logistics provider, securing space in a U.S. fulfillment center to receive and store inventory in a logistics-relevant market takes time, and brands targeting the Northeast corridor often look at New York order fulfillment services with fast regional coverage. National industrial vacancy has loosened from the historic lows of 2022, but well-located, smaller-format space in dense markets remains constrained. A five-year direct lease requires volume confidence that can be difficult to hold during a period of policy uncertainty. Third-party logistics arrangements on a per-order basis avoid that commitment but carry higher unit costs at scale, which is why many brands also evaluate alternative ecommerce fulfillment models beyond traditional 3PLs.
Carrier contract changes follow from the location shift. A brand that has been negotiating international shipping rates for Canada-to-U.S. parcels needs domestic parcel agreements with USPS, UPS, FedEx, or regional carriers. Domestic rates are negotiated based on origin, volume, zone distribution, and package profile. Starting from scratch on these negotiations means paying closer to published rates in the early months, which can inflate per-order shipping costs until volume builds.
Tax and compliance obligations expand immediately when a U.S. warehouse is opened. Physical presence in a state creates sales tax nexus in that state from the first day of operation, requiring registration, collection, and filing. The United States has more than 12,000 taxing jurisdictions. For a Canadian or European brand with no prior U.S. tax compliance history, this is a meaningful administrative and cost addition that requires either in-house capability or a qualified U.S. tax advisor before the warehouse opens, not after. It is also essential to comply with U.S. regulations regarding customs, duties, licensing, and customs clearance to avoid disruptions in cross border ecommerce fulfillment, and automation in customs processes helps maintain compliance by keeping documentation and tariff-code updates current.
Working capital requirements increase because pre-positioning domestic inventory means paying for goods and duties before they sell. A brand accustomed to fulfilling U.S. orders from shared home-country inventory now needs to fund a dedicated U.S. stock position. Carrying costs for U.S. inventory typically run 20 to 30 percent of inventory value annually when accounting for capital, storage, insurance, and obsolescence risk. For high-SKU-count or seasonal businesses, this working capital demand can be significant.
During the relocation, the right tools matter: ecommerce fulfillment software with inventory management software features can provide real time visibility through advanced technology to support inventory accuracy and compliance, particularly for brands evaluating Shopify-focused ecommerce fulfillment services.
This Is a Distribution Problem, Not a Manufacturing Problem
It is worth being precise about what kind of problem this is, because the solution set depends on it.
The de minimis removal is specifically a cross border fulfillment and cross border logistics issue. It affects brands that were shipping individual consumer orders from outside the United States and relying on the exemption to avoid per-shipment duty costs. The fix is a distribution change: moving the last-mile fulfillment origin inside the country. The brand’s manufacturing geography, supplier relationships, and product cost structure are separate questions with separate answers.
For cross border ecommerce brands, adapting their cross border operations is essential to remain competitive. A Canadian apparel brand that sources from Vietnam and was fulfilling U.S. orders from Toronto is not being asked to reshore manufacturing. It is being asked to establish a U.S. distribution node so that individual consumer shipments originate domestically. Those are operationally distinct projects. Conflating them leads to analysis paralysis, because reshoring manufacturing is a multi-year, capital-intensive decision, while establishing a third-party logistics relationship in the U.S. Midwest can be operational in 60 to 90 days.
When U.S. Domestic Fulfillment Makes Financial Sense
The decision to establish U.S. fulfillment infrastructure depends on variables that are specific to each brand’s operation. Brands must evaluate cost-effective shipping options and solutions to address their ecommerce needs, ensuring that their international logistics strategies align with business goals and customer expectations.
Volume is the primary threshold. The fixed costs of domestic fulfillment, whether a direct lease or a 3PL monthly minimum, require sufficient order volume to justify. Third-party logistics minimums average around $500 per month in 2025, but the real break-even is in order throughput. The general threshold at which U.S. domestic fulfillment becomes financially superior to cross-border shipping with duties is roughly 500 to 1,000 U.S. orders per month. At that volume, per-order duty and brokerage savings of $15 to $25 more than offset the fixed cost of a 3PL relationship, often with margin to spare.
Average order value intersects with duty exposure in a non-linear way. A brand with a $200 average order value already had limited de minimis benefit on higher-ticket items. A brand with a $45 average order value was capturing maximum benefit from the exemption on nearly every order. For the latter, the duty exposure per order as a percentage of revenue is substantially higher, and the case for domestic fulfillment is correspondingly stronger at lower volume thresholds.
Product category and tariff rate determine the actual per-order duty cost. Apparel from Canada faces different rates than electronics from Europe. Brands should model their specific duty exposure against their actual product mix and origin country before assuming a generic rate applies.
The cost variables that change when moving to domestic U.S. fulfillment are worth mapping explicitly. International shipping cost with duties is replaced by domestic pick-and-pack fees and domestic parcel rates. Variable per-shipment customs costs are replaced by fixed 3PL fees and amortized inbound bulk import costs. Working capital requirements increase. Tax compliance costs appear. Net per-order landed cost typically decreases materially for brands above the volume threshold. However, brands face key challenges and other challenges during this transition, such as navigating new compliance requirements, managing fluctuating shipping rates, and optimizing logistics. Choosing cost-effective solutions and the right shipping options can help overcome these challenges and ensure a smooth shift to domestic fulfillment.
Entering the U.S. Without a Long-Term Lease Commitment
The structural challenge for cross-border brands evaluating U.S. fulfillment in the current environment is that many businesses hesitate to pursue cross border ecommerce fulfillment due to the complexities of shipping internationally and managing operations across different countries and borders. Traditional entry paths require fixed-cost commitments at a moment when policy conditions are still evolving. A five-year warehouse lease is a significant bet on volume projections and stable regulatory conditions. Most mid-market brands are not in a position to make that bet with confidence right now.
Flexible, distributed fulfillment networks offer a lower-commitment alternative. Partnering with a third-party logistics partner that provides specialized order fulfillment services for ecommerce companies offers the services, support, and resources needed for international expansion and global expansion. Third-party logistics providers operating multi-client shared warehouse networks allow brands to access U.S. fulfillment capacity without signing multi-year leases, paying only for the space and labor they actually use, and a Cahoot vs. ShipMonk comparison illustrates how different networks can impact cost and delivery speed. This model carries higher per-unit costs than a dedicated facility at high volume, but it allows a brand to establish a U.S. footprint, validate the operational model, and build volume before making a capital commitment. Distributed fulfillment networks help ecommerce businesses reach new customers and enter new markets, including emerging markets and international markets, by providing the flexibility to test and scale in different regions, much like a strategically located national fulfillment services network that accelerates shipping and reduces costs.
Distributed networks add a further advantage beyond flexibility. International fulfillment solutions are designed to meet the needs of the end customer and address high demand periods. A brand that places inventory across two or three U.S. nodes rather than a single location can reduce average shipping distance to customers, which lowers carrier costs and compresses delivery times simultaneously. For a cross-border brand accustomed to two-to-five-day transit times from Canada, a distributed domestic network can actually improve delivery performance compared to a single-node domestic model, while the per-order economics continue to improve as volume builds across the network. International ecommerce and selling internationally require tailored strategies to serve consumers in various countries and regions, ensuring compliance and optimizing the customer experience, which is easier when your fulfillment stack includes robust order fulfillment integrations with ecommerce partners across marketplaces and carriers.
Cahoot’s shared fulfillment network and Cahoot Fulfillment Partner Program are designed specifically for this kind of entry. Their US fulfillment centers and ecommerce fulfillment services support business growth by enabling efficient shipping internationally and helping brands manage cross border logistics for international orders. Brands can access U.S. fulfillment nodes without long-term lease commitments, place inventory strategically across multiple locations, and scale capacity in line with actual U.S. demand rather than projected demand.
Frequently Asked Questions
What is the de minimis exemption and why did cross-border DTC brands depend on it?
The de minimis exemption under Section 321 of the U.S. Tariff Act allowed imported shipments valued at $800 or less to enter the United States duty-free with minimal customs documentation. Cross-border DTC brands fulfilling U.S. orders from overseas warehouses relied on this provision to ship individual consumer parcels without incurring import duties on each shipment. Its removal means every cross-border parcel now triggers duty costs, customs processing fees, and brokerage charges that did not previously apply.
How did Aritzia respond to the removal of the de minimis exemption?
Aritzia relocated all U.S. ecommerce order fulfillment from its Canadian distribution network to its existing facility in Groveport, Ohio, expanding that facility from approximately 240,000 square feet to 560,000 square feet before the exemption was suspended. The company reported operating at triple its prior throughput capacity and stated that U.S. customer service levels were not affected during the transition. Aritzia disclosed approximately 400 basis points of gross margin pressure from trade-related headwinds, with roughly one-third attributable specifically to the de minimis removal.
Is relocating U.S. fulfillment the same as reshoring manufacturing?
No. These are operationally distinct decisions. The de minimis removal is a distribution problem: it affects brands shipping individual consumer orders from outside the United States. The fix is moving the U.S. order fulfillment origin inside the country. A brand’s manufacturing geography, supplier relationships, and product cost structure are separate questions. A Canadian brand sourcing from Vietnam can relocate U.S. distribution to an Ohio 3PL without changing anything about how or where its products are made.
At what U.S. order volume does domestic fulfillment become financially superior to cross-border shipping?
The general threshold is approximately 500 to 1,000 U.S. orders per month, though this depends on average order value, product category, applicable duty rates, and shipment dimensions. At that volume, per-order savings from avoided duties and brokerage fees of $15 to $25 typically exceed the fixed cost of a U.S. third-party logistics relationship. Brands with lower average order values or higher duty exposure on their specific product categories may reach this threshold at lower volumes.
What does opening a U.S. fulfillment center do to a brand’s tax obligations?
Physical presence in a U.S. state creates sales tax nexus in that state from the first day of operation, requiring registration with the state tax authority, collection of sales tax on sales to customers in that state, and regular filing and remittance. The United States has more than 12,000 taxing jurisdictions with varying rates and rules. For cross-border brands without prior U.S. physical presence, this compliance obligation requires either in-house tax capability or a qualified U.S. tax advisor before the warehouse opens. Economic nexus rules established after South Dakota v. Wayfair may also create collection obligations in additional states based on sales volume alone.
What is the working capital impact of pre-positioning inventory in a U.S. warehouse on inventory management?
Pre-positioning U.S. inventory requires funding a dedicated stock position and paying inbound duties 30 to 90 days before those goods sell. Carrying costs for U.S. inventory typically run 20 to 30 percent of inventory value annually when accounting for capital costs, storage fees, insurance, and obsolescence risk. For brands accustomed to fulfilling U.S. demand from shared home-country inventory, this represents a meaningful increase in working capital requirements that should be modeled before committing to a domestic fulfillment strategy.
Why are distributed fulfillment networks better than a single U.S. warehouse for brands entering from outside the country?
A distributed network places inventory across multiple U.S. nodes rather than concentrating it in one location. This reduces the average shipping distance between inventory and customers, which lowers carrier costs, compresses delivery times, and improves service for customers worldwide by reducing lengthy delivery times and giving shoppers better tracking visibility. For a cross-border brand whose customers are spread across the continental U.S., a single Midwest warehouse may serve central markets well but adds two to three shipping zones for coastal customers. Distributing inventory across two or three strategically placed nodes can match or beat cross-border transit times while reducing per-order shipping cost. That speed and clarity support customer satisfaction and a seamless shopping experience. Distributed networks offered by third-party providers also avoid the multi-year lease commitments that come with dedicated facilities. Inventory inaccuracies can still hurt the buying experience when stock is split across nodes, so allocation has to stay precise. Strong execution in global order fulfillment also depends on keeping customers informed from shipment through delivery.
What cost variables change when a cross-border brand moves to domestic U.S. fulfillment?
The primary shift is from variable international shipping costs with per-shipment duty and brokerage expenses to fixed domestic infrastructure costs with bulk-import duty treatment. Specific variables that change include: international carrier rates replaced by domestic parcel rates; per-shipment customs fees and duties replaced by amortized inbound bulk import costs; zero U.S. sales tax nexus replaced by multi-state compliance obligations; shared home-country inventory replaced by a dedicated U.S. stock position requiring additional working capital; and returns handling added as part of the broader domestic-fulfillment model that supports global ecommerce fulfillment. For a target market in the U.S., local return processes can reduce reverse-logistics and shipping costs compared with sending returns abroad. Returns operations should inspect items for damage before restocking and ensure customers receive prompt refunds or exchanges when appropriate. Net per-order landed cost typically decreases materially for brands operating above the volume threshold where fixed costs are absorbed, and these domestic returns capabilities also support a smoother global marketplace experience for brands selling into the U.S.
Written By:

Rinaldi Juwono
Rinaldi Juwono leads content and SEO strategy at Cahoot, crafting data-driven insights that help ecommerce brands navigate logistics challenges. He works closely with the product, sales, and operations teams to translate Cahoot’s innovations into actionable strategies merchants can use to grow smarter and leaner.
Turn Returns Into New Revenue
Related Articles
Walmart Officially Allows Amazon Multi-Channel Fulfillment (MCF)
Big news for multichannel sellers: Walmart now officially allows Amazon Multi-Channel Fulfillment (MCF), Amazon’s service for using its fulfillment network to ship orders from mult...
Shopify Subscription Payment Change: Why It Could Hurt Reactivation
Shopify changed how subscription payment information is handled at cancellation.
Why Small Ecommerce Brands Are Winning with AI (While Enterprises Struggle)
Conventional wisdom says large companies should dominate AI adoption.
Shopify Estimated Delivery Date: A Complete Guide for Ecommerce Stores
In this article
14 minutes
- Give Your Website Customers an Amazon-Like Delivery Experience
- What Is an Estimated Delivery Date?
- Why Are Estimated Delivery Dates Important for Ecommerce?
- Benefits of Adding Estimated Delivery Dates to Shopify Stores
- How to Add Estimated Delivery Dates on Shopify Using Code
- Pro Tips for Accurate Estimated Delivery Dates
- Final Thoughts
- Frequently Asked Questions
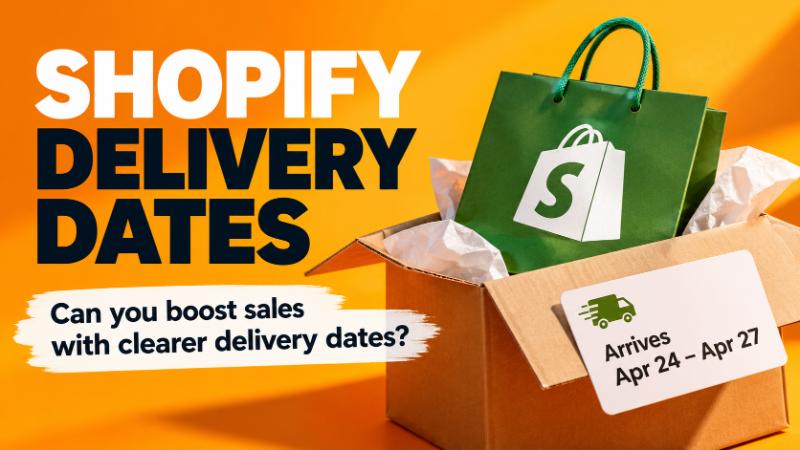
A Shopify estimated delivery date is the specific arrival date or date range shown on a product page before purchase, so shoppers know when an order is expected to arrive. For Shopify merchants who want clearer delivery messaging, more trust, fewer “where is my order” tickets, and better conversion rates, adding that estimate can remove hesitation at the moment a customer is deciding whether to buy, and most stores can do it with a short block of Liquid code instead of another paid app.
Shopify can calculate delivery dates at checkout when your shipping settings are configured for it, but it does not put a delivery promise on the product page by default. That gap matters because shoppers increasingly expect precise timing similar to what they see on Amazon, and a vague “ships in 3 to 7 business days” line does little to make a store feel organized or reliable. This guide explains what a Shopify estimated delivery date is, why it matters for ecommerce, the benefits of adding one, how to add it to product pages with custom Liquid code, and how to keep the estimate accurate.

Give Your Website Customers an Amazon-Like Delivery Experience
Amazon trained online shoppers to expect a specific arrival date on every product page. “FREE delivery Thursday” is a promise, not a range, and shoppers now bring that expectation to every ecommerce business they buy from. When your product page says nothing about timing, the shopper fills the silence with doubt or opens another tab to compare.
The good news is that matching this experience on your own site is easier and less expensive than most merchants assume. You do not need a same-day fulfillment network to show a delivery date. You need honest processing and transit time numbers and a clear way to present them. For a deeper look at how independent stores compete on delivery, view the on-demand webinar and explore Cahoot’s library of educational ecommerce logistics webinars.
What Is an Estimated Delivery Date?
An estimated delivery date (EDD) is the projected day or date window when a customer can expect an order to arrive after placing it. It differs from a generic shipping estimate. “Ships in 3 to 5 business days” leaves the shopper to do the math. An EDD does the math for them: “Arrives between Oct 7 and Oct 9” or “Get it by Friday, Oct 9.”
A reliable Shopify estimated delivery date is built from four inputs:
- Processing time: How long it takes your team or 3PL to pick, pack, and hand the order to a carrier. This includes your daily order cutoff time, which advanced ecommerce order fulfillment services with late same-day cutoffs can help you consistently meet or exceed.
- Shipping method: The service level and carrier, such as ground versus two-day, and the transit time each one realistically delivers.
- Customer destination: How far the shopper is from your warehouse. A customer two zones away and one across the country should not see the same date.
- Holidays and weekends: Days when your warehouse is closed or carriers do not pick up or deliver, which push the arrival date out.
When those inputs are accurate, the EDD becomes a promise you can keep. When they are guesses, it becomes a source of complaints.
Why Are Estimated Delivery Dates Important for Ecommerce?
Delivery timing is part of the product. Shoppers weigh it alongside price, and when it is missing, they either assume the worst or go looking for a store that answers the question. That is why unclear shipping information shows up so often as a reason for abandoned carts.
Estimated delivery dates matter for a few operational reasons:
- They reduce hesitation before checkout. A shopper buying a gift for Saturday needs to know whether it will arrive by Saturday. If the product page cannot tell them, many will not risk it.
- They set expectations your operation can plan around. A published date forces your team to define real processing times and cutoffs, which tightens ecommerce fulfillment overall and often reveals where ecommerce fulfillment software for smarter inventory placement can make those promises easier to keep.
- They shift support volume. “When will my order arrive?” is one of the most common questions a store receives. Answering it before purchase removes a large share of those tickets.
- They make your store look organized. A specific date signals that someone is watching the warehouse and the carriers, which is what shoppers want to believe before handing over a card number.
Speed still matters, but predictability often matters more. A shopper will usually accept a four-day delivery window if the date is clear and the order shows up on time. Cahoot’s guide to shipping speed covers when faster service levels are worth the extra shipping costs.
Benefits of Adding Estimated Delivery Dates to Shopify Stores
For merchants running on Shopify, a product page EDD is one of the lowest-effort changes that touches both revenue and cost. The benefits show up in four places.
Customer trust
A specific date tells the shopper you know your own operation and helps build trust. Trust compounds: customers who receive orders on or before the promised date are more likely to buy again without comparison shopping. That consistency also supports customer loyalty.
Conversion rates
Displaying estimated delivery dates is one of the simplest ways to remove friction. 73% of shoppers let a visible date guide their purchase. Adding that clarity on the product page, instead of waiting until checkout, keeps the buying experience moving. EDDs also support time-sensitive messaging such as “Order within 3 hours for delivery by Friday,” which is useful during gifting seasons and can lift sales.
Customer satisfaction
Satisfaction is shaped by the gap between what a customer expected, how well you set customer expectations, and what happened. A clear, conservative EDD narrows that gap. An order that arrives inside the promised window feels like a satisfying shopping experience, which can lead to a more satisfying shopping experience overall.
Reduced support inquiries
Every “where is my order” email costs time, and clear communication about delivery timing reduces that burden. When the delivery window is on the product page, in the confirmation email, alongside more delivery details on the tracking page, customers have fewer reasons to write in, and your support team can focus on issues that need a person.
How to Add Estimated Delivery Dates on Shopify Using Code
Shopify’s native delivery dates appear at checkout, and only when you use updated shipping settings, set a fulfillment time, and use eligible rate types inside your shopify store; to show an estimate earlier, merchants usually need to add one on the product page. To show an estimate on the product page, you can add a small block of Liquid code to your theme. The approach below skips weekends, respects a daily cutoff, and does not depend on a third-party app unless code is not the best fit and you decide the right app makes more sense.
Step 1: Identify Your Shipping Timeframes
Before touching code, write down the numbers the code will use for delivery time. Pull them from real order data, not from carrier marketing pages.
- Processing time in business days: For example, 1 business day if orders placed before noon ship the next day.
- Daily cutoff hour: The hour after which an order counts as the next business day.
- Minimum and maximum transit time: For example, 3 to 5 business days for standard ground to most of your customer base.
- Regional or service-level differences: Note whether some destinations or shipping methods need their own ranges, including cases where different shipping zones require different estimates, or whether partnering with order fulfillment services for ecommerce companies could support region-specific delivery promises.
Step 2: Open Shopify’s Theme Code Editor
Work on a copy of your theme so a mistake never reaches live shoppers.
- In Shopify admin, go to Online Store > Themes.
- Next to your current theme, open the … menu and select Duplicate.
- On the duplicate, open the … menu and select Edit code.
- If you prefer not to use coding, browse the Shopify App Store for a Shopify app like an estimated delivery date app or delivery date app instead; that is the no-coding path for stores that want setup through the admin.
Step 3: Add Custom Code to the Product Page
Locate the `product.liquid` file (or `product-template.liquid` in Shopify 2.0 themes) and insert the following code snippet where you want the estimated delivery date to appear:
    {% assign processing_time = 2 %} <!-- Adjust processing time in days -->
    {% assign shipping_time_min = 3 %} <!-- Minimum shipping time in days -->
    {% assign shipping_time_max = 5 %} <!-- Maximum shipping time in days -->
    {% assign min_days = processing_time | plus: shipping_time_min %}
    {% assign max_days = processing_time | plus: shipping_time_max %}
    {% assign today_date = 'now' | date: '%Y-%m-%d' %}
    {% assign min_delivery_date = today_date | date: '%s' | plus: min_days | date: '%b %d' %}
    {% assign max_delivery_date = today_date | date: '%s' | plus: max_days | date: '%b %d' %}
<p><strong>Estimated Delivery:</strong> {{ min_delivery_date }} - {{ max_delivery_date }}</p>
The loop steps forward one day at a time, counts only Monday through Friday, and records the dates where the minimum and maximum business-day counts land. An order placed on a Wednesday afternoon with the settings above would show “Wed, Oct 7 to Fri, Oct 9.” This basic approach does not account for inventory or destination-specific rules unless you extend it.
Next, place the snippet on the product page. In Online Store 2.0 themes such as Dawn, open sections/main-product.liquid. In older themes, look for templates/product.liquid or sections/product-template.liquid. Add this line where you want the message to appear, usually just below the price or above the Add to Cart button; merchants who need different messages for specific products usually move beyond one global snippet:
{% render 'estimated-delivery' %}
If you prefer not to edit section files, most 2.0 themes let you add a Custom Liquid block to the product template in the theme editor and paste the render line there.
Step 4: Customize the Message
Change the text inside the <p> tag to match your brand voice, turning it into a customizable delivery message such as “Order today, arrives Wed, Oct 7 to Fri, Oct 9.” You can also use that same block to enhance product-page clarity without changing the rest of the template. Adjust the date format in the date: filters if you want full month names, and add styling for the estimated-delivery class in your theme’s CSS so this feature is easy to spot near the price.
Step 5: Save & Preview the Changes
- Click Save in the code editor.
- Use Preview on the duplicate theme and open several product pages.
- Check the message on mobile, where it is most likely to be pushed below the fold.
Step 6: Test Different Scenarios
Before publishing, confirm the dates hold up against reality.
- Change the processing and transit values and confirm the output moves as expected.
- Check behavior before and after your cut-off hours, and on a Friday afternoon, when weekend skipping matters most.
- Compare the displayed window against actual delivery dates from recent orders to the same destinations, especially if you need separate delivery rules or broader delivery rules by destination.
These tests help produce accurate estimates before publishing.
One technical note: Shopify’s documentation states that ‘now’ reflects the time the Liquid was last rendered, which may not update on every page view because of caching. If you see a date that lags behind, especially around your cutoff time, the same calculation can be moved into a small JavaScript file that runs in the shopper’s browser.
Pro Tips for Accurate Estimated Delivery Dates
A date that is wrong does more damage than no date at all. These practices keep your Shopify estimated delivery date honest.
- Business days: Count only days your warehouse ships and carriers deliver. Add known holidays to your logic, or pad the maximum during peak weeks.
- Location-based estimates: One national range is a starting point. If most of your orders ship regionally, show tighter windows by region. For international orders, account for customs clearance and possible customs delays, and show a wider range for cross border ecommerce shipments while preparing for carrier shipment exceptions and how to fix them fast.
- Multiple shipping options: If you offer standard and express, show a date for each. Shoppers who need speed will see what they are paying for. The same applies to local fulfillment methods like local delivery or in store pickup, which need their own estimates instead of sharing the standard shipping window.
- Carrier delays: Revisit your transit numbers when shipping carriers announce service disruptions, weather events, or peak-season surcharges and slowdowns. Update the settings instead of letting stale numbers overpromise, and consider tools like Amazon Buy Shipping-integrated ecommerce order fulfillment to monitor and respond to delays more effectively.
- Clear customer communication: If an order will miss its window, tell the customer before they ask, which supports the entire shopping journey. Cahoot’s guide to automated shipment monitoring and proactive notification explains how to catch delayed shipments early.
It also helps to connect the estimate to stock levels; for some brands, comparing options like Cahoot vs. ShipMonk for fulfillment performance and cost is part of choosing a network that can actually meet those inventory-linked promises. A more complete setup ties those dates to stock and warehouse status, so a product that ships from a secondary warehouse or needs to be restocked does not show the same date as an item sitting on the shelf.
Final Thoughts
Adding a Shopify estimated delivery date to your product pages is a small change with a direct effect on customer experience, conversion rates, support volume, and cart abandonment. Custom Liquid code gives you control over how the estimate is calculated and displayed without adding another app to your stack.
The code is the easy part. The real work is knowing your processing time, cutoff, and transit windows well enough to publish them. Start with conservative numbers, measure them against actual deliveries, and tighten the window as your data improves. A delivery promise you consistently keep will do more for customer trust than a faster one you occasionally miss, because accurate promises help shoppers feel confident enough to complete a purchase.
Frequently Asked Questions
What is a Shopify estimated delivery date?
A Shopify estimated delivery date is the projected day or date range when a customer’s order is expected to arrive. It is calculated from processing time, shipping method, transit time, destination, and non-shipping days such as weekends and holidays, giving shoppers a direct answer about when the order should arrive.
Does Shopify show estimated delivery dates by default?
Shopify can show delivery dates at checkout when you use updated shipping settings, set a fulfillment time, and use eligible shipping rates. It does not display a delivery estimate on product pages by default, so merchants add one through theme code or an app; for example, tools such as S Estimated Delivery Date Plus can also show dates on checkout pages, while external partners offering Amazon FBM shipping and order fulfillment services help you keep those dates realistic across channels.
Where should I display an estimated delivery date?
The product page is the most important location because it influences the buying decision. The next-most-important touchpoint is the cart page, so repeat the estimate there, at checkout, in the order confirmation email, and on the tracking page so the customer sees a consistent promise.
Can I add estimated delivery dates to Shopify without an app?
Yes. You can create a Liquid snippet that adds your processing and transit days to the current date, skips weekends, and renders the result on the product page. Test it on a duplicate theme before publishing.
How do I keep estimated delivery dates accurate?
Base your settings on actual delivery data, count only business days, account for holidays and your order cutoff, and update transit times when carriers experience delays. Showing a slightly wider window is better than missing a narrow one.
Should international orders show a different estimated delivery date?
Yes. International shipping usually involves longer transit times and customs clearance, so cross border orders should show a separate, wider range than domestic orders.
Written By:

Indy Pereira
Indy Pereira helps ecommerce brands optimize their shipping and fulfillment with Cahoot’s technology. With a background in both sales and people operations, she bridges customer needs with strategic solutions that drive growth. Indy works closely with merchants every day and brings real-world insight into what makes logistics efficient and scalable.
Turn Returns Into New Revenue
Related Blog Posts
10 Best European 3PLs for Ecommerce Sellers in 2026

In this article
33 minutes
- Key takeaways
- European 3PL comparison table
- How we evaluated the best European 3PLs
- Europe is not one fulfillment market
- The best European 3PLs for ecommerce sellers
- Other European 3PLs worth considering
- Which European 3PL fits your business?
- Questions to ask before signing with a European 3PL
- Final recommendation
- Frequently asked questions
Bigblue is the best overall choice among the best European 3PLs in this comparison: one provider with 11 fulfilment centres across France, Spain, Italy, the UK, and Germany, its own operating software, and post-purchase tools built in. everstox, Paxon (including Active Ants), Fulfillment-Box, and Bleckmann are also worth a look for specific needs: distributed fulfillment through one platform, large-scale automated operations, Amazon and marketplace selling, and fashion and lifestyle logistics. Bigblue earns the top spot for its balance of ecommerce fit and operating model, not because it runs the largest network or suits every brand. That qualification matters, because Europe is not one logistics market. A provider’s real fit depends on whether you sell into the EU, the UK, or both, where inventory is physically held, who operates each warehouse, which sales channels you run, what your catalog looks like, how much volume you ship, and what the full cost of the setup is once working capital, returns, and management time are counted.
Key takeaways
- Shipping coverage is not warehouse coverage. A provider that “delivers to 30 countries” may hold inventory in only one or two of them. Ask where stock physically sits.
- The EU and the UK are separate customs and tax environments. Serving both usually means inventory on each side, or accepting customs friction on every cross-border order.
- Directly operated sites and partner-network sites need different diligence. Platform-led networks offer reach and flexibility; directly operated networks offer tighter control. Neither is automatically better.
- More fulfillment nodes are not free. Each added location can shorten delivery times but splits inventory, raises safety stock, and adds transfers and management overhead.
- DTC, Amazon, marketplaces, B2B, and returns are distinct jobs. A strong FBA prep operation is not the same thing as a strong branded DTC operation.
- Use this list to build a shortlist, not to skip due diligence. Provider claims here are drawn from public sources and attributed; confirm current terms and capabilities directly.
European 3PL comparison table
| Provider | Distinction | Best fit | Operating model | Physical footprint (public summary) | Channel strengths | Watch-out |
| Bigblue | Best Overall European 3PL | DTC brands scaling in France, Spain, Italy, Germany, and the UK | Single provider running its fulfilment centres on one operating platform | 11 fulfilment centres across France, Spain, Italy, the UK, and Germany (confirmed by Bigblue to Cahoot, September 30, 2026) | DTC, B2B, branded tracking, returns portal | Model cross-border transit times to the Nordics and Central and Eastern Europe |
| everstox | Best for Distributed Fulfillment Through One Platform | Brands wanting multi-country inventory under one contract and one software layer | Platform connecting a network of partner 3PL warehouses | 70+ locations across Germany, the UK, France, Italy, Spain, Benelux, Poland, Switzerland, and the US (company-reported) | D2C, marketplaces, B2B, retail | Accountability and SLA consistency across partner sites |
| Paxon, including Active Ants | Best for Large-Scale Automated Fulfillment | High-volume and omnichannel brands needing automation and local depth | Group of directly operated 3PL businesses unified under one brand in 2026 | Active Ants lists centers in the Netherlands, UK, Belgium, Germany, and France; Staci and Radial add further sites | B2C, B2B, omnichannel, automated ecommerce | Scale and enterprise complexity may exceed what a smaller brand needs |
| Fulfillment-Box | Best for Amazon and Marketplace Sellers | Amazon-led and multi-marketplace sellers entering Europe | Provider with European and global warehouse locations; operating model per site not detailed publicly | Company describes eight warehouses in six European countries, with center pages for Germany, Poland, and the UK | FBA prep, FBM, SFP, marketplace integrations | Marketplace strength is not the same as branded DTC capability |
| Bleckmann | Best for Fashion and Lifestyle | Fashion, lifestyle, and beauty brands with seasonal, returns-heavy flows | Directly operated specialist logistics group | 40+ sites in the Netherlands, Belgium, Spain, the UK, and the US (company-reported) | Omnichannel, D2C, B2B wholesale, returns, value-added services | Enterprise and category depth may be more than a simple early-stage catalog requires |
| Huboo | Other notable provider | Small and mid-size brands wanting an accessible, tech-led model in the UK and EU | Company says it owns its warehouses and technology | UK (Bristol), Spain (Madrid), Netherlands, plus US | Marketplaces, webshops, 35+ integrations | Confirm EU site details and commercial minimums |
| fulfilmentcrowd | Other notable provider | Brands wanting one contract across UK, EU, and non-EU markets | Asset-light platform using partner-operated sites | 17 locations across the UK, France, Germany, the Netherlands, Ireland, the US, and Australia (company-reported) | Omnichannel, B2B, DTC, Amazon | Which entity runs each node, and how SLAs hold across partners |
| Salesupply | Other notable provider | Cross-border brands needing returns and customer service alongside fulfillment | Operating model per site not stated publicly | Fulfillment center pages in Belgium, France, Germany, Denmark, Spain, Poland, and the UK | Cross-border DTC, local returns, customer service outsourcing | Which services and facilities apply in each target country |
| FLEX. Fulfillment | Other notable provider | Amazon and non-EU sellers wanting FBA prep plus B2C fulfillment | Company describes its sites as its own warehouses | Six sites: three in Germany, one each in France, Poland, and the UK | FBA prep, FBM, marketplaces, webshops | Confirm country-specific scope, returns handling, and volume economics |
| Bolian Logistics | Other notable provider | Brands prioritizing Spain and Iberia with cross-border EU delivery | Spain-based 3PL | Spain (Barcelona-based operation) | Shopify and other webshops, B2C, B2B, returns | Regional fit rather than a pan-European node network |
How we evaluated the best European 3PLs
We assessed each provider against the questions an operator should ask when outsourcing logistics in Europe, weighted toward what actually changes cost, speed, and risk:
- Relevance to ecommerce: whether the provider’s public positioning, processes, and integrations are built for online order profiles rather than primarily pallet or freight flows.
- Physical European inventory footprint: where the provider says it holds stock, kept separate from where it ships.
- EU and UK reach: whether a provider can hold inventory on both sides of the EU and UK customs border.
- Operating model and accountability: directly operated facilities, a partner network, or a mix, and what that means for who answers when something goes wrong.
- Channel and workflow capability: DTC, marketplaces, Amazon FBA prep and merchant-fulfilled orders, B2B and wholesale, returns management, and value-added services such as kitting and custom packaging.
- Technology and integrations: shop platform and marketplace connectors, APIs, api integrations, and real time visibility into inventory and orders, supported by robust ecommerce partner integrations.
- Scalability: evidence the operation can absorb peak volume and additional markets without breaking inventory management discipline or wider supply chain operations.
- Customer-experience features: branded tracking, delivery options, and returns flows that affect customer satisfaction.
- Clarity of public information: whether the provider publishes enough detail for a buyer to verify claims.
This is research based on publicly documented capabilities and Cahoot’s experience evaluating fulfillment networks, and advanced analytics is essential for effective warehouse management, with modern ecommerce fulfillment software playing a central role in better operational decision-making. We did not place identical test orders through every provider, and we have not audited any provider’s facilities. Where a claim comes from a provider’s own website and could not be independently verified, we attribute it (“the company says”). Rankings reflect fit for the ecommerce operator described below, not an absolute judgment of quality. If you are new to outsourcing, our guide on how to choose the right 3PL covers the general framework this comparison builds on.
Europe is not one fulfillment market
Many US brands approach Europe the way they approach the lower 48 states: pick a central warehouse, turn on shipping, and expand. That model breaks down quickly. Europe has multiple customs regimes, dozens of national carriers, different consumer expectations around delivery and returns, and real differences in how far a parcel can travel in one or two days. The five distinctions below drive most of the difference between a good and a bad provider choice.
Treat the EU and the UK as two separate cross border markets
Since Brexit, goods moving between Great Britain and the EU cross a customs border. That means customs declarations, possible duties depending on product origin, separate VAT treatment, and slower, more exception-prone parcel flows than domestic or intra-EU shipping. Shipping DTC orders from a UK warehouse to Germany, or from a Dutch warehouse to London, puts customs clearance on every single order.
For most brands with meaningful demand in both regions, the practical answer is inventory on each side: at least one node in the UK market and at least one in the EU, which helps serve european consumers in both regions without repeated border friction. When comparing providers, check whether they operate on both sides and whether both sides run on the same systems and processes. This article does not give tax or customs advice; confirm VAT registration, importer-of-record arrangements, customs brokerage support, regulatory compliance, and how VAT representations and proper HS codes will be managed when goods move between the UK and EU with a qualified advisor or customs broker before choosing a setup, and pair that with a provider whose ecommerce order fulfillment services can execute reliably on your chosen structure.
Shipping coverage and warehouse coverage are different claims
A provider that says it serves “all of Europe” is usually describing delivery reach: the countries its carrier network can deliver to. That is not the same as having fulfillment centers in those countries or true pan European fulfillment capacity. A single warehouse in France can ship to Poland, but the parcel travels further, costs more, and takes longer than one shipped from a node in Central Europe.
Every profile below separates the two. When you evaluate providers, ask for a list of sites where your inventory could be stored, the transit time from each site to your top five destination countries, and the last mile delivery options available in each market (home delivery, pickup points, lockers). Central European hubs often support 1 to 3 day delivery to major EU member states.
For many brands, a two-node setup can reach about 90% of European consumers within 1 to 3 days, depending on carrier mix and inventory placement, similar to how US brands use distributed fulfillment center networks to hit 1–2 day delivery targets.
Direct operations and partner networks need different diligence
European 3PL companies broadly fall into three models. Some operate their own warehouses. Some are platforms that route your inventory and orders into a network of independent warehouses run by other logistics providers. Others mix the two.
Partner networks can give fast access to many locations and a single software layer. The tradeoff is that the warehouse floor at each location is run by a different company. That raises specific questions: who you contract with, whose SLA applies at each site, how inventory accuracy is measured across partners, and who pays when a partner misses. Directly operated networks usually offer tighter control and one accountable party, but fewer locations and less flexibility to add a new country quickly.
More inventory nodes and inventory management can raise total cost, not just lower transit time
Adding a second or third fulfillment center can cut delivery times and shipping costs for orders near each node. It also splits inventory into smaller pools and gives you access to more warehouse space. Each pool needs its own safety stock, so total inventory usually rises. Replenishment becomes more complex, stock transfers between sites add freight and handling, returns may land far from where the item sells next, and your team now manages more stock positions.
That is why inventory routing, meaning the decision about which SKUs to stock at which node and in what quantity, matters as much as the provider’s location count. A brand selling mostly into France and Spain may do better with deep inventory in one or two well-placed sites than with thin inventory spread across six countries. Model working capital, storage costs, transfers, returns, warehouse costs, and operational costs before assuming more nodes is better, especially because these inputs vary by region across Europe. European warehouse rates can range roughly from €45 to €150 per square meter per year, and Poland is one of the fastest-growing warehousing markets in Europe, which can affect where storing inventory makes sense.
DTC, Amazon, marketplaces, and B2B are different operations
A provider can be excellent at one workflow, especially order fulfillment services for ecommerce, and average at another. Branded DTC fulfillment emphasizes unboxing, tracking communication, and a smooth returns experience. Amazon FBA prep emphasizes labeling, carton and pallet compliance, and accurate transfers into Amazon’s network, which is a very different discipline. European marketplaces such as Zalando, bol.com, Otto, and Kaufland each have their own requirements. B2B and wholesale bring pallet orders, retailer compliance, and appointment scheduling.
For Shopify-led brands, e commerce logistics execution, integration quality, and order sync reliability usually matter most; our guide to choosing the best Shopify 3PL and broader advice on Shopify order fulfillment options covers what to test. Before shortlisting, list your channels by share of volume and ask each provider for evidence it runs your top two at scale, since a provider can be the right fulfillment partner for one workflow and a weak fit for another.
The best European 3PLs for ecommerce sellers
1. Bigblue: Best Overall European 3PL
What it is and why it made the list. Bigblue is a Europe-first third party logistics provider for ecommerce brands, built around modern DTC operators. The company says it serves more than 600 brands and supports both B2C and B2B fulfillment, allowing businesses to stay focused on their core business while the provider handles day-to-day logistics and growth support. It made the list because it combines a European warehouse network, its own operating software, and customer-experience features in a single relationship, which is what many brands entering Europe actually need.
Why it wins Best Overall. For a DTC brand selling into France, Spain, Italy, Germany, and the UK, Bigblue covers these core markets from one provider, with one contract, one operating platform, and a strong focus on the post-purchase experience, from delivery dates at checkout to branded tracking and returns. It is the most complete starting point for the typical ecommerce operator this article is written for. Other providers here may be a better fit when a specialized workflow or a different geographic footprint drives the decision.
Physical footprint versus countries served. Bigblue confirmed to Cahoot on September 30, 2026 that it runs 11 fulfilment centres across France, Spain, Italy, the UK, and Germany, including a fashion-oriented warehouse and an organic-certified facility in France. Delivery reach is much wider than the warehouse footprint: Bigblue ships from these sites across Europe and worldwide, including cross-border customs support. Brands with substantial demand in the Nordics or Central and Eastern Europe should model transit times and costs to those markets from Bigblue’s sites.
Operating model. Bigblue runs its fulfilment centres as a single network on its own platform, giving brands one contract and one system across sites.
Capabilities and channels. According to Bigblue’s website, capabilities include inventory management tools and:
- Branded tracking emails and delivery-date estimates shown before purchase. Bigblue reports that its Fast Tags and delivery estimates can lift checkout conversion by 26%; this is its reported result, not a guaranteed outcome for every brand.
- A self-serve returns portal with exchange, store credit, and refund options
- Connections to local carriers, including pickup-point and express options
- Branded and personalized unboxing, including rules-based inserts and samples
- Real time inventory tools with alerts and allocation across B2C and B2B
Best-fit customer. DTC brands, often Shopify-led, that sell primarily into France, Spain, Italy, Germany, and the UK, care about the delivery and returns experience, and want B2B or retail orders handled from the same inventory.
Considerations
- Brands whose largest markets are in the Nordics or Central and Eastern Europe should model transit times to those markets, served cross-border from Bigblue’s sites.
- Bigblue integrates with Amazon FBA and FBM; marketplace-led sellers should check the specific workflows they need.
Sources: bigblue.co | Fast Tags and ETAs | Amazon integration. The 11-centre count was confirmed directly by Bigblue on September 30, 2026.
2. everstox: Best for Distributed Fulfillment Through One Platform
What it is and why it made the list. everstox is a platform-led fulfillment provider that connects brands to a network of third-party logistics partners (third party logistics 3PL) through one software layer and one commercial relationship. It made the list because it offers the broadest access to European inventory locations of any provider here without requiring a brand to contract with each warehouse separately.
Why it wins its category. For brands that want inventory in several European countries, everstox reduces the management burden of running many separate 3PL relationships. The company says orders can be routed automatically to the best-placed fulfillment center based on configured rules, with carrier selection and optimized shipping routes helping improve delivery efficiency, and stock can be redistributed between warehouses, according to its multichannel fulfillment page.
Physical footprint versus countries served. The company’s locations page lists 70+ warehouse locations across Germany, the UK, France, Italy, Spain, Benelux, Poland, Switzerland, and the US. Germany is described as its densest market. Delivery reach extends beyond these countries through more than 15 carrier partnerships, the company says.
Operating model. Partner network. everstox describes itself as uniting an integrated network of 3PLs and carriers through a central platform, with shared operational standards across sites.
Capabilities and channels. D2C, marketplaces such as Amazon, Zalando, and eBay, B2B, and retail. The company says it is pre-integrated with 15+ systems, including Shopify, Shopware, WooCommerce, Amazon, Xentral, and Microsoft Dynamics, with an open API that supports custom api integrations and broader supply chain visibility across systems, per its integrations page.
Best-fit customer. Growth-stage and established brands, particularly with strong German-speaking demand, that want multi-country inventory placement and multi channel fulfillment without building their own partner network.
Considerations
- Ask how partner warehouses are selected for your account and whether you can choose or exclude specific sites.
- Confirm location-level SLAs, who is commercially accountable for a partner miss, and how inventory accuracy is audited across partners.
- Operating consistency across independent partners is the central diligence question for any network model.
Official source: everstox.com | Locations | Integrations | Multichannel
3. Paxon, including Active Ants: Best for Large-Scale Automated Fulfillment
What it is and why it made the list. Paxon is the unified 3PL brand, launched in 2026 by Belgium-based Bnode, that brings together Active Ants, Base Logistics, Radial, Staci, and their subsidiaries. Staci’s transition announcement, dated February 3, 2026, describes a gradual move to the single identity across Europe and North America through 2026, with double branding during the transition. Paxon says existing contracts, teams, and local contacts remain in place. Active Ants, well known to European ecommerce brands for robot-assisted fulfillment, is part of this group rather than a separate option.
Why it wins its category. Paxon combines ecommerce automation with deep local operations and B2B capability for enterprise-scale volumes and complexity. Active Ants says it uses AutoStore storage and robotics for picking. A June 2026 Bnode press release describes an automated ecommerce site near Lyon combining Active Ants technology with Staci infrastructure, including automated right-sized packaging. Staci contributes omnichannel and B2B depth, according to Bnode.
Physical footprint versus countries served. Active Ants lists fulfillment centers in the Netherlands, the UK, Belgium, Germany, and France, with further operations outside Europe. Staci and Radial add European sites. Paxon does not publish a consolidated site count, so request the specific facilities that would handle your account.
Operating model. Directly operated facilities within one corporate group, now aligning under one brand.
Capabilities and channels. B2C and B2B, omnichannel, returns, webshop integrations with major platforms, and automated ecommerce operations.
Best-fit customer. High-volume brands and omnichannel retailers that need automation, peak capacity, and scalable solutions across several European markets.
Considerations
- Scale and enterprise complexity may be more than a smaller brand needs, and it may not get the level of account manager attention expected from a large operation.
- During the 2026 brand transition, confirm which legal entity contracts with you and which operating team runs your sites.
- Capabilities differ across the legacy businesses; verify that the specific site proposed offers the automation described.
Official source: Paxon | Active Ants | Transition
4. Fulfillment-Box: Best for Amazon and Marketplace Sellers
What it is and why it made the list. Fulfillment-Box describes itself as part of a German holding with warehouses in multiple countries. It made the list because its public offer is built around Amazon and marketplace workflows, which many sellers entering Europe rely on first, and it is often used for international expansion into European marketplaces.
Why it wins its category. The company lists FBM, Seller Fulfilled Prime, and FBA prep center services, including storage, labeling, repackaging, forwarding to Amazon fulfillment centers, and returns handling. It says its Ysell.pro software connects to Amazon, eBay, Shopify, WooCommerce, Kaufland, and Otto, giving marketplace sellers one view of inventory and orders.
Physical footprint versus countries served. Fulfillment-Box’s Europe page describes eight warehouses in six European countries. Its fulfillment centers page includes location pages for Germany (Bremen and Kodersdorf are named on the Germany page), Poland, and the UK, plus operations in Turkey, Canada, the US, and China. The company says each European center provides reverse logistics.
Operating model. Public sources do not clearly state which sites are directly operated. Ask.
Capabilities and channels. Amazon FBA prep, FBM and SFP, eBay, Otto, Kaufland, Shopify, WooCommerce, kitting and sets, and returns.
Best-fit customer. Amazon-first and multi-marketplace sellers, including non-European brands, that need prep, storage, and merchant-fulfilled orders in Germany and neighboring markets, especially sellers expanding their customer base through Amazon-led entry into Europe.
Considerations
- Marketplace expertise and branded DTC experience are different capabilities; validate unboxing, tracking communication, and brand control if DTC matters.
- Public figures on location counts vary across pages; confirm current sites and market-level SLAs.
- Confirm how returns are graded and restocked in each country.
Official source: fulfillment-box.com | Europe | Centers
5. Bleckmann: Best for Fashion and Lifestyle
What it is and why it made the list. Bleckmann is a logistics specialist for fashion brands, lifestyle, and beauty. It made the list because fashion is one of the hardest ecommerce categories to run in Europe: high return rates, seasonal peaks, large SKU counts, and a mix of DTC, wholesale, and retail replenishment.
Why it wins its category. Bleckmann combines category focus with the full chain around it. The company lists warehousing and fulfillment, value-added services such as custom packaging and personalization, omnichannel distribution, reverse logistics, customs solutions, and freight forwarding. Its brand journey page describes support from early growth (including its Bscale offer) through multi-region scale, and circular services for unsold and returned inventory.
Physical footprint versus countries served. The company says it operates 40+ sites in the Netherlands, Belgium, Spain, the UK, and the US, with more than 1.3 million square meters of operational space. Delivery reach extends across Europe and beyond through its transport services, which is relevant for brands planning broader European operations.
Operating model. Directly operated specialist logistics group.
Capabilities and channels. D2C, B2B wholesale, retail replenishment, returns processing, value-added services, and customs. For beauty or other climate-sensitive SKUs, validate any temperature control requirements directly with the provider.
Best-fit customer. Fashion, footwear, lifestyle, and beauty brands with seasonal collections, meaningful return volumes, and a mix of wholesale and ecommerce.
Considerations
- Enterprise-grade depth may be more than a simple early-stage catalog needs; ask how the Bscale offer differs in service and pricing.
- The footprint is weighted toward the Benelux; model transit to Southern and Eastern Europe.
- Confirm minimum volumes and onboarding timelines.
Official source: bleckmann.com | Brand journey
Other European 3PLs worth considering
These five providers did not receive a category distinction, but each is a credible option for specific situations.
6. Huboo
Huboo is a technology-led fulfillment provider known for an accessible model aimed at small and growing ecommerce brands. Its “Hub” approach, as the company describes it, organizes work so pickers do not cross large warehouses, which it says reduces walking distance and cost. Huboo says it owns its warehouses and technology stack, and the company says it shipped over 32 million products last year.
Its locations page lists two fulfillment centers in Bristol (UK), one in Madrid (Spain), one in the Netherlands, and a US facility in the Fort Worth area. Delivery reach is wider through courier partners, and this setup can support growing European logistics needs for small and mid-size brands. The company reports 35+ integrations to marketplaces, channels, and systems.
Best fit: small and mid-size brands wanting a UK base plus an EU node, with transparent onboarding.
- Considerations: confirm which EU site would hold your stock and its capabilities; validate commercial terms and monthly minimums (the site lists a starting monthly figure); confirm returns and cross-border shipping scope in writing.
Official source: huboo.com | EU fulfilment | Locations | About
7. fulfilmentcrowd
fulfilmentcrowd is a recognizable ecommerce fulfillment network offering many location options through one provider and one platform, including strategically located warehouses that can support cross-border delivery planning. It says it supports 250+ brands and handles DTC and B2B.
Its warehouse locations page lists 17 sites: six in the UK, sites in France, Germany, the Netherlands, and Ireland, plus the US and Australia. Its business model page explains that it partners with regional logistics operators who run the physical sites on fulfilmentcrowd’s technology and standards. That makes it closer to everstox’s network model than to a directly operated 3PL, so the same accountability questions apply.
Best fit: brands that want UK, EU, and non-European coverage under one contract and one system, or prefer one central hub relationship across those markets.
- Considerations: ask which partner operates each node; confirm SLA consistency and how misses are remedied; check location-specific capabilities before placing stock.
Official source: fulfilmentcrowd.com | Locations | Europe
8. Salesupply
Salesupply combines fulfillment with cross-border ecommerce services that support broader supply chain needs around the warehouse: international returns, outsourced customer service, and localization of delivery options. The company says it serves 250+ online brands and retailers.
Its fulfillment centers page lists European sites across Western Europe in Belgium, France, Germany, Denmark, Spain, Poland, and the UK. Separately, the company says its returns solution offers local return addresses in more than 20 countries, which is a different footprint from where orders ship. For a brand testing a new market, a local return address can matter to shoppers as much as a local warehouse.
Best fit: brands entering several European markets that need local returns and native-language customer service alongside fulfillment, especially when trying to manage significant challenges across multiple country launches.
- Considerations: public pages do not state which sites are directly operated; validate which services and facilities apply in each target country.
Official source: salesupply.com | Fulfillment | Returns | Centers
9. FLEX. Fulfillment
FLEX. Fulfillment is a flexible European operator serving ecommerce and Amazon sellers, with specific guidance for UK, US, and non-EU sellers setting up EU operations from outside the region. It says it is an Amazon Service Provider Network partner for FBA prep.
The company lists six of its own warehouses: three in Germany (Magdeburg, Wilhelmshaven, Lotte), one in France, one in Poland, and one in the UK. Services include B2C and B2B fulfillment, FBA prep, FBM, returns, and kitting. Its integrations guide covers marketplaces such as Amazon, eBay, OTTO, Kaufland, Allegro, and Cdiscount, and webshops including Shopify and WooCommerce.
Best fit: Amazon-heavy and non-EU sellers wanting FBA prep and merchant-fulfilled orders in Germany, Poland, and France, with support for international expansion for UK, US, and non-EU sellers needing a straightforward EU setup.
- Considerations: verify the direct footprint and which services run at each site; confirm returns handling and volume economics at your order profile.
Official source: flexfulfillment.eu | FBA prep | Integrations
10. Bolian Logistics
Bolian Logistics is a Spain-based ecommerce fulfillment provider focused on Spain and Iberia, with cross-border delivery into the rest of Europe. Spain is a large ecommerce market in its own right, and local carrier relationships there can make a real difference in delivery reliability. It is best understood as a regional-fit option, not a pan-European node network, and can work well as a regional fulfillment partner for Iberia-focused brands.
The company describes its Spain fulfillment operation as Barcelona-based and ships to other European markets through carriers including GLS, Correos, SEUR, MRW, DHL, CTT Express, and DPD. It says it offers B2C and B2B fulfillment, returns handling, real-time inventory control, and integrations with Shopify, WooCommerce, PrestaShop, and Magento. That said, Spain-based fulfillment may not be ideal for all EU member states, since transit times typically rise as you move into Northern and Central Europe.
Best fit: brands whose European demand centers on Spain and Portugal, or that want a Southern Europe node alongside a primary warehouse elsewhere.
- Considerations: cross-border transit times from Spain to Northern and Central Europe; no UK node; confirm capacity for peak volume.
Official source: bolianlogistics.com | Spain | Europe
Which European 3PL fits your business?
Use your largest channel, your top markets, and your catalog to narrow the list for supply chain fit:
- DTC brand selling mainly into France, Spain, Italy, Germany, and the UK: start with Bigblue, which covers these markets from one provider.
- Brand wanting inventory in many countries through one relationship: compare everstox and fulfilmentcrowd for pan European fulfillment, and focus diligence on partner accountability.
- High-volume or omnichannel retailer: Paxon (Active Ants and Staci) for automation and B2B depth.
- Amazon-first or multi-marketplace seller: Fulfillment-Box and FLEX. Fulfillment for FBA prep and marketplace workflows.
- Fashion, footwear, lifestyle, or beauty: Bleckmann for category depth, returns, and value-added services.
- Cross-border brand needing returns and customer service in local languages: Salesupply.
- Spain and Portugal as the core market: Bolian Logistics, possibly alongside a Northern or Central Europe node.
If your answers point to two or three providers, request quotes built on your real order data: order lines per order, SKU count, units stored, destination mix, and return rate. Comparing total 3PL costs, including receiving, storage, pick and pack, packaging, shipping, returns processing, and account fees, shows differences a headline pick fee hides and clarifies the value of modern ecommerce order fulfillment services.
Questions to ask before signing with a European 3PL
Footprint and operating model
- Which specific facilities would hold my inventory, and in which countries?
- Is each facility operated by your staff or by a partner? If a partner, who is my contract with, and whose SLA applies?
- In the locations proposed for my account, are the warehouses directly operated or partner-run?
- Do you hold inventory in both the EU and the UK, and are both on the same systems?
Service levels and performance
- What are your contracted SLAs for receiving, same-day ship cutoff, order accuracy, and inventory accuracy, per site?
- What happens commercially when an SLA is missed?
- What is your peak season plan, and what capacity is reserved for my volume?
- What sustainability capabilities do you offer, and how do you measure them?
Channels and workflows
- Can you show live examples of my top two channels (for example, Shopify DTC and Amazon FBA prep or Wayfair order fulfillment workflows) running at similar volume?
- How do you handle B2B orders, retailer compliance, and pallet shipments?
- How are returns received, graded, restocked, and reported, and how quickly do customer refunds trigger?
Technology
- Which integrations are native, and which require middleware or custom api integrations to fit existing supply chain operations?
- What real time tracking and inventory data can my team see, and at what frequency, especially if we connect to a regional node such as a New York order fulfillment service?”
Commercial terms
- What are the minimums, onboarding fees, and notice periods?
- How are storage, packaging, and carrier surcharges billed, and how does this compare to best practices for warehousing services?”
- What are the exit terms and data export rights if we leave?
Our 3PL contract guide covers the clauses that most often cause disputes. If you are replacing a provider, plan the cutover carefully; the guide to migrating to a new 3PL outlines inventory transfer, systems testing, and running parallel operations, and customer reviews of order fulfillment services can highlight real-world transition risks.
Final recommendation
Bigblue is the strongest starting point for a DTC ecommerce brand selling into France, Spain, Italy, Germany, and the UK. everstox, Paxon, Fulfillment-Box, and Bleckmann are also worth comparing when your needs are dominated by distributed placement, scale and automation, marketplaces, or fashion. The five other providers are credible for specific regional or workflow needs.
Whichever you shortlist, make the decision on where inventory physically sits, who runs each site, which channels are proven there, and what the full cost looks like after safety stock, transfers, and returns. A shorter list of well-placed nodes run by an accountable operator will often beat a longer list of locations you cannot manage. Very large players like Rhenus, with 1,330 locations and 41,000 employees in Europe, and ceva logistics, which employs 110,000 people globally and specializes in food logistics, were not ranked here because this list prioritizes ecommerce fit over sheer scale, even when hub choice points toward major gateways such as Rotterdam, one of the top ports in Europe and near Europe’s largest port; industry developments like Cahoot in the news illustrate how innovation, not just footprint, increasingly shapes fulfillment choices.
For US operations and connected channel management, Cahoot is an end-to-end ecommerce fulfillment operations suite with a distributed US fulfillment center network built to help brands save every penny, scale operations without adding complexity, and outperform on every sales channel. It does not operate European warehouses; the providers above are where to look for European inventory.
Frequently asked questions
What is the best European 3PL for ecommerce sellers in 2026?
In this comparison, Bigblue is the best overall European 3PL for DTC brands selling into France, Spain, Italy, Germany, and the UK, based on its balance of warehouse coverage, one-platform operating model, and customer-experience features. everstox, Paxon (including Active Ants), Fulfillment-Box, and Bleckmann are also worth comparing when distributed placement, scale and automation, marketplace workflows, or fashion specialization drives the decision.
Do I need separate warehouses for the EU and the UK?
Most brands with meaningful demand in both markets use inventory on each side. Since Brexit, parcels moving between the UK and the EU cross a customs border, which adds declarations, possible duties, and delays to every order. Confirm your specific VAT and customs obligations, customs brokerage, and filing needs with a qualified advisor.
What is the difference between a 3PL that ships to a country and one with a warehouse there?
Shipping coverage means the provider can deliver orders to that country, usually from a warehouse elsewhere. Warehouse coverage means your inventory can be stored in that country, which typically shortens transit times and lowers last mile costs; it also affects where storing inventory can trigger local VAT and compliance considerations. Many providers deliver to far more countries than they hold stock in.
Is a partner-network 3PL riskier than one that runs its own warehouses?
Not necessarily, but it requires different diligence. Partner networks offer more locations and flexibility; directly operated networks offer tighter control and a single accountable party. With a network model, confirm who runs each site, whose SLA applies, and who is commercially responsible for a miss.
How many fulfillment centers should I use in Europe?
There is no fixed number. More nodes can reduce delivery times but split inventory, raise safety stock, and add transfer and management costs. Many brands start with one EU node near their largest market and one UK node, then add locations when order data shows a clear speed or cost benefit. Many also start with a central European node because it can reach major EU member states quickly.
Which European 3PLs are best for Amazon FBA prep and reverse logistics?
In this list, Fulfillment-Box and FLEX. Fulfillment put Amazon workflows at the center of their public offers, including FBA prep, merchant-fulfilled orders, and marketplace integrations. FLEX. Fulfillment says it is an Amazon Service Provider Network partner. Confirm prep capabilities at the specific site you would use.
What happened to Active Ants?
Active Ants is part of Paxon, the unified 3PL brand Bnode introduced in 2026 to bring together Active Ants, Base Logistics, Radial, Staci, and their subsidiaries. The companies are transitioning to the Paxon name through 2026, and Paxon says existing contracts and contacts remain in place.
Written By:
Rinaldi Juwono
Rinaldi Juwono leads content and SEO strategy at Cahoot, crafting data-driven insights that help ecommerce brands navigate logistics challenges. He works closely with the product, sales, and operations teams to translate Cahoot’s innovations into actionable strategies merchants can use to grow smarter and leaner.
Turn Returns Into New Revenue
Related Articles
Walmart Officially Allows Amazon Multi-Channel Fulfillment (MCF)
Big news for multichannel sellers: Walmart now officially allows Amazon Multi-Channel Fulfillment (MCF), Amazon’s service for using its fulfillment network to ship orders from mult...
Why More Automation Didn’t Lower Return Costs
Returns automation does improve returns operations: it cuts manual touches, smooths intake, speeds sorting, and makes workflow execution more consistent.
Shopify Subscription Payment Change: Why It Could Hurt Reactivation
Shopify changed how subscription payment information is handled at cancellation.
How Much Does Seller Fulfilled Prime Cost? Calculate It for Your SKU

In this article
17 minutes
- Start With One SKU: An 8.4-Pound Case of Adult Diapers
- Start Seller Fulfilled Prime With the Costs You Already Know
- The $9.36 Parcel Rate Only Works if Inventory Is Close to the Customer
- Once Inventory Is Distributed, You Have to Pay to Store the Buffer
- The Adult Diaper Comes Out Cheaper on SFP
- A Foldable Cart Shows When the Shortcut Tells You Almost Everything
- Slow Sales Can Make Distributed SFP Inventory Expensive
- “Is SFP Cheaper?” and “Is SFP Worth It?” Are Different Questions
- The Fulfillment Network You Build for SFP Can Serve More Than Amazon
- Calculate the Cost First. Then Decide Whether the Benefits Are Worth It.
- Frequently Asked Questions
Seller Fulfilled Prime sounds attractive until you start thinking about the bill. You have to ship Prime orders yourself, may need inventory in several fulfillment locations, and those warehouses charge for storage and handling. If you cannot reach customers inexpensively by Ground, parcel costs can eat into the margin quickly. So how much does SFP actually cost for your product?
There is no useful universal answer. The right question is what SFP will cost for this specific SKU compared with FBA, and that is something you can estimate. At a high level:
SFP cost per order = parcel shipping + pick and pack + packaging + inventory distribution + storage.
If you’re still getting oriented to the program itself, our Seller Fulfilled Prime guide explains the current eligibility, performance, size-tier, and trial requirements. Here, rather than explain every cost in the abstract, we’ll run one real product through the calculation from beginning to end.
Watch: Three SKU-Level SFP vs FBA Cost Examples
Is Seller Fulfilled Prime cheaper than FBA? There is no catalog-wide answer. Manish works through three different products to show how FBA size tier, storage, inbound inventory costs, fulfillment, parcel shipping, and delivery requirements change the result from one SKU to another.
The takeaway: Compare each SKU against the full FBA and SFP cost stacks using the assumptions shown below. Keep an unverified FBA destination or inbound charge out of a definitive savings claim, and test whether the SFP shipping plan can also sustain the required Prime delivery promises.
Want to Compare Your Own SKU?
Use our free Seller Fulfilled Prime vs. FBA Cost Calculator to run a quick one-unit comparison using your packaged dimensions, FBA fulfillment fee, Zone 3 UPS/FedEx rate, pick and pack, packaging, and storage.
Calculate Your SFP vs. FBA Cost →
This is a quick core-cost comparison. The full analysis below covers additional costs such as inventory distribution, inbound placement, buffer inventory, and multi-node fulfillment.
Start With One SKU: An 8.4-Pound Case of Adult Diapers
Our first example is a case of adult diapers with these characteristics:
| Input | Value |
|---|---|
| Selling price | $42.50 |
| Dimensions | 16 × 11.9 × 11.1 in. |
| Weight | 8.4 lb |
| Monthly sales | 1,000 units |
This is a useful SFP candidate to investigate because it is large enough that Amazon’s FBA fulfillment fee is meaningful but still ships as an ordinary parcel. Before calculating SFP, we need a fair FBA baseline.
FBA Costs About $20.45 Per Order Before Inbound Transportation
For this SKU, the FBA fulfillment fee is $16.31 per order. Amazon describes that fee as covering the work involved in picking, packing, and shipping an order, while storage and other applicable FBA costs are charged separately. (Sell on Amazon)
We’re also assuming the merchant chooses Amazon’s minimal shipment splits option, which produces an inbound placement fee of $3.12 per unit for this example. With minimal shipment splits, the seller generally ships to fewer Amazon receiving locations and Amazon distributes the inventory farther through its network for a fee. (Amazon Seller Central)
Then there is storage. One common mistake in FBA-versus-SFP comparisons is charging SFP for all the unsold inventory sitting in warehouses while treating FBA as though only the unit that sold incurs storage; FBA needs buffer inventory too. For this example, we assume average FBA inventory on hand equals 1.5 months of sales—one month of safety stock plus approximately half of a one-month replenishment cycle. At $0.68 per unit per month, that becomes $0.68 × 1.5 = $1.02 of FBA storage per unit sold. That gives us:
| FBA Cost | Per Order |
|---|---|
| FBA fulfillment | $16.31 |
| Inbound placement | $3.12 |
| Storage | $1.02 |
| Total | $20.45 |
There is one deliberate omission: the $20.45 does not include transportation from the merchant’s origin warehouse to Amazon. We do not know which receiving location Amazon would assign for this hypothetical shipment, so guessing a destination would create false precision. Amazon’s placement fee and the cost of sending inventory into Amazon’s network are separate considerations. (Amazon Seller Central)
That omission makes the comparison conservative in FBA’s favor, because the actual FBA cost will include some cost to move inventory into Amazon’s network. We’ll keep that limitation visible and now build the SFP number from the same SKU.
Start Seller Fulfilled Prime With the Costs You Already Know
Assume the warehouse charges $3.99 to pick and pack one order, and the product needs an external shipping box that adds $0.50 in packaging. Then check your actual negotiated parcel rate. With inventory positioned close enough to customers, our modeled UPS/FedEx Ground cost is $9.36 per order. Before doing anything else, stop here.
Compare Parcel Shipping Against the Entire FBA Fulfillment Fee
This is the fastest screening test in the entire calculation. Our FBA fulfillment fee is $16.31 and our Ground parcel shipment is $9.36, leaving almost $7 of headroom. That does not mean SFP will save $7—we still have to pay for pick and pack, packaging, inventory distribution, and storage—but it tells us this SKU deserves the full calculation.
Want to run this first-pass comparison on your own SKU? Our Seller Fulfilled Prime vs. FBA Cost Calculator compares your FBA fulfillment and base storage costs against SFP pick and pack, packaging, Zone 3 Ground shipping, and storage.
Now imagine the numbers went the other way. If Amazon’s FBA fulfillment fee were $16 but your Ground parcel shipment cost $24, you would already be $8 behind FBA before anyone picked the order, before you bought packaging, before you distributed inventory, and before you paid storage. If saving money is your only reason for considering SFP, you may be able to stop the analysis right there.
This is why many inexpensive Small Standard products are difficult to justify on SFP purely on cost: Amazon’s fulfillment economics can be extremely difficult to beat with a standalone residential parcel shipment. For our diaper SKU, however, the parcel economics look promising, so now we need to calculate the network costs that make that $9.36 Ground rate possible.
The $9.36 Parcel Rate Only Works if Inventory Is Close to the Customer
You cannot simply put all 1,000 units in one warehouse and assume every customer will be inexpensive to reach if you want to deliver Prime orders through Seller Fulfilled Prime from your own warehouse. To make our Ground assumption practical, let’s model inventory across five locations: Utah, Dallas, Indiana, California, and New Jersey. The exact network needed varies by SKU and demand pattern. Geography matters because Amazon measures the delivery promise shown to Prime shoppers; our SFP cutoff-time analysis explains why even a late cutoff cannot make a distant warehouse behave like a local one.
This setup lets sellers retain control over inventory and fulfillment instead of routing stock through Amazon, which is one of the core reasons many brands explore third-party logistics (3PL) ecommerce fulfillment alternatives.
First we need to know how many units fit on a pallet. The product measures approximately 16 × 11.9 × 11.1 inches, and for this SKU we’ll use a representative 40 × 48 × 72-inch loaded pallet with roughly 95% usable volume after allowing for unavoidable gaps. That gives us approximately 62 units per pallet. If you have real historical palletization data, use it—a simple cubic calculation is only an estimate, and carton orientation, stackability, weight, and actual warehouse practices can change the answer. Now get freight quotes from your origin warehouse to the nodes:
| Destination | Freight Per Pallet |
|---|---|
| Utah | ~$121 |
| Dallas | ~$166 |
| Indiana | ~$108 |
| California | ~$113 |
| New Jersey | ~$343 |
Sending one pallet to each location costs about $852. Five pallets × 62 units gives us 310 units positioned, so $852 ÷ 310 units works out to approximately $2.75 of inventory-distribution cost per unit. This is the cost people often fear when they hear “distributed inventory,” but $2.75 is not automatically fatal; we still have to compare it with the parcel savings the network creates.
Once Inventory Is Distributed, You Have to Pay to Store the Buffer
Our SKU sells 1,000 units per month. For simplicity, assume demand is evenly divided among the five nodes, or about 200 orders per warehouse per month. We want roughly one month of safety stock, so each location needs about 200 units. Replenishment also happens in whole-pallet quantities, and at 62 units per pallet a roughly one-month replenishment batch rounds to four pallets, or 248 units.
Average stored inventory is not safety stock plus the entire replenishment shipment because that batch gets consumed over the replenishment cycle. A useful approximation is safety stock plus half the replenishment batch: 200 + (248 ÷ 2) = 324 average units per warehouse, or 1,620 units stored on average across five locations.
This product occupies approximately 1.223 cubic feet. Using an example SFP storage rate of $0.84 per cubic foot per month, that works out to about $1.03 per unit-month. At 1,620 average units, storage is roughly $1,664 per month, or about $1.66 per order at 1,000 monthly orders. That storage tradeoff also comes with more control over inventory than FBA. With that, we have every major SFP cost.
The Adult Diaper Comes Out Cheaper on SFP
Put the pieces together:
| SFP Cost | Per Order |
|---|---|
| Inventory distribution | $2.75 |
| Pick and pack | $3.99 |
| Packaging | $0.50 |
| Parcel shipping | $9.36 |
| Storage | $1.66 |
| Total SFP cost | $18.26 |
Our FBA baseline was $20.45 per order before transportation into Amazon, while SFP comes to $18.26. Under these assumptions, SFP is therefore about $2.19 cheaper per order, or roughly $2,190 per month at 1,000 orders. For this SKU, SFP can be a more cost-effective option than FBA when fulfillment operations are efficient and lower fees create enough room to offset the added network costs. The important lesson is not that adult diapers are automatically better on SFP; it is what happened inside the calculation.
Distributed fulfillment added freight and increased the amount of inventory sitting around the country, but the gap between $16.31 of FBA fulfillment and $9.36 of parcel shipping created enough room to absorb those extra network costs. That is why SFP economics need to be calculated at the SKU level. Before you enter the trial, our SFP Trial Checklist uses the same SKU-first logic to pressure-test margin resilience, warehouse footprint, inventory readiness, and carrier setup.
A Foldable Cart Shows When the Shortcut Tells You Almost Everything
Now let’s apply the same method to a different SKU without repeating every calculation. The second product is a foldable cart selling for $84.95, with approximately 1,000 sales per month. Its FBA economics look like this:
| FBA Cost | Per Order |
|---|---|
| Fulfillment | $15.58 |
| Inbound | $3.50 |
| Storage | $1.07 |
| Total | $20.15 |
Now do the quick check. The lowest modeled Ground parcel cost is $17.66, which is already $2.08 more than Amazon’s entire $15.58 fulfillment fee before we have paid anyone to pick the order, distribute inventory, or store it. The warning light is flashing early, and the full SFP calculation confirms it:
| SFP Cost | Per Order |
|---|---|
| Inventory distribution | $4.01 |
| Pick and pack | $3.99 |
| Parcel shipping | $18.09 |
| Storage | $1.86 |
| Total | $27.95 |
In practice, shipping costs for SFP can run higher than expected once order volume, packaging sizes, and delivery-network requirements are factored in.
SFP costs about $7.81 more per order than FBA. If your only objective is to reduce fulfillment expense, this SKU is a poor SFP candidate under these assumptions, but that is not necessarily the end of the decision. You now know the price of choosing SFP: roughly $7.81 per order.
The next question is whether that premium buys something the business genuinely values. Is greater inventory control important? Are FBA receiving or inventory-management constraints materially hurting the operation? Does keeping the same inventory available to non-Amazon channels matter enough to justify the premium? Amazon itself notes that FBA can include storage, aged-inventory, returns-processing, removal, disposal, and inbound-placement costs depending on the seller’s situation. (Sell on Amazon) Those benefits or problems have to be worth more than the premium; if they are not, leave the SKU on FBA. For larger items, shipping fees and referral fees tied to the product’s selling price can further compress margin, though oversized or slow-moving products may still be worth reviewing for SFP when FBA inventory fees are less favorable—and the broader FBA vs. FBM fulfillment tradeoffs are worth understanding before you commit.
Slow Sales Can Make Distributed SFP Inventory Expensive
Our third example shows another failure mode: a $1,265 motorbike light kit measuring 15 × 14 × 7 inches, weighing 8.95 pounds, and selling only about 100 units per month. FBA costs about $11.11 per order, while the SFP Ground parcel cost alone is $14.68—already $5.38 above the $9.30 FBA fulfillment fee. The quick screen is warning us before we even finish the model, just as tools like Amazon AWD bulk storage can change—but not eliminate—the storage and distribution math for slow-moving SKUs.
The full SFP calculation comes out to:
| SFP Cost | Per Order |
|---|---|
| Inventory distribution | $5.45 |
| Pick and pack | $3.99 |
| Parcel shipping | $14.68 |
| Storage | $1.56 |
| Total | $25.67 |
That’s about $14.57 more per order than FBA and more than double the FBA logistics cost. Two things are hurting this SKU: parcel shipping is already structurally more expensive than FBA fulfillment, and the product only sells about 100 units per month. Once those sales are divided across four warehouses, pallet-sized replenishment and buffer inventory become expensive on a per-order basis, which is exactly why sales velocity belongs in the SFP calculation.
The SKU does sell for $1,265, so the $14.57 premium is only about 1.15% of the selling price. That does not prove SFP is affordable—we do not know the product’s cost of goods or true margin. The merchant still has to decide whether the actual margin can absorb the extra $14.57 and whether there is a sufficiently valuable reason to stop using FBA.
“Is SFP Cheaper?” and “Is SFP Worth It?” Are Different Questions
Our three examples produced three very different answers:
| SKU | FBA | SFP | SFP Difference |
|---|---|---|---|
| Adult Diapers | $20.45 | $18.26 | SFP saves $2.19 |
| Foldable Cart | $20.15 | $27.95 | SFP costs $7.81 more |
| Motorbike Light Kit | $11.11 | $25.67 | SFP costs $14.57 more |
That is exactly what should happen: SFP is not supposed to win every spreadsheet. The calculation answers the first question—how much more or less will SFP cost for this SKU?—and then the business has to answer the second: what am I getting for that difference? Prime eligibility can improve sales visibility and conversion rates. Some sellers find Seller Fulfilled Prime worth the added complexity because it can lift sales by over 50%, though that is not guaranteed.
For some SKUs, the economics simply say FBA. For others, SFP may be slightly cheaper, and in still other cases a merchant may intentionally accept an SFP premium because the operational benefits are valuable enough. The point of the model is not to manufacture an SFP win; it is to put a real price on the choice.
The Fulfillment Network You Build for SFP Can Serve More Than Amazon
There is one final factor the spreadsheet does not fully capture: if you distribute inventory to support one- and two-day delivery for Seller Fulfilled Prime, you have not necessarily built an Amazon-only network. Those same fulfillment locations can potentially ship orders from your own ecommerce site and other marketplaces, which can change how you value the investment, especially if you leverage Amazon SFP-focused 3PL fulfillment services that are designed for multichannel use.
Amazon says merchants using its Multi-Location Inventory together with Shipping Settings Automation saw more than 20% higher sales conversion on average, which it attributes to faster and more accurate delivery promises. Walmart similarly reports that its seller-fulfilled shipping solutions can improve conversion by 20% on average while enabling sellers to offer OneDay, TwoDay, and ThreeDay delivery programs. Those are Amazon- and Walmart-reported program outcomes, not guarantees for any individual merchant. (Sell on Amazon; Walmart Marketplace)
The principle is straightforward: an inventory position that helps you offer Prime delivery on Amazon can potentially help you offer faster delivery on your DTC site, Walmart, Target, Etsy, or other channels as well. That means the $7.81 premium in our cart example isn’t necessarily buying only an Amazon Prime badge; it may also help fund fulfillment infrastructure for the broader business. You still shouldn’t use that argument to justify terrible unit economics, but it belongs in the decision.
Calculate the Cost First. Then Decide Whether the Benefits Are Worth It.
If you’re evaluating Seller Fulfilled Prime, don’t begin by asking a 3PL for an average SFP price. You also need a professional selling account and a qualifying Prime trial period before full enrollment. Sellers must complete a trial period of at least 30 days and ship at least 100 Prime trial packages while meeting Prime requirements under Amazon’s updated SFP program requirements and current SFP performance guidelines.
Start with the quick comparison: Enter your packaged dimensions, FBA fulfillment fee, and Zone 3 Ground rate into our SFP vs. FBA Cost Calculator. If the numbers are close enough to investigate, then move on to the full inventory, distribution, and network analysis described above.
Then compare that SFP total against FBA, making sure both sides include realistic buffer inventory. If SFP is cheaper, you have an easy economic argument. If it’s more expensive, you now know exactly what the SFP premium is and can decide whether greater inventory control, reduced dependence on FBA, or a faster multichannel fulfillment network is worth paying for, provided you can consistently meet strict performance metrics to maintain eligibility. Amazon itself encourages sellers to compare FBA with self-fulfillment using its Revenue Calculator, and the more accurate your actual shipping, inventory, and warehouse inputs are, the more useful that decision becomes—especially once you account for hidden FBA fees that the calculator can surface. (Sell on Amazon)
If the economics work but you need an outside network to execute them, our Seller Fulfilled Prime 3PL guide explains the capabilities an SFP provider needs beyond generic two-day fulfillment. If you also need strategic context on how SFP can offset rising Amazon fees, the Use Amazon SFP to fight increasing FBA fees in 2024 webinar walks through common scenarios. Want to run the same calculation on your own SKU? Download the SFP vs. FBA Cost Calculator used for these examples and replace our assumptions with your actual rates.
Frequently Asked Questions
How do you calculate Seller Fulfilled Prime cost per order?
Add your average parcel shipping cost, warehouse pick-and-pack fee, packaging cost, inventory-distribution cost per unit, and storage cost per order. For a useful estimate, storage should account for the buffer and replenishment inventory actually sitting across your fulfillment network.
Is Seller Fulfilled Prime usually cheaper than FBA?
Not necessarily. SFP also requires offering free standard shipping on Prime orders, which affects whether it ends up cheaper than FBA. FBA can be especially difficult to beat for products where Amazon’s total fulfillment fee is lower than the seller’s parcel postage alone, even when offering free shipping. SFP economics vary significantly by SKU dimensions, weight, carrier rates, sales velocity, inventory placement, and warehouse costs.
What is the fastest way to tell whether a SKU deserves a full SFP cost analysis?
Compare the SKU’s FBA fulfillment fee against your realistic Ground residential parcel cost. If parcel postage alone is already substantially higher than the FBA fulfillment fee, SFP is unlikely to win purely on fulfillment cost. You may still continue the analysis if you are considering SFP for strategic reasons. As a quick screen, confirm you can buy shipping through Amazon Buy Shipping Services and hit the core thresholds: ship over 99% of orders on time, maintain at least a 93.5% on-time delivery rate, use Buy Shipping Services for at least 98.5% of orders, and ship Prime orders on weekends—bearing in mind that SFP and Premium Shipping performance requirements are tightening again in June 2025.
Should storage cost include buffer stock for both FBA and SFP?
Yes. A fair comparison should account for unsold inventory under both models. FBA inventory also sits in storage before it sells. SFP may require additional inventory because safety stock and replenishment batches are spread across several fulfillment locations.
What if I don’t know my FBA inbound transportation cost?
Leave it out rather than inventing an Amazon destination. Make the omission explicit and label your FBA result as being before inbound transportation to Amazon. That makes the comparison conservative in FBA’s favor, because the actual FBA cost will include some cost to move inventory into Amazon’s network. Beyond inbound transportation, sellers evaluating Prime readiness also need a cancellation rate of less than 0.5%, and those using FBA should ensure their products meet all Amazon FBA prep and inspection requirements before they ever ship to a fulfillment center.
Rate note: These worked examples use the rates and assumptions available for this analysis as of September 14, 2026. Amazon fees, carrier rates, warehouse prices, product dimensions, demand patterns, and inventory requirements change. Substitute your own current numbers before making a fulfillment decision.
Written By:
Manish Chowdhary
Manish Chowdhary is the founder and CEO of Cahoot, the most comprehensive post-purchase suite for ecommerce brands. A serial entrepreneur and industry thought leader, Manish has decades of experience building technologies that simplify ecommerce logistics—from order fulfillment to returns. His insights help brands stay ahead of market shifts and operational challenges.
Turn Returns Into New Revenue
Related Articles
Walmart Officially Allows Amazon Multi-Channel Fulfillment (MCF)
Big news for multichannel sellers: Walmart now officially allows Amazon Multi-Channel Fulfillment (MCF), Amazon’s service for using its fulfillment network to ship orders from mult...
Why More Automation Didn’t Lower Return Costs
Returns automation does improve returns operations: it cuts manual touches, smooths intake, speeds sorting, and makes workflow execution more consistent.
Shopify Subscription Payment Change: Why It Could Hurt Reactivation
Shopify changed how subscription payment information is handled at cancellation.
Ecommerce Returns Analytics: Why Your Return Rate Hides the Real Problem

In this article
17 minutes
- Key takeaways
- A blended return rate tells you scale, not cause
- Carve Designs shows why customer cohorts must be separated
- The SKU leaderboard tells you what the company average cannot
- Return reason codes are clues, not verdicts
- Kulfi shows how returns data can expose a product defect
- Seasonality can make the same headline rate mean something different
- Recovery value changes while the returned item is in motion
- Use five return analytics diagnostic numbers before changing policy or product
- After diagnosis, manage the outcome KPIs separately
- Frequently Asked Questions
Your ecommerce return rate tells you that returns happened. It does not tell you what to fix. Ecommerce returns analytics is the work of breaking that blended return rate into diagnostic cuts, so an operator can see whether the problem sits with a customer cohort, a specific SKU, a likely cause, a seasonal swing, or the recovery value lost after an item comes back. A blended figure like a 22% return rate is a warning light, not a diagnosis: it cannot say whether the shift came from new customers who don’t yet trust your sizing, from a handful of SKUs a merchandising team should have pulled months ago, from a fulfillment mistake, from a seasonal swing that one month exaggerates, or from returned inventory sitting too long before it recovers value. Skip that split, and a fix aimed at the average risks solving a problem that was never actually there.
For ecommerce operators, retail brand managers, merchandising teams, fulfillment and reverse logistics personnel, and product quality teams, that distinction changes real decisions about assortment, fit content, warehouse process, and resale recovery. Komar’s event data from Cahoot’s August 2026 Ugly Talk series shows what this looks like in practice. Before Carve Designs did combined fit and purchase-path work, its new-customer return rate ran around 35% and its repeat-customer rate around 25%, a wide gap sitting quietly inside whatever single return-rate number appeared on Carve’s dashboard. After that work, new-customer returns fell to roughly 20% and repeat-customer returns to about 12%. A brand watching only the blended average would have seen one figure move and had no way to know which customers, or which fix, actually mattered.
The rest of this guide walks through those five cuts—customer cohort, SKU, return reasons, seasonality, and recovery value—and then separates diagnosis from the outcome KPIs a team tracks once it knows what it is fixing.
Key takeaways
- A blended return rate is a warning light, not a diagnosis. It shows scale, not cause.
- Splitting return rate by new versus repeat cohort often reveals two different businesses in one number, as Carve Designs’ shift from 35%/25% to 20%/12% shows.
- Ranking return rate by SKU usually finds a small number of products, not a random cross-section of shoppers, driving most of the volume.
- Reason codes are a starting clue, not a verdict. Customers often mislabel why they’re actually returning an item.
- Seasonality and recovery value, what a returned unit is worth once sellable again, both change what the same headline rate means.
- Diagnosis identifies the problem. Outcome KPIs measure whether the fix works, and the two belong in separate conversations.
| Headline view | Diagnostic cut | What decision it changes |
|---|---|---|
| Company-wide return rate | New vs. repeat customer cohort | Acquisition, onboarding, and fit-confidence investment |
| Overall return volume | Return rate by SKU / variant | Product, sizing, grading, and assortment decisions |
| Top return reason | Customer reason plus inspection evidence | Product quality, content, fulfillment, returns fraud and refund fraud prevention controls |
| Monthly average | Comparable periods / seasonality | Inventory, staffing, and campaign planning | | Resale / restock rate | Recovery per unit net of cycle time | Routing, processing speed, markdown exposure |
A blended return rate tells you scale, not cause
U.S. retailers were on pace to process $849.9 billion in returned merchandise in 2025, with an estimated 19.3% of online purchases sent back, according to NRF and Happy Returns research. Another benchmark shows 92% of global shoppers return up to 30% of online purchases, which underscores how routine returns are in e-commerce. That figure confirms returns are a permanent, material line item in ecommerce. It says nothing about any single brand’s problem, because a market-wide aggregate blends every category, business model, and customer base into one number. For most retailers, headline return rates still miss context such as why customers bought in the first place, and 88% of customers check return policies before purchasing.
Apparel makes the point clearly. Fit can’t be verified until a product is on a body, so apparel and footwear carry some of the highest return rates in ecommerce. Coresight Research, sponsored by sizing-technology vendor 3DLOOK, put the U.S. online apparel return rate at 24.4%, with size and fit cited by 53% of surveyed brands and retailers among top return reasons, and estimated 2023 online apparel returns at roughly $38 billion, with about $25.1 billion in processing costs attached. A beauty or home-goods brand won’t see anything close to that rate, and comparing rates across categories without adjusting for that is a common reporting mistake; understanding why ecommerce return rates are rising helps teams avoid drawing the wrong conclusions from a single benchmark.
Cahoot’s breakdown of the average ecommerce return rate by category is a useful ceiling check for whether an ecommerce business sits inside a normal range. Its companion piece on how return rate affects profit margins explains why that blended number is dangerous to plug directly into a margin model. Resources on crafting the perfect ecommerce returns program pick up from there, but neither answers the operator’s real question: what inside that number needs to change.
Carve Designs shows why customer cohorts must be separated
New and repeat customers are not the same population wearing the same size. A new customer is guessing at fit for the first time and may be buying on impulse or as a gift. A repeat customer already knows how a brand’s sizing runs and buys with more confidence, and that matters because return behavior can shape customer lifetime value, not just the immediate return rate. Blending their return rates into one company-wide figure erases that difference, along with the clearest signal in the data.
Carve Designs’ cohort numbers show the gap in practice. Per the Komar event deck presented by Jay Harris at Ugly Talk NYC, new-customer returns ran around 35% and repeat-customer returns around 25% before Carve’s combined fit and purchase-path work; afterward, the same cohorts fell to roughly 20% and 12%. About one in five Carve shoppers now completes the brand’s proprietary swim-fit quiz before buying, and the event deck reports higher average order value and lower returns among that group, without isolating an exact reduction attributable to the quiz alone. More personalized post-purchase and return experiences based on customer differences can strengthen customer loyalty, and an exceptional returns program turns those operational choices into a retention asset. The larger cohort-level gain came from pairing that guidance with changes across the purchase path, not one feature working in isolation, and a smooth return experience can increase customer lifetime value.
It’s worth being direct about what 35% means here. As Jay Harris put it, a 2% return rate and a 35% return rate can represent completely different business models. Bad SKUs, poor sizing charts, weak construction, and design choices that don’t match how customers use a product can all push a headline number up. Treating 35% as simply too high, without asking why, misses the point as much as treating it as acceptable would. The cohort split turns that number into a question worth answering, especially when longer windows can improve customer confidence and when policy choices need to match customer expectations if you want retention, not just a lower rate.
The SKU leaderboard tells you what the company average cannot
A company-wide return rate can sit at a stable, unremarkable number while a small set of products quietly drives most of the volume behind it. The Komar deck put this bluntly: “Repeat offenders are SKUs, not shoppers.” The recommendation is straightforward: rank return rate by SKU, not just by category or channel, and use return analytics to track product, variant, order, customer, and reason level data so you can investigate the styles that keep coming back rather than assuming the problem is spread evenly across the catalog.
This doesn’t mean every brand has the same concentration pattern; there’s no fixed share of returns that always sits in the worst-performing SKUs. What’s consistent is the habit: a SKU-level leaderboard turns a vague “returns are up” conversation into a specific one about a style, size grade, fabric, or listing, with the key metrics needed to understand product performance. Cahoot’s guide to why ecommerce returns run high covers the product, content, and fulfillment drivers that tend to concentrate in a handful of SKUs, pointing merchandising toward a sizing correction, a copy update, or pulling the SKU from the assortment.
Return reason codes are clues, not verdicts
Most returns platforms ask a customer to select a reason or submit a return request: wrong size, changed mind, item not as described, defective. Those codes are useful as a starting point and unreliable as a final answer. Jay Harris described selected reason codes as frequently wrong in his own operating experience, summarized on the Komar deck in one line: “Reason codes lie. Garments don’t.” A customer who feels awkward admitting a product wasn’t as flattering as expected may select “changed my mind” instead, and one returning a defective item may just pick whichever option sits first in the list. That’s an attributed operating observation, not a published industry statistic, but it argues for treating a reason code as a clue, not a number to report at face value.
The correction is inspection. When merchandise physically comes back, someone can look at the item itself: is it worn, damaged, mismatched to the order, or genuinely defective? Carrier tracking and return processing time help validate what happened across the entire process, from initiation to completion. Pairing the stated reason with what the item shows closes the gap between what a shopper says and what happened. Cahoot’s guide to reducing returns using customer feedback goes deeper on turning that combined data into prevention work, and platforms like Return Prime’s Shopify-focused returns solution can operationalize those insights for smaller brands without in-house reverse logistics.
Kulfi shows how returns data can expose a product defect
Return data isn’t only an operations signal; it’s a product-development signal, and Kulfi Beauty’s experience shows why. Speaking on Ugly Talk, Kulfi’s Gabrielle Kerins described a lip product whose packaging had passed quality control before launch. Consistent return feedback on that one product eventually revealed the real problem: the packaging was temperature-sensitive and leaked under certain conditions, something a standard QA pass hadn’t caught. Kulfi used that pattern to redesign the packaging rather than treating the returns as ordinary buyer’s remorse, illustrating how convenient drop-off networks like Happy Returns’ reverse logistics solution can surface recurring issues quickly when feedback and inspection data flow back to product.
That sequence only works if return data reaches product and quality teams, not just the returns desk. A defect showing up as a handful of “damaged” or “wrong item” codes each week can look like noise in a dashboard and a clear pattern once someone maps it back to a single SKU and root cause, using real-time visibility to spot return trends and customer behavior patterns faster. Treating returns data as an input to product development, not just a cost center, is what turned Kulfi’s leaky packaging into a fixed product in a data-driven way that supports smarter decisions.
Seasonality can make the same headline rate mean something different
A return rate is not a fixed characteristic of a brand. It moves with the calendar, and a trailing average can smooth away the exact months where the economics spike. Gabrielle Kerins made this point directly on Ugly Talk: return rate is not static. Manish Chowdhary added the operator framing on the same panel: an annual average can hide the specific months where returns jump, whether from a holiday gifting surge, a size-run change between seasonal collections, or a spike in first-time buyers from a new marketing channel.
The fix isn’t to distrust monthly reporting; it’s to compare like periods against like periods. A December return rate should be measured against last December, not the trailing twelve-month average, and when seasonality and channel mix move together, the comparison should also be broken out by sales channels. A spike tied to a product launch should be evaluated against that launch’s own cohort. What drives a spike in one category during one season won’t generalize to every brand or month, which is why the comparison has to be specific rather than assumed.
Recovery value changes while the returned item is in motion
A returned unit’s value isn’t fixed at the moment a customer requests a return. The value of returned items decays the longer that item takes to travel back, get inspected, and become sellable again, so recovery value and cycle time have to be measured together for better inventory management decisions by product category.
McKinsey’s research on apparel returns management found the difference between a retailer’s least and most expensive return channel averaged $5 to $6 per unit, and that in-store processing could save up to 18 days compared with warehouse processing, improving the odds an item resells at full price rather than at a markdown. Full return costs also include shipping and restocking labor, so tracking the complete operational cost supports more rational return window and return policy choices, especially when weighing the true cost of offering free returns. Those days are the gap between an item back on a shelf at full margin and one reaching a liquidator after a season has turned, with consequences for markdown exposure and the broader supply chain. Cahoot’s breakdown of the hidden economics of a return walks through the full cost stack this section only touches.
Use five return analytics diagnostic numbers before changing policy or product
Pull these five measurements before rewriting a return policy, redesigning a product, or restructuring reverse logistics. Together, they make up the diagnostic scorecard Komar presented at Ugly Talk NYC, useful as a working method rather than a universal Cahoot KPI standard every brand must adopt.
- Return rate split by customer cohort, especially new versus repeat, to separate an acquisition and fit-confidence problem from a retention problem.
- Return rate by SKU, ranked, to identify products carrying disproportionate return exposure instead of assuming volume spreads evenly.
- Recovery per returned unit, net of cycle time, to capture what an item was actually worth once it became sellable again, not what it was worth on the day it shipped.
- Reverse cost per unit versus forward cost per unit, to show how policy choices affect both cost recovery and customer experience instead of treating the return journey as a fixed cost.
- Share of returns the brand caused, covering wrong item, damage, lateness, misleading copy, fit or shade guidance, and product or packaging defects.
- Exchange-versus-refund mix, because exchanges retain revenue that refunds surrender and often correlate with higher satisfaction, creating a more positive experience.
Reading these five together, rather than one at a time, turns a single return-rate headline into a specific decision about acquisition, product, quality control, fulfillment, or reverse-logistics routing, including whether policy, routing, or store credit can improve recovery.
After diagnosis, manage the outcome KPIs separately
Effective ecommerce returns management separates diagnosis from outcome measurement, and conflating them is how a returns program tracks the wrong thing. The five-number scorecard above explains what’s driving a return-rate change. Once diagnosis points at a cause, outcome KPIs measure whether the response is working.
Cahoot’s guide to the KPIs that actually matter for modern returns management owns that second layer, covering metrics like refund time, share of returns eligible for peer-to-peer resale, and net cost per order. Predictive insights, machine learning, and fraud detection in modern returns management software can automate ecommerce returns management and cut handling costs by up to 40%. Those metrics show whether a returns operation is executing well; they don’t explain why the underlying return rate moved, which is the gap diagnosis closes first.
Cahoot is an end-to-end e-commerce returns management and fulfillment operations suite built around a simple principle: save every penny a returns process doesn’t need to spend while supporting brand reputation and customer satisfaction when execution is strong. A brand that has diagnosed where its returns value is actually being lost is better positioned to use a recovery lever like Cahoot’s Peer-to-Peer Returns or broader returns management software, which routes eligible items toward new demand instead of a full warehouse cycle, on the SKUs and cohorts where routing will matter most to enhance customer satisfaction.
Frequently Asked Questions
What is the best way to analyze an ecommerce return rate?
The best approach is systematic return analytics: split the blended rate into cohort, SKU, cause, seasonality, and recovery-value cuts rather than reacting to the headline number, and track product, variant, order, customer, and reason as core key metrics. Each cut points to a different owner and fix, whether that’s acquisition, merchandising, product quality, fulfillment, or reverse-logistics routing.
Why can an average ecommerce return rate be misleading?
An average blends every customer, product, season, and cause into one figure, so it can stay flat, rise, or fall for different reasons underneath, including shifts across customer segments and changes in customer behavior. A brand can show a stable company-wide rate while one cohort or a handful of SKUs drives most of the actual volume and cost.
Should ecommerce brands track return rate by new and repeat customers?
Yes. Repeat customers already know a brand’s fit and sizing, while new customers are often guessing for the first time. High return rates do not automatically lower customer lifetime value when the return experience is smooth. Carve Designs’ shift from a 35% new-customer and 25% repeat-customer return rate to roughly 20% and 12%, following combined fit and purchase-path work, shows how differently those cohorts can move. Brands can gauge the retention impact with Net Promoter Score.
How do you calculate return rate by SKU?
Divide units returned for a SKU by units of that SKU sold over the same period, then rank every SKU from highest to lowest. The goal is a ranked list showing which products drive disproportionate return volume, so a team can investigate the specific style, size grade, product page, or product descriptions.
Can return reason codes be inaccurate?
Yes. Komar’s Jay Harris described selected reason codes as frequently wrong in his own operating experience, using the shorthand “reason codes lie, garments don’t” to describe the gap between what a customer selects and what inspecting the item actually shows. Authentic negative reviews can also help validate whether fit or quality complaints are isolated or recurring.
Which returns metrics should ecommerce brands track beyond return rate?
Once diagnosis identifies the cause of a return-rate change, brands should also monitor self-service portal workflows, real-time tracking, and how they communicate proactively, alongside outcome metrics like refund time, share of returns eligible for peer-to-peer resale, and net cost per order. Many teams also track fraudulent returns, patterns involving multiple items, and the effect of free return shipping because they shape both cost and customer experience. Cahoot’s guide to the KPIs that actually matter for modern returns management covers that layer in detail. Automation can reduce handling costs by up to 40%.
Written By:
Manish Chowdhary
Manish Chowdhary is the founder and CEO of Cahoot, the most comprehensive post-purchase suite for ecommerce brands. A serial entrepreneur and industry thought leader, Manish has decades of experience building technologies that simplify ecommerce logistics—from order fulfillment to returns. His insights help brands stay ahead of market shifts and operational challenges.
Turn Returns Into New Revenue
Related Articles
Walmart Officially Allows Amazon Multi-Channel Fulfillment (MCF)
Big news for multichannel sellers: Walmart now officially allows Amazon Multi-Channel Fulfillment (MCF), Amazon’s service for using its fulfillment network to ship orders from mult...
Why More Automation Didn’t Lower Return Costs
Returns automation does improve returns operations: it cuts manual touches, smooths intake, speeds sorting, and makes workflow execution more consistent.
Shopify Subscription Payment Change: Why It Could Hurt Reactivation
Shopify changed how subscription payment information is handled at cancellation.
Return Fees vs. Free Returns: What Ecommerce Brands Should Actually Optimize
In this article
17 minutes
- Return fees and restocking fees work, but they also create a commercial cost
- Kulfi shows why some low-value returns should not come back at all
- Carve Designs prices refunds differently from exchanges
- The cheapest return is often the one the brand prevents
- Fraud needs targeted friction, not a worse policy for everyone
- Policy is only one part of the economics, routing and recovery speed matter
- Use a decision model, not a blanket return rule
- Measure return economics by cohort, SKU, recovery, and cycle time
- Frequently Asked Questions
Return fees are charges ecommerce brands may apply when customers send merchandise back, and they can reduce how often shoppers return items while also raising complaints, shrinking average order value, and pushing a buyer toward a competitor’s checkout instead of yours. For ecommerce operators deciding how to structure a returns policy, the real question isn’t whether to charge for returns at all; it’s which resolution, refund, exchange, keep-it credit, verification, resale, or physical return, actually protects both the customer relationship and the margin on that order.
Return fees are not a returns strategy on their own. They are one economic lever inside a much larger and very costly retail function, so the better decision is which resolution creates the best outcome for the customer and the merchant, not whether returns should be free or paid as a blanket rule. That’s what the operator data below focuses on: how charging for returns changes behavior, when alternatives like exchanges or keep-it credits work better, where fraud controls help or hurt, how return routing affects cost, and how to balance customer experience with sales and profitability.
Here’s what the operator data below actually shows:
- Charging for returns changes behavior. Merchant data cited by NRF shows lower overall return rates and higher exchange rates among brands that charge for at least one return option, alongside more complaints, lost customers, lower average order value, and lower sales.
- Kulfi Beauty treats exchanges and shade corrections as the first move, and lets customers keep low-value items outright rather than shipping them back.
- Carve Designs prices refunds and exchanges differently on purpose, and pairs that pricing with fit guidance that has measurably changed its cohort return rates.
- Fraud is real, at roughly 9% of returns industrywide, but blanket friction built to stop it tends to punish loyal customers more than it stops bad actors.
- The cheapest return is usually the one that never has to travel back to a warehouse at all.
- Return fees are one lever in a larger economic decision, not a substitute for one.
Return fees and restocking fees work, but they also create a commercial cost
U.S. retail returns were projected to reach $849.9 billion in 2025, with an estimated 19.3% of online purchases sent back, according to NRF and Happy Returns research. At that scale, even small shifts in return rate move real dollars, which is why fees keep coming up in board meetings.
The same NRF research shows why brands can’t treat fees as a free lever. Eighty-two percent of consumers say free returns are an important consideration when deciding where to shop, and 71% say they are less likely to shop with a retailer again after a poor return experience.
NRF’s merchant-side data adds the other half. Seventy-two percent of merchants surveyed charged for at least one return option, and the reported effects cut both ways, reinforcing how an exceptional returns program can be a loyalty driver as much as a cost center.
| Reported positive effects after charging | Reported negative effects after charging |
| 53% lower overall return rates | 47% more customer complaints |
| 52% increased exchange rates | 37% lost customers over fees |
| Fees recouped some revenue and shifted behavior toward exchanges | 34% lower average order value |
| Some shoppers chose a free alternative return method instead | 24% lower sales |
Read plainly, that table isn’t an argument for or against fees. It’s evidence that a return fee is a behavior-shaping tool with a measurable upside and a measurable commercial risk attached to the same decision. Fraud sits inside this picture too: NRF puts fraudulent returns at roughly 9% of the total, a benchmark worth knowing before deciding how much friction a policy needs (more below). None of this makes free returns the automatically safer default either; Cahoot has covered why free returns are no longer the sacred, unconditional expectation they were during the pandemic-era ecommerce boom, and has also detailed the rising financial and environmental cost of free returns. Fees change behavior in measurable ways, and an operator who treats that data as directional, not moral, makes better decisions than one who treats fees as either a betrayal or a free win.
Kulfi shows why some low-value returns should not come back at all
Kulfi Beauty’s approach starts before a return gets requested. Speaking on Cahoot’s Ugly Talk series, Kulfi’s Gabrielle Kerins described the brand’s first line of defense as an exchange or shade correction, not a refund.
For returns under $50, Kerins said Kulfi goes further: the customer keeps the item, and Kulfi deducts a processing fee rather than paying to ship the product back. Customers are sometimes encouraged to pass the item to a friend or sibling while Kulfi helps them find a better match. That guidance came from Kerins onstage, not Kulfi’s published policy; the brand’s current public FAQ lists a separate $6.95 return processing fee deducted from the refund, described as a way to partially recover shipping and processing costs, on Kulfi’s FAQ page. By comparison, H&M standardized a $3.99 mail return fee for all customers in 2025.
Kerins also treated the fee itself as a live experiment. Processing returns commonly costs about $10 to $30 per item, which helps explain why brands test deducted fees on low-value orders. A modest, competitively priced fee increase generated little pushback, but she was clear the brand would revisit it if feedback suggested the fee had become a real barrier to a customer’s first purchase.
Not every return Kulfi sees is a customer preference problem. Repeated return feedback on one lip product surfaced a pattern: packaging that had passed quality control behaved badly at certain temperatures, causing leaks. Kulfi used that data to repackage the product rather than assuming shoppers were simply changing their minds, a reminder that return reason data is a quality control signal, not just customer friction.
Carve Designs prices refunds differently from exchanges
Carve Designs’ public return policy draws a clean line between the two outcomes. A refund carries a $10 return shipping fee deducted from the amount refunded, but the brand allows one free exchange per order, and that fee isn’t charged on an exchange unless the same order also includes an item returned for refund, according to Carve’s returns and exchanges policy. Typical online return fees often fall in the $4 to $12 range for mail-in returns. By contrast, percentage-based restocking fees can run higher; Best Buy may charge a 15% restocking fee for opened items. The structure rewards the outcome Carve wants more of, an exchange that keeps revenue in the business, without waiving the cost of the one it wants less of, a refund that sends inventory and cash back out.
Pricing isn’t the only lever Carve pulls. Per a Komar event deck presented by Jay Harris at Ugly Talk NYC, roughly 20% of Carve shoppers opt into the brand’s proprietary swim fit quiz before buying, and the deck reports average order value rose and returns fell among that group, without attaching a specific reduction percentage to the quiz alone. The same deck shows a broader cohort shift: before Carve’s combined fit and purchase-path work, new-customer return rates ran around 35% and repeat-customer rates around 25%; after that work, the same cohorts fell to roughly 20% and 12%. That change illustrates how ecommerce return rates directly affect profit margins. That’s better pre-purchase guidance paired with a return policy that has real economic teeth, not one feature working alone.
The lesson isn’t “add a quiz.” Carve’s fee structure recovers cost and nudges customers toward exchanges, but the larger cohort-level improvement came from reducing wrong-size and wrong-fit purchases before they ever shipped.
The cheapest return is often the one the brand prevents
Apparel and footwear carry some of the highest return rates in ecommerce: fit can’t be verified until the product is on the customer’s body. Coresight Research estimated the U.S. online apparel return rate at 24.4%, with size and fit cited by 53% of surveyed brands and retailers as a top reason. Broader analyses of the rise in ecommerce return rates echo those drivers. The same Coresight research, sponsored by sizing-technology vendor 3DLOOK, estimated 2023 online apparel returns at roughly $38 billion, with about $25.1 billion in processing costs attached. Those numbers are apparel-specific; a beauty brand like Kulfi won’t see the same rate, and comparing return rates across categories without adjusting for that is a common mistake. Fees also tend to be higher for large or bulky items because return logistics get more expensive as size and weight increase.
What does travel across categories is the economics of where a return gets processed. McKinsey’s research on apparel returns management found the difference between a retailer’s least and most expensive return channel averaged $5 to $6 per unit, and that in-store processing could save up to 18 days compared with warehouse processing, improving the odds an item resells at full price. That helps explain why a retailer may set separate charges for different costs, and why a restocking fee can vary by product category; the true cost to process an e-commerce return can run $10 to $35.
Accurate product descriptions, clear sizing guidance, and basic quality control belong in the same conversation as return fees. Kulfi’s repackaging fix and Carve’s fit quiz are both prevention plays: they reduce the number of returns that ever need a fee policy applied. For the full accounting of what a return costs in labor, shipping, and lost inventory value, see Cahoot’s breakdown of the hidden economics of a return.
Fraud needs targeted friction, not a worse policy for everyone
Fraud is a real cost, but a smaller share of returns than most operators assume. NRF puts the market benchmark at roughly 9% of all returns reported as fraudulent, a useful anchor when one fraud story starts to drive an entire policy.
George Bova, also speaking on Ugly Talk, described a wholesale customer, a restaurant, that had used roughly 40% of a bottle of hand sanitizer before returning it for a refund. That’s abuse a brand can act on directly: a specific customer, a specific pattern, a consumption level that makes “changed my mind” implausible.
Bova also described the failure mode on the other side. One brand, trying to stop that kind of abuse, started requiring records, receipts, serial numbers, and other proof before processing any return. Legitimate refunds slowed down, and negative reviews followed. Friction applied evenly across every customer, instead of targeted at accounts and patterns that actually look like abuse, taxes loyal customers most while doing the least to stop the volume it was meant to reduce. It also should not be applied when the issue is a defective product, since charging restocking fees on defective items is illegal in most regions.
Policy is only one part of the economics, routing and recovery speed matter
A return fee changes what a customer does before shipping an item back. It does nothing to change what happens once that item arrives, and treating those as one cost center is how brands miss real savings. Many retailers waive return fees for in-store returns even when mailed returns cost more.
Blue Yonder’s research found 30% of surveyed retailers had implemented flexible return shipping charges or restocking fees that vary by reason, and 63% said charges always or sometimes vary by reason. The industry is moving away from one flat fee and toward routing decisions based on why an item is coming back.
The gap shows up in the workflow: forward fulfillment is typically three touches, pick, pack, ship. A reverse apparel path in Komar’s event framework at Ugly Talk NYC can run up to seven: receive, inspect, steam, re-tag, re-poly, re-slot, or liquidate. A brand can shrink that path without touching its refund policy, by routing eligible items around those steps instead of charging customers more.
Carve’s numbers illustrate this. Per the same Komar event materials, Redo was attributed roughly $250,000 in return-freight savings for Carve in one year, called onstage hundreds of thousands of dollars, without shortening the return window or adding a restocking fee. That’s one brand’s reported result, disclosed as Komar and Jay Harris’s event material rather than audited data, but it shows pricing and routing are separate levers.
This is the layer where Cahoot operates: an end-to-end fulfillment operations suite built around saving every penny a returns process doesn’t need to spend, a claim backed by fulfillment customer reviews highlighting lower shipping costs and better efficiency. Cahoot’s Peer-to-Peer Returns recovers value from eligible returned items before unnecessary warehouse processing and reverse logistics, building on the same peer-to-peer fulfillment model described in Cahoot’s overview of peer-to-peer as the future of order fulfillment. When a return starts, eligible items can be verified and matched against new demand; if a buyer orders during that resale window, the item ships directly to them instead of completing a warehouse cycle first. If no match exists, the item follows the standard workflow. Amazon charges return fees unless shoppers use label-free drop-off options. That changes routing economics, not policy harshness, part of the shift away from treating a warehouse as the only place a return can go. See how Cahoot’s Peer-to-Peer Returns can reduce unnecessary reverse-logistics cost on eligible returns.
Use a decision model, not a blanket return rule
Kulfi keeps low-value items rather than shipping them back; Carve charges a flat fee on refunds but not exchanges; Cahoot’s routing model changes what happens after a return starts rather than what a customer pays upfront. Each decision gets made at the level of the individual return, not as a blanket rule for every order.
A practical version of that decision looks like this:
- Resale value: What can this item resell for, after reverse shipping, handling, and cycle time?
- Who caused it: Did the customer change their mind, or did the brand cause it through the wrong item, damage, lateness, poor fit or shade guidance, or a defect? When the brand caused the problem, a fair approach also accounts for region-specific legal regulations that may govern what a seller can charge.
- Exchange potential: Would an exchange solve the problem and preserve more revenue than a refund?
- Fraud signal: Is there real evidence of abuse justifying targeted verification, or would friction just slow a legitimate customer?
- Routing need: Does this need to travel back to a warehouse, or is there an eligible route that avoids reverse logistics costs the brand doesn’t need to pay?
Answer those honestly, and the right resolution usually becomes obvious without a company-wide policy debate. The future of returns isn’t free returns or paid returns. It’s economically intelligent returns, priced and routed based on what a specific return actually costs and recovers, not on an ideology about fees.
Brands matching resolution to individual customer history and segment, rather than just return type, are getting into personalization territory beyond what a single fee policy can do. Customer history can include loyalty status, since members are often exempt from return fees. Cahoot covers that ground in its guide to individualized ecommerce return policies; the fundamentals of an ecommerce return policy are worth reviewing before layering fees, exchanges, or segment logic on top.
Measure return economics by cohort, SKU, recovery, and cycle time
A blended return rate hides more than it reveals. Komar’s operator framework, presented at Ugly Talk NYC, breaks that single number into measurements that actually point to a decision.
- Return rate split by cohort, new versus repeat customers, the way Carve’s shift from 35% to 20% among new customers and 25% to 12% among repeat customers played out differently.
- Return rate ranked by SKU rather than one blended average, since a handful of products usually drive most of the returns.
- Recovery value per unit measured net of cycle time, since an item that resells in three weeks is a different outcome than one resold in three days.
- Reverse cost per unit compared against forward cost per unit, the same comparison that makes the seven-touch reverse path visible.
- The share of returns the brand itself caused, wrong item, damage, lateness, fit or shade guidance, or a defect, the category Kulfi’s leaky packaging story falls into.
That last measurement matters more than it usually gets credit for. A brand that assumes every return is a customer decision will keep adjusting fee policy to influence behavior, when the data might actually point at a packaging defect or a sizing chart that needs updating. Reading return reason data as an operational signal, not just a satisfaction metric, turns returns from a cost center into a source of product improvement.
Frequently Asked Questions
Should ecommerce brands offer free returns or charge return fees?
Charging for returns is legitimate, but not automatically right. Many major retailers adjust policies during the holiday season, such as Amazon allowing returns until January 31, 2026 and Best Buy extending returns until January 15, 2026 for holiday purchases. NRF’s merchant data shows fees can lower return rates and increase exchange rates, while also raising complaints and losing customers over the fee. The better question is whether a fee fits a specific category and customer base, not whether fees are universally good or bad.
Do return fees reduce return rates?
Yes. Per NRF’s merchant survey, 53% of merchants that charged for at least one return option reported lower overall return rates, and 52% reported increased exchange rates, alongside more complaints and lost customers.
Can return fees hurt sales or customer loyalty?
They can. NRF data found merchants who charged fees also reported 34% lower average order value, 24% lower sales, and 37% of customers lost over the fee. Separately, 71% of consumers say they’re less likely to shop again with a retailer after a poor return experience.
When should a brand offer free exchanges but charge for refunds?
This works well when a brand wants to preserve revenue and keep the customer in the product, as Carve Designs does with one free exchange per order alongside a return fee on refunds. It fits apparel and footwear well, where the return is often a fit or shade problem an exchange can solve.
When does a keep-it refund make economic sense?
A keep-it resolution, where the customer keeps the item and the brand deducts a fee from the refund, makes sense when the item’s value is too low for reverse shipping, inspection, and restocking to be worth recovering it. Kulfi applies this logic to low-value returns.
How should ecommerce brands decide which returns within return windows should go back to a warehouse?
A return should go to a warehouse when no faster or cheaper eligible recovery route exists, such as resale to a new buyer during a defined window, local processing, or keep-it resolutions sometimes called returnless refunds. When a match exists, brands recover value without the full receive-inspect-restock cycle and may also avoid charges tied to a prepaid label or return shipping label by directing the shopper to a designated location or to a person for handoff; when it doesn’t, the standard workflow applies.
Written By:
Manish Chowdhary
Manish Chowdhary is the founder and CEO of Cahoot, the most comprehensive post-purchase suite for ecommerce brands. A serial entrepreneur and industry thought leader, Manish has decades of experience building technologies that simplify ecommerce logistics—from order fulfillment to returns. His insights help brands stay ahead of market shifts and operational challenges.
Turn Returns Into New Revenue
Related Articles
Walmart Officially Allows Amazon Multi-Channel Fulfillment (MCF)
Big news for multichannel sellers: Walmart now officially allows Amazon Multi-Channel Fulfillment (MCF), Amazon’s service for using its fulfillment network to ship orders from mult...
Why More Automation Didn’t Lower Return Costs
Returns automation does improve returns operations: it cuts manual touches, smooths intake, speeds sorting, and makes workflow execution more consistent.
Shopify Subscription Payment Change: Why It Could Hurt Reactivation
Shopify changed how subscription payment information is handled at cancellation.
Amazon AWD Size Limits Changed: What Bulky Sellers Must Do Before Q4 2026
In this article
15 minutes
- The Sellable Unit Is Tested, Not the Master Carton
- Existing AWD Stock Is a Finite Transition Buffer
- Q4 Deadlines Make the Change Immediate
- Sellers Lose More Than Low-Cost Storage
- The Cost Exposure Depends on SKU Volume and Weight
- Route Each Affected SKU Instead of Moving the Whole Catalog
- Audit the Catalog Before the Next Purchase Order
- How Cahoot Helps Rebuild the Buffer Without More Operational Sprawl
- Frequently Asked Questions
Beginning July 31, 2026, Amazon AWD stopped accepting new sortable sellable units at or above 18x14x8 inches or 20 lb, so any unit that meets or exceeds those thresholds is no longer eligible for AWD inbound shipments. For Amazon sellers who used Amazon Warehousing and Distribution as low-cost, upstream storage for bulky, seasonal, or slow-moving inventory, that cuts off AWD as an inbound route for every Small Bulky, Large Bulky, and Extra-Large FBA unit and forces a fulfillment-plan change before peak season.
This is not a pricing adjustment, it is a category change: AWD becomes a small-item program, and bulky SKUs must be re-routed through direct FBA, an external buffer, a third-party logistics provider, or another strategy before Q4 2026 volume arrives. Below, we break down the new Amazon AWD size and weight limits, what they do to bulky-inventory fulfillment, the cost and routing tradeoffs, the deadlines that matter, and how Cahoot can help sellers avoid shipment disruptions, higher costs, and lost sales. The first step is mechanical: pull packaged dimensions and weight for every affected ASIN and check them against the new gate before the next AWD shipment.
The Sellable Unit Is Tested, Not the Master Carton
Amazon validates ASIN eligibility during shipment creation, and the test applies to the individual sellable unit, including retail packaging, not the master carton it ships in. A shipping carton holding several compliant units can pass its own carton limits while units inside pass or fail independently. Confusing the two is the most common way sellers misjudge AWD eligibility.
The threshold is strict. A unit measuring exactly 18, 14, or 8 inches on any side, or weighing exactly 20 lb, does not qualify, since Amazon’s published limits read “smaller than” and “less than,” not “at or below.” The envelope: 18 x 14 x 8 inches equals 2,016 cubic inches, about 1.17 cubic feet, and true eligible volume runs slightly under that once the strict inequality applies.
Exhibit 1: Eligibility examples
| Unit dimensions and weight | Result | Reason |
| 17 x 13 x 7 in, 19 lb | Passes | Under all four thresholds |
| 10 x 10 x 10 in, 5 lb | Fails | Third dimension exceeds 8 inches |
| 19 x 8 x 6 in, 8 lb | Fails | Longest side exceeds 18 inches |
| 17 x 13 x 7 in, exactly 20 lb | Fails | Amazon requires less than 20 lb |
| 17 x 13 x 7 in unit in a compliant 25-inch master carton | Unit may pass; carton may separately pass | Unit and carton are tested independently |
AWD master cartons carry a separate shipment rule: no side over 25 inches and no more than 50 lb, even though Amazon has expanded the maximum FBA box length to 36 inches for certain FBA shipments. A carton can satisfy that rule while holding units that individually fail the sellable-unit gate, and the reverse is also true. Seller Central measurement and eligibility results control, so a spec sheets dimension is a starting point, not a final answer.
AWD has also always carried category restrictions independent of size: hazmat items are not eligible for AWD storage, and dangerous goods, battery products, non-spillable batteries, wax-based products, and expiration-dated items face added documentation. Those rules did not change on July 31, but they are strictly enforced and compound the size gate for sellers with regulated SKUs.
Existing AWD Stock Is a Finite Transition Buffer
Non-sortable units already stored in AWD before the July 31 cutoff are not automatically pulled from the facility. Amazon has indicated existing affected inventory can remain as a finite transition buffer and continue replenishing FBA under its announced treatment, with affected units referring to units no longer eligible to be newly supplied through AWD after the cutoff. That is a bridge, not a new allowance: it does not permit new receipts of over-threshold units, and it does not guarantee indefinite storage.
Sellers should verify current status for every affected ASIN in Seller Central rather than assume last quarter’s shipment record still applies. Confirm current awd inventory levels in Seller Central, how they reconcile against what remains in the facility, how it is being drawn down, and whether Amazon has flagged a wind-down timeline. Also separate awd inventory from inbound shipments so you know what stock is still available versus only on the way. Treat this buffer as inventory moving through a transition period, not permanent fulfillment capacity.
Q4 Deadlines Make the Change Immediate
The size-limit change lands inside peak planning. Amazon’s 2026 arrival cutoffs for Prime Big Deal Days are September 2 for AWD, September 9 for FBA minimal-split shipments, and September 16 for FBA optimized-split shipments. For Black Friday and Cyber Monday, the cutoffs are October 14, 21, and 28 respectively. Amazon states shipments arriving later are not guaranteed to be processed in time. These cutoffs sit inside Amazon’s broader 2026 holiday fulfillment fee changes, which reach well beyond AWD-excluded SKUs, and they raise the stakes on having ecommerce fulfillment software that can dynamically reroute inventory as deadlines shift.
Because affected bulky units have already lost the AWD route, sellers now work backward from the FBA cutoffs. Amazon recommends delivery appointments at least seven days before the cutoff and Partnered Carrier pickups at least 14 days before.
Exhibit 4: Cahoot back-plan using Amazon’s minimum seven-/14-day guidance
| Direct-FBA route | Cutoff | Appointment | Partnered pickup |
| PBBD, minimal split | Sep. 9 | Sep. 2 | Aug. 26 |
| PBBD, optimized split | Sep. 16 | Sep. 9 | Sep. 2 |
| BFCM, minimal split | Oct. 21 | Oct. 14 | Oct. 7 |
| BFCM, optimized split | Oct. 28 | Oct. 21 | Oct. 14 |
As of publication, the August 26 pickup window for the PBBD minimal-split route has already passed, and the September 2 appointment date for that route is imminent. Sellers still planning PBBD inventory should move to the optimized-split lane or confirm an alternate route can land before September 9. Longer transit lanes may need earlier booking, so treat the 7-/14-day figures as a floor, not a target.
Sellers Lose More Than Low-Cost Storage
The practical mistake is treating this as a storage price story. AWD combined functions that bulky sellers now have to replace individually: bulk pallet storage away from fulfillment centers, auto replenishment into FBA based on demand as stock sells or manual replenishment on the seller’s schedule, included FBA inbound placement rather than a separately billed fee, and peak-capacity relief during the weeks FBA capacity is tightest.
Amazon has reported that sellers enrolled in AWD in Q4 2025 shipped more than 13% more units and saw a greater than 30% reduction in out-of-stock days. Amazon reported both figures; they describe outcomes for AWD participants broadly, not a guarantee tied to any seller or replacement route, and should not be read as independent research or a promise that an alternative reproduces the same result. They do illustrate AWD’s operational role: fewer stockouts and higher sell-through during the year’s busiest stretch.
Losing that buffer means a seller now owns the sequencing Amazon used to manage: how much bulk stock to hold, where it should sit relative to customer demand, and how often to replenish FBA as part of a broader fulfillment strategy that avoids disruption across channels. That routing logic once leaned in part on Amazon’s network, so sellers now have to replicate more of it themselves while capacity limits at fulfillment centers tighten heading into peak. Sellers who want the fuller mechanics of how AWD storage, replenishment, and placement fit together can start with Cahoot’s Amazon AWD guide.
The Cost Exposure Depends on SKU Volume and Weight
Two cost categories change for bulky SKUs pushed out of AWD: storage, including the awd storage fees sellers give up when those units can no longer sit there, and, for units routed through Send to Amazon’s minimal-split option, placement fees.
Exhibit 2: Cahoot calculation using Amazon-published storage rates
AWD storage runs $0.48 per cubic foot monthly in the East Coast, Southeast, and South Central regions, and $0.57 in the West. FBA oversize storage runs $0.78 monthly from January through September, and $2.43 from October through December, about 3.1 times the off-peak rate.
| Q4 volume | AWD storage (3 months) | FBA oversize storage (3 months) | Difference |
| 100 cu. ft. | $144-$171 | $729 | $558-$585 |
| 500 cu. ft. | $720-$855 | $3,645 | $2,790-$2,925 |
| 1,000 cu. ft. | $1,440-$1,710 | $7,290 | $5,580-$5,850 |
This table isolates storage only. It excludes inbound freight, AWD processing and transportation, FBA fulfillment fees, placement fees, aged-inventory charges, capacity fees, and 3PL receiving and handling. It is not a total-cost or total-savings figure, only one input into a routing decision.
Exhibit 3: Cahoot calculation using Amazon-published per-unit placement ranges
For Small Bulky inventory sent through Amazon’s minimal-split option, Amazon publishes a per-unit placement fee range by weight tier. These are placement fees only, before freight, storage, and fulfillment.
| Weight | Per unit | 1,000 units | 5,000 units |
| 5 lb or less | $1.10-$1.60 | $1,100-$1,600 | $5,500-$8,000 |
| Over 5-12 lb | $1.75-$2.40 | $1,750-$2,400 | $8,750-$12,000 |
| Over 12-28 lb | $2.74-$3.50 | $2,740-$3,500 | $13,700-$17,500 |
| Over 28-42 lb | $3.95-$4.95 | $3,950-$4,950 | $19,750-$24,750 |
| Over 42-50 lb | $4.80-$5.95 | $4,800-$5,950 | $24,000-$29,750 |
Optimized splits can carry no placement fee at all, but typically require more destinations and different freight economics. Direct FBA is not always the cheapest path, and FBM can be cheaper for slow-moving oversized SKUs. The quote generated at shipment creation controls the actual fee; these ranges are for planning, not invoicing. That matters even more in Q4, when tight warehouse space can change storage economics. Those tradeoffs often determine how oversize inventory gets routed.
Route Each Affected SKU Instead of Moving the Whole Catalog
The instinct to move every affected SKU to a third-party warehouse is understandable and usually wrong. The right response is a SKU-by-SKU decision built on velocity, variability, dimensions, margin, and channel demand.
Fast, predictable bulky SKUs
Stable sell-through and margin to absorb oversize storage and placement fees can keep these SKUs on direct FBA, particularly if Q4 volume keeps the exposure in Exhibit 2 and Exhibit 3 manageable and your fba shipments plan also accounts for box weight compliance. Cahoot’s Amazon AWD vs. FBA comparison walks through that trade-off in more detail.
Seasonal, volatile, or long-lead-time SKUs
These are the ones AWD was built for. They generally fit better in an external buffer, such as a third-party warehouse, with measured FBA replenishment timed to demand rather than a fixed schedule; that setup can also support other sales channels as part of a multi channel distribution approach, with multiple units flowing into standard replenishment batches to avoid stranded inventory and Q4 storage-fee spikes, especially when paired with specialized order fulfillment services for ecommerce companies. Cahoot’s Amazon FBA vs. 3PL cost breakdown covers that comparison in more depth.
FBM or Seller Fulfilled Prime
This route fits only when parcel economics, coverage, margins, and operating standards support it. SFP is not generic two-day shipping; it requires meeting Amazon’s updated Seller Fulfilled Prime requirements and is not the answer for every bulky SKU just because AWD no longer is. Cahoot’s Amazon FBA vs. FBM comparison covers the operational trade-offs, and sellers evaluating SFP further can review Cahoot’s Amazon Seller Fulfilled Prime guide for program requirements and the current Seller Fulfilled Prime 3PL shortlist for vetted partners.
Packaging redesign for borderline SKUs
A unit at 19 x 8 x 6 inches fails on one dimension; have the packaging team verify the sellable-unit dimensions and weight before any redesign decisions are made, since trimming that side under 18 inches, or cutting weight under 20 lb, restores eligibility without changing the product.
A qualifying GWD route for off-Amazon distribution
Separate from AWD, this may fit specific SKUs once current eligibility is verified in Seller Central. Global Warehousing and Distribution launched on April 9, 2026, and compared with us awd as the domestic baseline, warehousing and distribution awd is a separate route sellers should use only after confirming the SKU and origin profile fit.
Audit the Catalog Before the Next Purchase Order
Before the next inbound shipment, run every affected ASIN through a short checklist, and use a structured 3PL RFP template for evaluating Amazon prep and logistics partners if you plan to shift inventory into external warehouses:
- Packaged dimensions and weight, confirmed in Seller Central, and checked against packaging details before shipment creation
- Confirm whether the ASIN accepts sortable items under current AWD rules
- Size tier and catalog attribute accuracy
- Sell-through velocity, seasonality, and weeks of cover
- Expected Q4 unit volume by SKU
- Placement option and fee exposure
- Inbound freight mode and lead time, including open pickup windows and any limits that apply to pallet shipments for direct-FBA routing
- Storage profile under off-peak versus October-December rates
- Parcel costs and coverage if FBM or SFP is considered
- Margin per unit after added storage, placement, and freight
- Demand on other channels, not just Amazon
- Packaging redesign feasibility for narrow misses
- Track expiration date risk for any date-sensitive inventory
Missing catalog attributes are a common cause of incorrect eligibility results. Confirm dimensions and weight before escalating a rejected shipment to Selling Partner Support, and use Amazon’s Seller Assistant if ASIN classification or eligibility appears wrong.
How Cahoot Helps Rebuild the Buffer Without More Operational Sprawl
Cahoot is a connected ecommerce fulfillment operations layer, not a single warehouse, a shipping tool, or a WMS bolted onto existing systems. For sellers rebuilding the buffer AWD used to provide, that distinction matters. Cahoot can coordinate inventory placement across a distributed fulfillment network, including Bring-Your-Own-3PL workflows and external warehouse nodes for sellers with existing warehouse relationships when AWD is no longer an option for bulky and oversize inventory, standardize shipment creation and labeling workflows across locations through deep order fulfillment integrations with major ecommerce partners as Amazon no longer provides item labeling services for US FBA shipments, and keep replenishment, tracking, and SLA governance visible instead of scattered across vendors.
Cahoot helps ecommerce brands save every penny, scale operations without adding complexity, and outperform on every sales channel through its networked order fulfillment services for ecommerce companies. Saving every penny means SKU-level modeling of where inventory should sit, cartonization and zone reduction that lower shipping costs, and fulfillment placed closer to the customer and customer demand, surfacing cost leaks a single storage rate can hide. Scaling without complexity means centralized routing and standardized workflows across a distributed footprint, not a pile of new vendors. Outperforming on every channel matters because Amazon decisions do not happen in isolation: the same inventory typically also serves Shopify, Walmart, TikTok Shop, B2B, wholesale, and retail demand.
None of this replaces direct FBA where it still works, and SFP fits only sellers who meet its bar. The point is modeling each SKU against real options, not defaulting every bulky unit to whichever route is loudest. In one operating layer, sellers can also keep visibility into inbound flows and shipments created across channels and nodes.
Frequently Asked Questions
What are Amazon AWD’s size and weight limits after July 31, 2026?
Only sortable sellable units qualify, and AWD now accepts sortable items only; they must be smaller than 18 x 14 x 8 inches and weigh less than 20 lb. A unit at exactly any of those thresholds does not.
Do the new Amazon AWD limits apply to the sellable unit or the master carton?
The individual sellable unit, including retail packaging. Amazon measures the sellable unit for AWD size eligibility, not the shipping carton. Master cartons follow a separate rule, no side over 25 inches and no more than 50 lb, tested independently.
What happens to oversized inventory already stored in AWD?
It can remain as a finite transition buffer as existing AWD inventory and continue replenishing FBA under Amazon’s announced treatment. Keep that stock separate from inbound shipments still in transit when checking quantities or planning moves. Verify current status and any wind-down timeline in Seller Central rather than assume indefinite eligibility.
Can bulky products still be sent directly to Amazon FBA?
Yes, where the ASIN qualifies for its size tier. Amazon validates eligibility at shipment creation, and units excluded from AWD can generally still move through direct FBA, subject to that tier’s limits and fees.
How much more could direct FBA storage and placement cost?
FBA oversize storage from October through December runs about 3.1 times the off-peak rate, and Small Bulky minimal-split placement fees range roughly $1.10 to $5.95 per unit by weight. Exposure depends on volume and shipment option.
What are the best AWD alternatives for bulky Amazon inventory?
There is no single best alternative. Fast, predictable SKUs may fit direct FBA; seasonal or long-lead SKUs fit better in an external buffer with measured replenishment; FBM or SFP fits only where parcel economics support it; and packaging redesign can restore eligibility for units that miss the threshold narrowly.
Affected sellers do not need to solve this catalog-wide at once. Model the SKUs Q4 volume depends on first, route each against its own velocity, dimensions, and margin, and treat AWD’s transition buffer as time to plan with, not a deadline to react to. Cahoot can help model and route affected SKUs systematically before the next purchase order.
Written By:
Manish Chowdhary
Manish Chowdhary is the founder and CEO of Cahoot, the most comprehensive post-purchase suite for ecommerce brands. A serial entrepreneur and industry thought leader, Manish has decades of experience building technologies that simplify ecommerce logistics—from order fulfillment to returns. His insights help brands stay ahead of market shifts and operational challenges.
Turn Returns Into New Revenue
Related Articles
Walmart Officially Allows Amazon Multi-Channel Fulfillment (MCF)
Big news for multichannel sellers: Walmart now officially allows Amazon Multi-Channel Fulfillment (MCF), Amazon’s service for using its fulfillment network to ship orders from mult...
Why More Automation Didn’t Lower Return Costs
Returns automation does improve returns operations: it cuts manual touches, smooths intake, speeds sorting, and makes workflow execution more consistent.
Shopify Subscription Payment Change: Why It Could Hurt Reactivation
Shopify changed how subscription payment information is handled at cancellation.
Why Even a 4:30 PM Cutoff Cannot Solve Amazon’s 40% One-Day SFP Rule
In this article
18 minutes
- Short Answer
- What Changed in Amazon's Seller Fulfilled Prime Requirements on July 6, 2026?
- How Does Amazon Calculate the 40% One-Day SFP Page-View Metric?
- What Does Amazon's Temporary Weekend Exclusion Actually Change?
- Why Is a 4:30 PM ET Seller Fulfilled Prime Cutoff Already Unusually Late?
- Why Can an East Coast Warehouse Still Lose West Coast One-Day Page Views?
- Why Doesn't Next Day Air Solve Every SFP Speed-Metric Problem?
- Why Do the Obvious SFP Fixes Fall Short?
- When Does Distributed Fulfillment Become More Sustainable Than Routine Air Shipping?
- What Decision Does a Single-Node SFP Merchant Face?
- What Should an SFP Merchant Evaluate Next?
- Frequently Asked Questions
- When the Remaining SFP Gap Is Geographic
An established ecommerce merchant shipping more than 20,000 monthly orders from Pennsylvania had already pushed its cutoff to 4:30 PM Eastern Time and was willing to use Next Day Air extensively to protect Amazon Prime delivery promises.
Yet a Cahoot assessment observed approximately 15% one-day page-view coverage—not 40%. That does not establish that the merchant failed Amazon’s metric or lost Seller Fulfilled Prime eligibility. It shows why a strong operation can hit a geographic ceiling that later cutoffs and faster transportation cannot fully remove.
Short Answer
Amazon’s July 2026 SFP update makes the amazon sfp cutoff time more consequential: Amazon requires Seller Fulfilled Prime cutoff times to be no earlier than 2:00 PM local time, and while a 4:30 PM ET cutoff is already operationally aggressive, it is only 1:30 PM PT and cannot by itself solve the new delivery-speed standard. For ecommerce merchants running SFP, the real issue is maintaining Prime eligibility when standard-size offers must show delivery within one calendar day for at least 40% of eligible Prime page views, effective July 6, 2026.
West Coast shoppers continue browsing after the Pennsylvania warehouse’s same-day window closes, and Next Day Air cannot restore the handling day lost after cutoff. At that point, inventory placement—not carrier speed alone—becomes the constraint. This analysis breaks down Amazon’s updated SFP delivery thresholds, how the one-day metric is calculated from customer page views, why late cutoffs and weekend fulfillment still leave coverage gaps, and what sellers can do with inventory placement and network distribution to improve performance before stricter standards cost them delivery promise visibility and sales.
Watch: Why a 4:30 PM Cutoff Still Leaves a One-Day Gap
A Pennsylvania seller can keep its warehouse open until 4:30 PM Eastern and still lose one-day page views from California shoppers browsing later in their afternoon. Manish walks through the time-zone and delivery-promise problem—and why paying for Next Day Air cannot recover a handling day lost after cutoff.
The takeaway: Amazon’s one-day speed metric depends on the delivery date shown when an eligible Prime customer views the offer. A 4:30 PM Eastern cutoff is only 1:30 PM Pacific. Once that warehouse’s same-day window closes, faster transit alone cannot make every later West Coast page view a one-day promise. The sections below examine the metric, cutoff rules, and fulfillment options in detail.
What Changed in Amazon’s Seller Fulfilled Prime Requirements on July 6, 2026?
Amazon raised the standard-size one-day delivery-speed threshold from 30% to 40% of eligible Prime customer page views, following a series of stricter Seller Fulfilled Prime and premium-shipping changes that have steadily tightened performance expectations. That is a 10-percentage-point increase, but a 33.3% relative increase in the one-day coverage sellers must produce.
Amazon SFP Prime Badge Rule at a Glance
| Item | What sellers need to know |
|---|---|
| Effective date | July 6, 2026 |
| Standard-size one-day threshold | 40% of eligible Prime customer page views |
| Standard-size two-day threshold | 75% |
| Standard-size five-day threshold | 90% |
| Measurement basis | The delivery promise shown during qualifying Prime customer page views—not the percentage of orders shipped by air |
| Weekday cutoff minimum | 2:00 PM local time or later |
| Temporary weekend treatment | Weekend page views excluded from speed evaluation from May 31 through October 17, 2026; weekend fulfillment still required |
| Scheduled Amazon change | ZIP-code-level shipping-time, weekend-availability, and cutoff inputs scheduled for September 2026 |
The previous standard-size thresholds were 30% within one day, 70% within two days, and 90% within five days. Amazon’s SFP performance requirements describe delivery speed in terms of what qualifying Prime shoppers see, alongside other performance metrics such as a valid tracking rate of at least 99% and a cancellation rate below 0.5%. Cahoot’s complete Seller Fulfilled Prime requirements guide covers the broader program—including on-time delivery, tracking, cancellation, weekend operations, and trial requirements—and notes that Amazon reviews these performance metrics weekly, with removal from the program possible after three weeks of missing them.
How Does Amazon Calculate the 40% One-Day SFP Page-View Metric?
Amazon calculates the SFP delivery-speed metric from the customer-facing delivery date displayed during eligible Prime page views, based on the customer’s location—not from the shipping service eventually purchased for completed orders. This approach is consistent with Amazon’s broader new Seller Fulfilled Prime framework introduced in 2023, which emphasizes nationwide one- and two-day coverage rather than just fast shipping on completed orders.
That distinction matters because a page view happens before an order exists. Amazon evaluates whether the displayed date is within one calendar day, two days, or longer, and whether the displayed promise can still qualify before the cutoff time passes based on the order cutoff time Amazon uses. A seller can execute every order correctly while still showing a one-day promise on too few qualifying page views.
Consider the Pennsylvania merchant. The operation can use Next Day Air for an order received before 4:30 PM ET because the warehouse still has time to fulfill and tender the package that evening. But when a California customer views the same offer at 2:00 PM PT, it is already 5:00 PM in Pennsylvania. The warehouse cutoff has passed. Amazon must account for a later handling day before carrier transit even begins.
This is why flawless trial execution can create false confidence. Non-buying shoppers may still see a slower promise. Cahoot’s failed SFP trial analysis explains how cutoffs, shipping templates, handling-time feeds, inventory, and page-view geography affect it.
Public seller discussions illustrate the same disconnect. One seller reported a 4:00 PM cutoff, 5:00 PM pickup, and a one-day metric in the low-to-mid 30% range. Another reported nationwide Next Day Air, a 4:00 PM cutoff, Saturday operations, hundreds of daily orders, and a one-day metric below 30%. These are anecdotes, not representative survey data, but they align with the mechanics of a page-view metric.
What Does Amazon’s Temporary Weekend Exclusion Actually Change?
Amazon’s temporary weekend exclusion removes weekend page views from the delivery-speed calculation through October 17, 2026. It does not suspend the 40% weekday requirement, and it does not remove the obligation to fulfill SFP orders on weekends. Sellers must ship Prime orders on Saturday, Sunday, or both to stay compliant.
Amazon said weekend page views would be excluded from speed evaluation from May 31 through October 17 while sellers adapted. The 40% threshold still took effect July 6 for evaluated page views. Amazon temporarily removed weekends from the score—not from the job.
The Pennsylvania observation occurred while weekends were excluded, so the pressure cannot be attributed only to a weekend operating gap. When weekend views return after October 17, sellers with weaker weekend coverage could face additional pressure, although the effect will vary. Once weekend requirements are enforced, failing to operate on weekends can cost a seller the Prime badge.
Amazon also scheduled a September feature for ZIP-level shipping times, weekend availability, and cutoffs. More precise inputs may improve displayed promises. Until Amazon confirms the feature is live, sellers should treat it as scheduled—and not confuse better configuration with physically faster fulfillment.
Why Is a 4:30 PM ET Seller Fulfilled Prime Cutoff Already Unusually Late?
A 4:30 PM Seller Fulfilled Prime cutoff is 2.5 hours later than Amazon’s 2:00 PM weekday minimum. Those extra hours require real labor, capacity, carrier coordination, and operational risk.
Amazon’s order-fulfillment settings FAQ says weekday cutoffs cannot be earlier than 2:00 PM local time and must be at least 30 minutes before carrier pickup. A 4:30 PM cutoff therefore implies a pickup no earlier than 5:00 PM, plus enough time to pick, pack, label, sort, and stage a late wave.
Extending the cutoff also compresses the recovery window. Inventory, address, packaging, system, or labor exceptions have less time to be corrected. The late cutoff is not evidence of a slow warehouse; it shows the merchant has pushed centralized same-day fulfillment unusually far—often beyond what traditional 3PLs can support without a specialized ecommerce order fulfillment service built for late cutoffs and weekend operations.
That experience matches a seller report describing 4:00 PM as the latest practical cutoff before a 5:00 PM carrier pickup. The ceiling differs by facility, but the constraints are physical: processing speed and carrier acceptance.
Why Can an East Coast Warehouse Still Lose West Coast One-Day Page Views?
An East Coast cutoff occurs three hours earlier for West Coast shoppers. A 4:30 PM cutoff in Pennsylvania ends the merchant’s same-day fulfillment window at only 1:30 PM in California.
| Eastern Time | Pacific Time | Operational meaning |
|---|---|---|
| 2:00 PM ET | 11:00 AM PT | Amazon’s minimum weekday SFP cutoff |
| 4:30 PM ET | 1:30 PM PT | The merchant’s unusually aggressive cutoff; Pennsylvania’s same-day window closes |
| 6:00 PM ET | 3:00 PM PT | West Coast shoppers are still browsing after the Pennsylvania cutoff |
| 8:00 PM ET | 5:00 PM PT | The West Coast business day ends hours after the Pennsylvania same-day window |
The warehouse may be fast, accurate, and fully staffed. Pennsylvania still cannot remain open indefinitely to cover an entire California shopping day. Once the cutoff passes, late West Coast page views begin with a handling-day disadvantage before the package travels a mile.
One seller reported nearly 700 after-cutoff views over two days for an ordinarily low-traffic ASIN. Whatever caused the traffic, after-cutoff browsing can affect a page-view metric even when few shoppers purchase.
Another East Coast seller reported historically serving more than 75% of customers with reasonably priced regional two-day shipping. Strong regional coverage does not necessarily produce national one-day promises after the origin closes.
Why Doesn’t Next Day Air Solve Every SFP Speed-Metric Problem?
Next Day Air is one form of expedited shipping that accelerates transit after carrier tender. It still cannot recover a handling day that Amazon must add when the page view occurs after the warehouse cutoff.
Suppose a California shopper views the Pennsylvania merchant’s offer at 2:00 PM PT on Monday. It is 5:00 PM ET, after the 4:30 PM cutoff. The earliest normal sequence may be:
• Monday: The shopper views the offer after cutoff.
• Tuesday: The warehouse fulfills and tenders the package.
• Wednesday: Next Day Air delivers it.
Wednesday is two calendar days after Monday’s page view. The air service performs as purchased, but the package entered the network Tuesday. An Amazon forum moderator similarly explained that after cutoff, the fastest promise is two days or more depending on the shipping template.
Air can protect before-cutoff orders, remote destinations, inventory imbalances, or isolated failures. The expensive pattern is using expedited shipping routinely to create national Prime speed from one origin, and leaning on expedited shipping options too often can erode margins even when it protects isolated Prime promises. A SKU-level review should identify SKUs that should not be enrolled in Seller Fulfilled Prime when premium-shipping risk overwhelms contribution margin.
Why Do the Obvious SFP Fixes Fall Short?
Common SFP fixes address only part of the cutoff problem. None removes the combined constraints of time, distance, inventory, and carrier availability.
Can Sellers Extend Their SFP Cutoff?
Yes. A later cutoff recovers same-day handling time, but every warehouse reaches a labor, dispatch, or carrier-pickup ceiling. Moving from 2:00 PM to 4:30 PM adds 2.5 hours; it does not cover the remaining West Coast afternoon.
Can Sellers Use Next Day Air?
Yes, when the warehouse tenders the order on the same day. Next Day Air solves the transit portion of the promise, not the handling portion. After cutoff, the seller has already lost a calendar day before the package enters the air network.
Does Weekend Delivery Operation Fix the Metric?
Weekend execution is necessary because sellers must handle weekend fulfillment on at least one weekend day, and weekend page views return to scoring after October 17. Amazon also expects weekend shipping capability and carrier support for weekend delivery, but only one weekend day of seller operation is required. Staffing cannot eliminate distance, unavailable Sunday delivery, or carrier-service gaps. It is not a substitute for network coverage.
Will Shipping Settings Automation or ZIP-Code Inputs Solve the Problem?
Accurate settings in Seller Central can improve customer-facing promises. Amazon’s planned ZIP-level inputs should add precision for shipping times, weekend availability, and cutoffs, while accurate Prime shipping templates and supported shipping services can improve displayed promises without changing physical inventory placement. Software can correct assumptions; it cannot move inventory closer or create an unavailable carrier service, even when settings, tracking, and service availability involve Amazon integrated carriers.
Will Multiple Warehouses Improve SFP Coverage?
No. A second warehouse helps only when it is part of a broader multiple warehouses strategy that improves real delivery coverage; its location, assigned SKUs, inventory depth, operating schedule, carrier pickups, and coverage still have to match actual demand. A poorly placed or poorly stocked node may add cost and complexity without materially increasing one-day page views.
The better question is which eligible page views each stocked location can support when shoppers are browsing. Using 3PLs can sometimes lower shipping costs through volume discounts and provide multiple warehouse locations for faster delivery, but only when those nodes are properly placed and stocked. A hybrid model can preserve the merchant’s own warehouse while adding only the coverage it lacks. Some merchants use order fulfillment services designed specifically for ecommerce companies to achieve this balance. Cahoot’s Seller Fulfilled Prime operating-model guide explains how seller-owned and partner nodes can operate as one network.
When Does Distributed Fulfillment Become More Sustainable Than Routine Air Shipping?
Distributed fulfillment becomes more sustainable when shorter ground zones replace enough routine air to justify the added inventory and operating complexity. The goal is to make air the exception, using a peer-to-peer order fulfillment network that outperforms traditional 3PL models to handle most shipments by ground.
In a separate five-location Cahoot assessment, average ground shipping cost approximately $18, while air exceptions ranged from approximately $23 to $47 and represented approximately 2% of shipments. These rounded observations are not benchmarks or guarantees. They show the intended pattern: ground carries the program while air protects exceptions, which can also ease fulfillment fees pressure versus overusing premium air, depending on the model.
That changes the operating question. Instead of asking whether a carrier can fly almost every distant package overnight, the merchant can ask:
• Where do eligible Prime page views and orders originate?
• Which SKUs generate those views, and where is their inventory?
• Which locations extend the usable cutoff across time zones?
• Which carriers actually support the required destination and delivery day?
• What air spend remains after the best ground-routing options are exhausted?
The right network follows demand, delivery regions, and Amazon’s customer-facing promises. It does not begin with an arbitrary warehouse count.
Methodology note: Merchant details are based on 2026 Cahoot fulfillment assessments. The companies have been anonymized, and order volume and shipping costs have been rounded. Delivery promises and costs vary by inventory position, package, destination, operating schedule, cutoff, carrier service, and Amazon configuration.
What Decision Does a Single-Node SFP Merchant Face?
A single-node merchant approaching the cutoff ceiling generally has three strategic paths:
- Move eligible inventory into FBA and accept less operational control.
- Continue single-node SFP, absorb premium-air costs, and remain exposed to cutoff-driven page-view gaps.
- Add strategically located fulfillment capacity designed around Amazon’s actual customer-facing delivery promises, which can help sellers offer Prime shipping benefits while still using their own facilities.
None is universally correct. FBA may suit some SKUs; single-node SFP may remain viable for regional demand or high-margin products. Distributed SFP becomes compelling when the merchant wants control but needs inventory closer to national demand, and the Seller Fulfilled Prime program can help them maintain Prime eligibility and keep Prime branding visible without moving all inventory into FBA.
Cahoot supports that third path as an end-to-end ecommerce fulfillment operations suite—not merely a collection of warehouses. It can coordinate the merchant’s facility and added capacity through marketplace-aware routing, weekend operations, carrier selection, Amazon Buy Shipping integration, and Seller Fulfilled Prime performance monitoring, powered by ecommerce fulfillment software built for multi-node routing and cost optimization. The network still must fit actual SKUs, demand, and economics.
What Should an SFP Merchant Evaluate Next?
The right next step depends on whether the seller is preparing, diagnosing, or expanding, or evaluating Merchant Fulfilled Prime as a flexible alternative to FBA:
• Preparing for a first trial: Use the SFP Trial Readiness Checklist to test cutoff readiness, weekend execution, carrier pickup schedules, inventory availability, and premium-shipping exposure before the trial begins.
• Recovering from a failed trial: Diagnose the displayed promise—not only shipped orders. Review handling-time feeds, shipping templates, SKU assignment, after-cutoff traffic, and inventory by location using Cahoot’s failed-trial framework linked earlier.
• Evaluating outside fulfillment: Compare providers using the operational criteria in Cahoot’s Seller Fulfilled Prime 3PL shortlist, including verified SFP experience, trial support, weekend operations, Amazon Buy Shipping, carrier contingencies, and multi-node routing, as well as robust order-fulfillment integrations with major ecommerce and carrier platforms. For sellers aiming to scale SFP, compare providers specifically on weekend service, trial support, and multi-node execution.
Before adding capacity, model page-view coverage, order geography, inventory by SKU, cutoff exposure, ground-versus-air mix, and each node’s realistic promises, especially before major sales events. A warehouse address alone proves nothing.
Frequently Asked Questions
What Is Amazon’s 40% One-Day SFP Requirement?
For standard-size Seller Fulfilled Prime offers, at least 40% of eligible Prime customer page views must show a delivery date within one calendar day. The threshold took effect July 6, 2026. Amazon evaluates the promise displayed during qualifying page views, so the metric is not the same as the percentage of completed orders shipped by Next Day Air; it sits within the broader program and applies to Seller Fulfilled Prime items carrying the Prime badge for Prime members.
What Is the Minimum Seller Fulfilled Prime Cutoff Time?
Amazon says weekday SFP order cutoffs cannot be earlier than 2:00 PM local time and must be at least 30 minutes before carrier pickup. If you operate Prime on weekends, the minimum weekend cutoff is 10:30 a.m. local time or later. Sellers can configure a later cutoff when their warehouse and carrier schedule support it. A later cutoff can improve delivery-speed coverage, but it increases operational pressure and cannot eliminate national time-zone differences, and it also has to align with the carrier’s weekend pickup schedule when weekend service is enabled.
Does Next Day Air Count as One-Day Delivery for SFP?
Next Day Air can support a one-day promise when an order is received, fulfilled, and tendered before cutoff. If the page view occurs after cutoff, the package may not tender until the following day. Next Day Air then delivers one day after tender, which can still be two calendar days after the original page view.
Why Can an East Coast SFP Seller Lose West Coast One-Day Page Views?
An East Coast warehouse reaches cutoff three hours earlier from a West Coast shopper’s perspective. A 4:30 PM ET cutoff is only 1:30 PM PT. West Coast customers browsing later in the afternoon may see a promise that includes next-day handling, even when the seller is willing to use premium air.
Are Weekends Currently Included in Amazon SFP Speed Metrics?
As of August 28, 2026, Amazon is temporarily excluding weekend page views from SFP speed evaluation through October 17, 2026. Sellers must still ship orders for Prime customers on their required weekend schedule, and the 40% standard-size one-day requirement is already active for evaluated page views. Sellers should recheck Amazon’s requirements after the temporary exclusion ends, as Amazon can suspend Prime privileges if weekend requirements are not maintained once scored operations resume.
How Many Warehouses Are Needed for Seller Fulfilled Prime?
There is no universal number. The required network depends on demand geography, page-view timing, eligible SKUs, inventory placement, operating schedules, cutoff times, carriers, package characteristics, and Amazon configuration. Sellers should model the incremental coverage of each location rather than assume that any fixed warehouse count guarantees compliance.
When the Remaining SFP Gap Is Geographic
A merchant operating until 4:30 PM ET and paying for Next Day Air has not failed to work hard enough. The merchant may have reached the limit of what additional warehouse time and faster transportation can accomplish from one origin.
Amazon’s 40% requirement reduced how long one warehouse can remain visible as “one-day” nationally. Once the remaining gap is geographic, the solution must be evaluated geographically. Repeated Prime performance failures can also lead to permanent loss of the Prime badge, not just temporary setbacks.
Cahoot can analyze SFP page-view coverage, order geography, cutoff exposure, inventory placement, and ground-versus-air mix to assess whether additional locations could improve coverage and economics, including by enrolling suitable operators in its Cahoot Fulfillment Partner Program. Learn more about Cahoot’s Seller Fulfilled Prime fulfillment network and request an SFP Coverage and Shipping-Cost Analysis.
Written By:
Manish Chowdhary
Manish Chowdhary is the founder and CEO of Cahoot, the most comprehensive post-purchase suite for ecommerce brands. A serial entrepreneur and industry thought leader, Manish has decades of experience building technologies that simplify ecommerce logistics—from order fulfillment to returns. His insights help brands stay ahead of market shifts and operational challenges.
Turn Returns Into New Revenue
Related Articles
Walmart Officially Allows Amazon Multi-Channel Fulfillment (MCF)
Big news for multichannel sellers: Walmart now officially allows Amazon Multi-Channel Fulfillment (MCF), Amazon’s service for using its fulfillment network to ship orders from mult...
Why More Automation Didn’t Lower Return Costs
Returns automation does improve returns operations: it cuts manual touches, smooths intake, speeds sorting, and makes workflow execution more consistent.
Shopify Subscription Payment Change: Why It Could Hurt Reactivation
Shopify changed how subscription payment information is handled at cancellation.
DSCO Fulfillment Explained: What Sellers Still Get Wrong
In this article
15 minutes
- What DSCO actually does vs what it does not do
- Why sellers confuse EDI compliance with fulfillment readiness
- Order Fulfillment Strategies
- Retailers that rely heavily on DSCO
- Cancellation and late-shipment penalties tied to DSCO metrics
- Real operational examples sellers underestimate
- The role of 3PLs in DSCO success
- What “DSCO readiness” actually looks like in practice
- Strategic takeaway for operations leaders
- Frequently Asked Questions
DSCO fulfillment is the order-communication layer in a retailer drop ship program: it standardizes how retailers and suppliers exchange orders, inventory, shipment confirmations, and tracking, but it does not do the physical fulfillment work of picking, packing, or shipping. For sellers, ecommerce operators, fulfillment managers, and operations leaders onboarding to retailer drop shipping, the most common failure mode is treating EDI compliance as the finish line instead of the starting gun.
DSCO can standardize retailer communication, but it cannot make your warehouse hit SLAs. That distinction is where strong EDI still loses to weak execution. DSCO is valuable because it creates a common language between retailers and suppliers, so a retailer can scale drop ship without custom one-off connections for every brand. That standardization is real. DSCO’s features, such as real-time validations and robust data standardization, further enhance order fulfillment efficiency and accuracy. It is also the reason the operational gaps show up so fast: once DSCO orders start flowing, retailers judge you on what customers actually experience: ship speed, cancellation rate, tracking reliability, and whether returns and post-purchase support work cleanly.
DSCO provides 100% data standardization with over 70 real-time validations to ensure inventory, product, and shipping data accuracy.
This guide explains what DSCO does and does not do, why EDI compliance is not the same as fulfillment readiness, where operations break under retailer expectations, how 3PL and in-house fulfillment strategies affect performance, and what teams need to put in place to become operationally DSCO-ready. The hard truth is simple: sellers fail DSCO programs when their warehouse operations cannot meet retailer SLAs, not because of EDI issues, and confusing those two can lead to chargebacks, missed scorecards, and lost retail program eligibility.
What DSCO actually does vs what it does not do
DSCO sits in the “communication and compliance” layer of drop shipping. It helps retailers and suppliers manage the entire process of order processing across channels without relying on manual email threads and spreadsheets. In practice, dsco order fulfillment typically includes:
- Receiving sales orders from retail channels in a standardized format
- Passing updates back to the retailer on acknowledgments, cancellations, shipments, and tracking
- Synchronizing inventory levels so a retailer site can decide what to sell
- Supporting consistent status events that feed vendor scorecards and customer service workflows
The integration manager feature of DSCO allows users to track inventory levels and order status in real-time.
That is what DSCO does.
What DSCO does not do is what most sellers secretly need it to do:
- It does not pick, pack, and ship orders
- It does not control your fulfillment centers, labor planning, or cutoffs
- It does not prevent inventory mismatch between your systems and what is physically on the shelf
- It does not force a carrier scan to happen on time
- It does not protect you from shipping costs caused by poor cartonization or service level mistakes
- It does not fix reverse logistics or improve your returns disposition process
DSCO can streamline the connection and make data flow faster. It cannot make execution better. If your warehouse can only ship in two to three business days, DSCO will not change that. If your inventory accuracy is weak, DSCO will not magically reconcile it. DSCO is a mirror. It reflects your operation back to the retailer with timestamps.
Efficient logistics integration with DSCO ensures that product data, order fulfillment, and inventory levels are accurately synchronized across all sales channels.
Why sellers confuse EDI compliance with fulfillment readiness
This is the single most common operational misunderstanding in dsco fulfillment.
Sellers spend weeks or months getting certified, validating test transactions, and proving the connection works. The integration feels like the “hard part” because it involves outside teams, project plans, and unfamiliar concepts. Once the platform connection is live, everyone wants to believe the account is ready to scale.
But EDI compliance is about message correctness. Fulfillment readiness is about outcome reliability. Efficiently and reliably fulfilling orders is critical for successful dsco fulfillment, as it ensures customer satisfaction and supports business growth.
You can be perfectly compliant and still fail a drop shipping program in your first week if:
- You acknowledge orders on time but ship late
- You send inventory feeds on schedule but oversell due to bad counts. Real-time inventory synchronization is essential for DSCO users to avoid overselling products.
- You generate labels quickly but miss carrier pickup windows
- You provide tracking numbers that do not scan for 24 hours
- You ship partials or substitute SKUs to “save the sale” and trigger chargebacks
Retailers do not grade you on how clean your integration looks. They grade you on the DSCO metrics tied to customer experience: ship on time, ship complete, ship accurately, and keep cancellations low. DSCO makes these metrics measurable, not negotiable.
Order Fulfillment Strategies
Order fulfillment is the backbone of any successful ecommerce business. In the world of DSCO order fulfillment, the right strategy can mean the difference between scalable growth and operational headaches. For ecommerce stores, the challenge isn’t just about getting products out the door—it’s about doing so cost effectively, with real-time tracking, and without hidden fees eating into your margins.
One of the most impactful moves is partnering with a third party logistics (3PL) provider. Companies like LMS Logistics Solutions have demonstrated that leveraging a comprehensive suite of fulfillment services—such as those offered by 3PL Central—can drive efficiency and accuracy. With inventory integrations that automatically update inventory levels and real-time tracking numbers, businesses can maintain near-perfect inventory accuracy and keep customers informed every step of the way.
When evaluating a fulfillment partner, look beyond the upfront cost. Scrutinize for hidden fees, reverse logistics capabilities, and the ability to scale with your business. Cost savings aren’t just about the cheapest rate—they’re about the total cost of ownership, including support, integration, and the flexibility to adjust as your operations grow. Solutions like Extensiv’s DSCO integration offer step integration specific instructions, making it easier to connect your ecommerce order sources, manage inventory, and streamline the entire process from order to delivery.
Drop shipping is another strategy that can help ecommerce businesses expand their assortment without the burden of holding inventory. By working closely with suppliers and retailers, you can fulfill orders directly from the source, reducing shipping costs and allowing your business to focus on sales and growth. This model is especially useful for businesses with limited storage or those looking to test new products without a large upfront investment.
Shipping labels and tracking numbers play a pivotal role in customer satisfaction. Providing real-time tracking and clear communication builds trust and reduces customer service overhead. Whether you’re using your own fulfillment centers, a 3PL, or leveraging Amazon FBA to tap into Amazon’s distribution network, the ability to offer reliable shipping and tracking is non-negotiable.
Distribution strategy matters, too. By creating a network of fulfillment centers—either through your own operations or with a 3PL—you can reach customers faster and more cost effectively, no matter where they are. This is especially important for high-volume products or when serving a wide geographic area.
Ultimately, the most successful ecommerce businesses treat fulfillment as a core competency, not an afterthought. They work closely with their fulfillment partners, suppliers, and retailers to ensure seamless integration and communication. They commit to going the extra mile for customers, providing real-time support, and adjusting their processes as the business scales.
In summary, order fulfillment strategies are not one-size-fits-all. Whether you’re leveraging DSCO integrations, drop shipping, 3PLs, or Amazon FBA, the key is to build a flexible, cost-effective operation that prioritizes customer experience. By focusing on the right partnerships, technology, and processes, your ecommerce store can fulfill orders efficiently, support growth, and stay ahead in a competitive market.
Retailers that rely heavily on DSCO
You do not need a long list to understand the implication, but it helps to name the pattern.
Several large retail programs use DSCO or DSCO-connected infrastructure to run drop ship at scale, particularly in categories like apparel, footwear, accessories, home, and specialty retail. DSCO also supports e-commerce and digital sales channels, enabling smooth management and fulfillment of online orders. You will often see DSCO in the background for retailers that run high-SKU catalogs and rely on brands to fulfill orders directly to consumers under tight standards. Integration with various e-commerce order sources allows for streamlined fulfillment and efficient inventory tracking. The operational theme is consistent across these programs: the retailer owns the customer experience, and you are expected to execute like a first-party warehouse.
DSCO connects to over 60 order destinations, including major retailers like Nordstrom and Kohl’s, simplifying data exchange.
If your team is used to marketplace fulfillment or slower B2B shipping cadences, DSCO-based drop shipping can feel unforgiving. That is because it is.
Cancellation and late-shipment penalties tied to DSCO metrics
DSCO is often described as “communication standardization,” but the commercial teeth are in the scorecard.
Retailers use DSCO metrics to calculate:
- Cancellation rate
- Late shipment rate
- On-time carrier scan adherence
- Tracking timeliness and validity
- Sometimes, defect proxies like returns, customer contacts, or delivery exceptions
When you miss, the consequences are usually economic before they are relational.
Common penalty mechanisms include:
- Per-order chargebacks for late shipments or cancellations
- Fee schedules tied to repeat SLA misses
- Removal from drop ship eligibility after sustained underperformance
- Reduced assortment visibility or limited product eligibility for high intent shoppers
Transparent pricing models are crucial in dsco fulfillment, as they help eCommerce businesses clearly understand the cost structures and avoid unexpected or hidden fees.
This is why dsco fulfillment problems rarely show up as an “EDI error.” They show up as margin erosion. A program can look profitable on paper until you layer in hidden fees from late shipments, expedited shipping used to recover SLAs, and cancellations that create customer service overhead.
DSCO validates supplier invoices for accuracy before routing them to retailers for payment, helping ensure financial accuracy and cost control.
The operational lesson is not “avoid penalties.” It is to understand that DSCO makes your fulfillment performance legible to the retailer. If your operation is not already built to hit strict shipping and accuracy targets, the fees are a symptom, not the disease.
Real operational examples sellers underestimate
Most DSCO failures are boring. They are also expensive. These are the patterns that repeatedly sink accounts. To avoid these common DSCO fulfillment failures, it is essential to integrate systems and processes between your e-commerce platform and third-party logistics providers, ensuring seamless data synchronization and operational efficiency.
Integrating DSCO with third-party logistics services helps to save time and money.
Late ship caused by warehouse reality, not system timing
A DSCO order arrives at 2:10 PM. Your warehouse cut-off for same-day picking is 1:00 PM. Your team treats the order like any other ecommerce order and plans to pick it tomorrow.
From the retailer’s perspective, that order is already aging. If the program expects shipment within 24 hours, you are now living inside a clock you did not design. Your integration might be flawless, but you are operationally late before anyone touches a box.
This is why operations leaders should treat dsco orders as a distinct order class with its own routing rules, labor priority, and exception escalation.
Inventory mismatch that turns into cancellations
Your inventory integration sends 42 units available. The warehouse actually has 19, because:
- Cycle counts are infrequent
- Damaged inventory is not quarantined properly
- Returns are not reconciled quickly
- Multiple order sources are drawing from the same pool without real time locking
The retailer sells 10 units. You can ship 8. You cancel 2.
That might feel like “normal ecommerce.” In a DSCO program, it is a scorecard hit. Repeat it often enough and you look unreliable. Retailers care about cancellation rate because cancellations are customer pain and customer service cost. DSCO simply makes that pain attributable.
Carrier scans that do not happen when you think they do
A seller prints labels and sends tracking in time. The packages sit on the dock until the carrier arrives the next morning. Tracking shows “label created” but no acceptance scan.
Some retailers treat the first carrier scan as the real shipment event. Your DSCO status says shipped, but the carrier data says not yet. This gap can trigger late shipment flags even when your team believes they complied.
Operationally, this is solved by pickup discipline, dock processes, and cutoffs aligned to scan reality. “Label printed” is not “shipped” in retailer math.
Wrong service level or routing details that create downstream cost
Retailer drop ship programs often specify service levels, label formats, and packing requirements. Sellers sometimes treat these as administrative details, then discover the penalties later.
A common example is selecting a shipping method that is too slow to meet delivery expectations, then paying to upgrade shipments reactively. Another is failing to include the required packing slip or return label, triggering customer contacts and chargebacks.
None of this is fixed by DSCO. DSCO will happily transmit the shipment confirmation for a shipment that will arrive late.
The role of 3PLs in DSCO success
For brands onboarding to drop shipping, the 3PL question is not about convenience. It is about capability. Strategic partnerships and tailored services for clients are essential in DSCO fulfillment, as ongoing communication and understanding each client’s unique needs foster trust and deliver value.
A strong third party logistics partner can make dsco fulfillment viable because they already operate at the tempo retailers expect. Choosing a 3PL for DSCO orders requires evaluating their industry experience and technological capabilities. The right partner can help with:
- Cutoffs and labor models designed for rapid order processing
- Warehouse discipline around scan compliance and dock flow
- Inventory accuracy through tighter cycle counting and location control
- Standard operating procedures for pack rules, labels, and routing requirements
- Exception handling when a carrier misses pickup or an order needs intervention
A reliable 3PL should also offer modern integration technology to ensure efficient order fulfillment.
This does not mean “use a 3PL and you are safe.” Retailers hold the seller accountable, not the warehouse vendor. If your 3PL misses SLAs, your account takes the hit. The practical implication is that DSCO success requires operational governance regardless of who runs the building.
Operations leaders should treat the 3PL relationship like a program, not a purchase order. You need:
- Shared SLA definitions that match retailer requirements
- Daily visibility into backlog, late risk, and cancellation drivers
- A process for inventory reconciliation and dispute resolution
- Escalation paths for carrier issues and peak volume planning
Flexibility in scaling services is also important when selecting a 3PL for DSCO orders.
If you are running your own warehouse, the same governance still applies. The only difference is who you can fire.
What “DSCO readiness” actually looks like in practice
Most sellers think readiness means the connection is stable. Retailers think readiness means the order experience is stable.
DSCO readiness in operations terms looks like:
- Warehouse cutoffs aligned to retailer ship windows
- Order processing that prioritizes DSCO orders without starving other channels
- Inventory levels that reflect reality, not accounting optimism
- Tracking that scans fast and stays valid through delivery
- Clear playbooks for exceptions: backorders, damages, carrier misses, address issues
- Reverse logistics that does not collapse customer confidence
Notice what is not on that list. It is not a step integration specific instructions document. It is not a deep dive into EDI schemas. The challenge is execution.
This is also why sellers get surprised by DSCO. DSCO makes it easy to start. It does not make it easy to be good.
Strategic takeaway for operations leaders
If you want one mental model for dsco fulfillment, use this:
DSCO standardizes communication. Retailers evaluate execution.
Treat DSCO like a spotlight, not a shield. It will highlight where your operation is strong and where it is fragile. If you are fragile, you will see it first through cancellation and late shipment penalties, then through lowered assortment access, then through program risk.
The correct posture is not to obsess over the integration. It is to build a fulfillment operation that can meet retailer SLAs consistently, even during peak demand, even when a carrier misses a scan, even when inventory is tight. That is what retailers are buying from you when they approve you for drop shipping.
Frequently Asked Questions
What is DSCO fulfillment?
DSCO fulfillment refers to operating a retailer drop ship program where DSCO standardizes order, inventory, and shipment communications, while the seller still performs the physical fulfillment work.
What does DSCO do in drop shipping?
DSCO standardizes retailer and supplier communication for orders, inventory updates, shipment confirmations, and tracking so retailers can scale drop ship programs without custom integrations.
What does DSCO not do for sellers?
DSCO does not execute fulfillment. It does not pick, pack, ship, manage carrier pickups, correct inventory accuracy, or ensure you meet retailer SLAs.
Why do sellers fail DSCO programs even when EDI is working?
They confuse EDI compliance with fulfillment readiness. Retailers score performance based on cancellations, late shipments, and tracking quality, which are operational outcomes.
What DSCO metrics typically trigger penalties?
Retailers commonly penalize high cancellation rates, late shipment rates, missing or delayed tracking, and shipment events that do not meet required timing thresholds.
How do carrier scans impact DSCO performance?
Many retailers treat the first carrier acceptance scan as the proof of shipment timing. A label can be created and tracking sent, but if the package is not scanned promptly, it can still count as late.
How can a 3PL help with DSCO success?
A capable 3PL can improve ship speed, inventory accuracy, scan discipline, and exception handling. The seller must still govern the partnership to meet retailer SLAs.
What operational changes matter most for DSCO readiness?
Tight cutoffs, prioritized order processing, accurate inventory levels, consistent carrier pickups, reliable tracking, and strong exception handling matter more than integration effort.
Written By:
Indy Pereira
Indy Pereira helps ecommerce brands optimize their shipping and fulfillment with Cahoot’s technology. With a background in both sales and people operations, she bridges customer needs with strategic solutions that drive growth. Indy works closely with merchants every day and brings real-world insight into what makes logistics efficient and scalable.
Turn Returns Into New Revenue
Related Articles
Walmart Officially Allows Amazon Multi-Channel Fulfillment (MCF)
Big news for multichannel sellers: Walmart now officially allows Amazon Multi-Channel Fulfillment (MCF), Amazon’s service for using its fulfillment network to ship orders from mult...
Why Small Ecommerce Brands Are Winning with AI (While Enterprises Struggle)
Conventional wisdom says large companies should dominate AI adoption.
Top 12 Shipping Strategies For Making Free Shipping Profitable
For ecommerce sellers, shipping is more than just getting a package from point A to point B — it’s the invisible backbone, quietly shaping customer satisfaction, operational costs,...