What is DHL eCommerce and Why It’s Important for Online Sellers
In this article
 14 minutes
- Key Takeaways
- DHL eCommerce and DHL Parcel: An Overview
- Affordable Shipping Solutions and Shipping Labels
- Domestic Shipping Services
- International Shipping Options
- Hybrid Delivery Model as a Delivery Service Provider
- Integration with Ecommerce Platforms
- Real-Time Tracking and Transparency
- Operational Pitfalls
- What They Don’t Tell You: Hidden Costs in DHL’s Latest Rate Hike
- Customs and Trade Considerations
- Sustainability Initiatives
- Checklist for Sellers
- Summary
- Frequently Asked Questions
DHL eCommerce provides shipping solutions for online businesses worldwide. Learn about its services, benefits, and how it can improve your shipping process.
Key Takeaways
- DHL eCommerce offers affordable and scalable shipping solutions, making it suitable for businesses of all sizes, with no minimum volume requirements.
- The company provides fast domestic shipping options, with services like Expedited Max averaging delivery in just 2 – 3 days.
- Commitment to sustainability is a key focus for DHL eCommerce, as they aim for net-zero emissions by 2050 through their GoGreen program.
Slash Your Fulfillment Costs by Up to 30%
Cut shipping expenses by 30% and boost profit with Cahoot's AI-optimized fulfillment services and modern tech —no overheads and no humans required!
I'm Interested in Saving Time and MoneyDHL eCommerce and DHL Parcel: An Overview
DHL eCommerce is a division of Deutsche Post DHL Group, specializing in domestic and international shipping solutions for e-commerce merchants around the world. With operations in over 220 countries and territories, DHL eCommerce shipments provide extensive global reach across the globe, making it a reliable partner for businesses looking to expand their market presence.
The company employs over 45,000 specialists focused on ecommerce logistics, ensuring that your shipments are handled by experienced professionals. DHL eCommerce offers services for ecommerce businesses, marketplaces, and B2B shippers, with larger companies able to open a business account to streamline shipping operations, helping them manage their logistics effectively as a logistics company. This makes it an ideal choice for businesses of all sizes, from small startups to large enterprises, and helps companies simplify logistics as they grow.
Sustainability is also a key focus for DHL eCommerce, aligning with green logistics goals to promote environmentally friendly practices. Partnering with DHL eCommerce allows businesses to grow and meet changing demands while contributing to a more sustainable future.
Slash Your Fulfillment Costs by Up to 30%
Cut shipping expenses by 30% and boost profit with Cahoot's AI-optimized fulfillment services and modern tech —no overheads and no humans required!
I'm Interested in Saving Time and MoneyAffordable Shipping Solutions and Shipping Labels
One of the standout features of DHL eCommerce is its affordability, particularly for international parcels. While rates vary based on size, weight, and service level, many ecommerce sellers report that DHL eCommerce often provides lower-cost options compared to USPS for similar cross-border shipments. For example, shipping a lightweight package from the U.S. to the UK can be significantly cheaper through DHL’s Parcel International Direct service compared to USPS Priority Mail International. This price advantage makes DHL eCommerce a compelling choice for businesses seeking cost-effective international delivery without compromising global reach.
DHL eCommerce offers:
- Scalable pricing models that adjust based on order volume, allowing businesses to save on costs as more shipments are processed.
- No minimum volume requirements, making DHL accessible for businesses of varying sizes. But note that ultra-low tier pricing is only available to high-volume shippers (e.g., 1,500+ packages per month).
- A transparent pricing structure that factors in both weight and dimensions, ensuring that you know exactly what you’re paying for.
DHL eCommerce offers competitive pricing for lightweight packages by consolidating and pre-sorting shipments, reducing costs and simplifying the shipping process. With its global network and partnerships with various carriers, DHL eCommerce makes it easy for businesses to expand their reach and deliver packages efficiently—similar to how national fulfillment services with distributed warehouses reduce distance-to-customer and overall shipping spend.
For example, a Brooklyn-based apparel brand shipping lightweight t-shirts to customers in California saved nearly 35% on each DHL eCommerce shipment compared to USPS Ground Advantage. By using DHL’s scalable pricing and consolidating shipments during peak sale periods, they optimized both cost and delivery accuracy, while avoiding common USPS delays.
Domestic Shipping Services
DHL eCommerce offers a range of domestic shipping services to cater to different needs. One of the popular specific services is the Expedited Max service, which ensures faster deliveries with an average postal time of just 2 – 3 days. The Ground shipping service averages 3 – 8 days for delivery, suitable for less time-sensitive shipments.
Another notable service is the SmartMail Parcel, designed for packages weighing up to 25 lbs. This service allows for a maximum shipment value protection of up to $100, providing peace of mind for valuable items.
DHL eCommerce delivery times can range from 2 to 8 business days for domestic shipments within the United States, making it a versatile option for various shipping needs. These options allow businesses to tailor their shipping strategies to meet customer expectations and ensure timely deliveries, whether expedited or more cost-effective ground shipping is needed.
A popular DTC skincare brand uses Expedited Max for its starter kits under 1 lb—ensuring delivery in 2 – 3 days—while heavier bottles are shipped via Ground to keep shipping costs down. This dual strategy lets them meet shopper expectations on speed while preserving margin.
International Shipping Options
DHL ecommerce services comparison table.

DHL eCommerce provides robust international shipping solutions for businesses aiming to expand globally, but brands also need ecommerce fulfillment software for smart inventory placement and rate shopping to fully capitalize on these options. The DHL Parcel International Direct service offers:
- Coverage of 37 important ecommerce markets
- Shipping times range from 3 to 10 business days
- Options for duty paid in advance or upon delivery, simplifying the customs process for businesses
The Parcel International Standard service delivers to over 220 countries and territories, with transit times of 4 to 8 business days for Europe and Canada, and 8 to 14 days for the rest of the world. This service is ideal for businesses looking to reach a wider audience without breaking the bank.
For smaller parcels under 4.4 lbs, DHL Packet International offers a cost-effective solution with expected delivery times of 4 to 8 business days. These options enable businesses to select the most suitable service based on shipping needs and destination country, ensuring timely and efficient deliveries worldwide.
However, brands shipping to the UK or Canada should closely monitor customs documentation. One merchant selling tech accessories saw delays of up to 7 days due to missing HS codes on shipping labels, a preventable issue that impacted their ability to confirm delivery dates and caused complaints from international shoppers.

Looking for a New 3PL? Start with this Free RFP Template
Cut weeks off your selection process. Avoid pitfalls. Get the only 3PL RFP checklist built for ecommerce brands, absolutely free.
Get My Free 3PL RFPHybrid Delivery Model as a Delivery Service Provider
DHL eCommerce employs a hybrid delivery model that combines the strengths of DHL and USPS. In this model, DHL manages upstream logistics, including sorting and processing packages at distribution centers, then completes the transfer to USPS for final delivery.
This collaboration allows DHL eCommerce to offer economical shipping solutions while ensuring reliable last-mile service through USPS. However, reliance on USPS can lead to service variability across regions, which businesses should keep in mind when planning their shipping strategies.
For example, a Texas-based seller noticed consistent delays in rural New England ZIP codes when DHL hands off to USPS. To mitigate this, they adjusted cut-off times and proactively updated customers with tracking links and additional information during the USPS handoff period to manage expectations, a tactic that helped reduce customer service tickets by 18%. Others complement DHL with a peer-to-peer order fulfillment service that outperforms traditional 3PLs to maintain 1–2 day delivery in regions where USPS performance is inconsistent.
Integration with Ecommerce Platforms
DHL eCommerce seamlessly integrates with all major ecommerce platforms, making it easier for businesses to manage their shipping operations. Key features include:
- Marketplace sellers can link existing DHL eCommerce accounts to supported platforms for a streamlined shipping experience.
- Simplified parcel delivery and returns.
- Real-time rate retrieval for shipments, improving efficiency and accuracy in pricing.
The 1-call buys feature simplifies the shipping label purchase process by combining multiple actions into a single API request, accelerating operations and helping businesses grow. By connecting with platforms like Shopify, Pulse Commerce, and BigCommerce, DHL eCommerce ensures that businesses can manage their orders and shipments with ease, create shipments from connected platforms, and manage account settings within connected workflows. For Shopify brands in particular, pairing DHL with specialized Shopify fulfillment services can make it easier to offer fast, low-cost shipping nationwide. EasyPost integrates with DHL eCommerce for shipping label creation.
Real-Time Tracking and Transparency
Transparency is key in the shipping process, and DHL eCommerce excels in providing real-time tracking for shipments. Key features include:
- The Delivery Confirmation Service offers tracking from the sender to the recipient.
- Ensures visibility throughout the shipping journey, providing important details.
- Particularly beneficial for international shipments, where comprehensive tracking is crucial.
DHL eCommerce shipments can be tracked via dhl.com/tracking. Access requires a shipment ID.
DHL eCommerce utilizes advanced technologies and features to enhance shipment tracking.
- Uses GPS and RFID to provide accurate real-time updates on the location of shipments.
- Minimizes human error and enhances automation in tracking parcels.
- Sends proactive notifications to customers regarding any delays or issues during the shipping process, improving their overall experience.
With various tracking solutions, such as API and On-Demand Delivery options, DHL eCommerce caters to diverse business needs, ensuring that both merchants and consumers have access to reliable tracking information and shipment data that supports tracking visibility, especially when integrated with robust ecommerce fulfillment software and analytics.
Operational Pitfalls
While DHL eCommerce offers numerous benefits, there are also operational challenges to be aware of. Many sellers experience tracking delays, particularly during peak shipping seasons, which can lead to customer dissatisfaction. Inadequate communication with logistics partners and the shipper can exacerbate these issues, leading to unforeseen delays in order fulfillment.
Disruptions in supply chains can significantly impact shipping timelines for DHL eCommerce users. Additionally, certain SKUs, particularly those containing hazardous materials, cannot be shipped through DHL eCommerce, making compliance essential. Establishing clear guidelines for unacceptable shipment types is crucial for avoiding pitfalls and ensuring smooth operations, and some brands even join a fulfillment partner program to diversify where and how orders are shipped.
A seller in the supplements category learned this the hard way when a batch of shipments containing hemp-based products was flagged during transit. Despite full compliance on the origin country side, destination country regulations caused parcel returns and spam-level customer support volume. Lesson learned: Review restricted items by both carrier and country before you ship.
DHL eCommerce’s tracking updates depend on timely USPS tracking event updates, making it important for sellers to monitor these closely. By being proactive and aware of these potential challenges, businesses can gain valuable insights to better navigate the complexities of using DHL eCommerce for their shipping needs.
What They Don’t Tell You: Hidden Costs in DHL’s Latest Rate Hike
If you blinked, you might’ve missed it, but DHL quietly implemented another round of rate increases in July 2025. While smaller than the dramatic spike that took effect in January, these new rates still chip away at the cost advantage many merchants once counted on.
Let’s break it down.
In early 2024, DHL was one of the most affordable shipping options for lightweight parcels, especially in Zones 1 and 2. Fast forward to July 2025, and that edge is eroding. Rates for 1 – 5 oz parcels in Zones 1 & 2 have climbed significantly—often by $0.10 to $0.20 per package. That might sound negligible, but if you’re shipping 10,000 orders per month, that’s a $1,000–$2,000 hit to your bottom line.
What most merchants miss:
- Price creep is consistent across all weight breaks. The increases are small but relentless.
- The biggest relative jumps are at the lightest weights (1 – 3 oz), a core volume segment for ecommerce.
- Zone compression no longer delivers the savings it used to. Previously, you could count on Zones 1 & 2 to be reliably cheap. Now, even “local” deliveries are being repriced to match broader zone costs.
This isn’t just a DHL issue. It’s the downstream effect of new USPS pricing agreements that have reshaped how DHL and other consolidators structure their pricing tiers. In short: the margins are tighter, and their flexibility is fading.

Customs and Trade Considerations
International shipping involves navigating complex customs and trade regulations. DHL eCommerce provides options for customs clearance, letting businesses choose between prepaid or unpaid duties and clarifying duties-and-taxes payment responsibility, thus streamlining international shipping processes and avoiding unexpected costs. With Delivered Duty Paid and Delivered Duty Unpaid options, responsibility shifts based on how the shipment is delivered to the destination country.
Changes in U.S. tariffs do not apply to shipments that have already left their origin, and no current exemptions exist for small businesses regarding tariffs. This situation has created challenges for many businesses who are advised to explore existing trade agreements to obtain tariff impacts and stay informed about changing trade regulations to help their business grow.
Sustainability Initiatives

DHL eCommerce is committed to sustainability, as demonstrated by its GoGreen program. The company aims for net-zero emissions by 2050, encouraging employees to engage in climate protection initiatives. This collective effort emphasizes the importance of individual contributions to combat climate change.
The GoGreen program fosters a culture of environmentally friendly behavior within DHL and encourages customers to adopt sustainable practices. Choosing DHL eCommerce allows businesses to align with eco-friendly shipping solutions and contribute to a more sustainable future.
Scale Faster with the World’s First Peer-to-Peer Fulfillment Network
Tap into a nationwide network of high-performance partner warehouses — expand capacity, cut shipping costs, and reach customers 1–2 days faster.
Explore Fulfillment NetworkChecklist for Sellers
DHL can be a powerful ally, but only if you treat it as one part of your fulfillment toolkit, especially if you sell through marketplaces or your own online store. Hybrid delivery, tracking intelligence, and adaptive networks (like Cahoot) are how you thrive in 2025’s logistics landscape.
- Checklist: Before you go all-in on DHL…
- Know your SKU best fit (size/weight limits)
- Be GDPR & customs-ready for cross-border parcels
- Build tracking automation for 48-hour gaps in tracking updates
- Add a fulfillment backup plan for shipments >$800 (de minimis changes may lead to customs delays or rejections)
- Build sustainability/consumer transparency into shipping costs
- Visit DHL’s service pages or tracking resources before rollout to confirm requirements
By following this checklist, sellers can optimize their use of DHL eCommerce and ensure smooth operations. Before committing, many merchants also review order fulfillment service reviews from similar ecommerce brands and reach out directly to request a customized fulfillment quote and consultation.
Summary
In summary, DHL eCommerce offers a comprehensive suite of shipping solutions designed to meet the needs of ecommerce businesses. From affordable domestic and international shipping options to real-time tracking and sustainability initiatives, DHL eCommerce provides the tools necessary for businesses to thrive in the competitive online market.
Many merchants adopt a hybrid strategy, using DHL eCommerce for non-urgent items and maintaining parallel channels with a faster delivery service provider like DHL Express or UPS for high-ticket or time-sensitive orders. This hybrid approach keeps costs in check while meeting the diverse delivery expectations of today’s online shoppers, as seen in industry case studies and news about innovative fulfillment partnerships.
By leveraging these services, businesses can enhance their shipping processes, improve customer satisfaction, and contribute to a more sustainable future. Whether you’re a small startup or a large enterprise, DHL eCommerce has the solutions to help you succeed.
Frequently Asked Questions
What is the delivery time for DHL eCommerce domestic shipping services in the United States?
DHL eCommerce domestic shipments typically take 2 to 8 business days, depending on the specific shipping service selected. Options like Expedited Max average 2 – 3 days, while Ground shipping may take up to 8 days. Delivery timelines are influenced by package weight, destination location, and USPS’s last-mile performance.
How long does DHL eCommerce international shipping take for online shoppers sending packages abroad?
DHL eCommerce offers several international shipping services. For example, Parcel International Direct delivers to 37 countries in about 3 to 10 business days, while Parcel International Standard ships to over 220 countries in 4 to 14 days. Shipping times vary based on the destination country, service type, and customs clearance.
What is DHL eCommerce’s hybrid delivery model and how does it affect shipping performance?
The hybrid delivery model used by DHL eCommerce combines DHL’s global logistics infrastructure with USPS for domestic last-mile delivery. This allows ecommerce businesses to access affordable, reliable shipping while benefiting from USPS’s nationwide reach. However, tracking and delivery times may vary depending on USPS efficiency in the final delivery zone.
Does DHL eCommerce offer real-time tracking for shipments and delivery confirmation?
Yes, DHL eCommerce provides real-time shipment tracking through GPS and RFID technologies. Merchants and customers can track packages across every stage of the shipping process, from pickup to final delivery. The Delivery Confirmation service ensures visibility and enhances trust, especially for international ecommerce shipments.
What sustainability programs does DHL eCommerce offer for eco-conscious ecommerce businesses?
DHL eCommerce is committed to sustainable logistics through its GoGreen program, which aims for net-zero carbon emissions by 2050. The company invests in alternative fuels, electric vehicles, and climate protection initiatives, helping ecommerce merchants align their shipping operations with environmentally responsible practices.
Written By:

Jeremy Stewart
Jeremy Stewart leads customer success at Cahoot, helping merchants achieve high-performance logistics through smart technology and process optimization. With a background in both ecommerce operations and client services, Jeremy ensures that every merchant using Cahoot gets measurable results—whether they’re scaling from one warehouse to many or managing complex returns.
Turn Returns Into New Revenue
Related Articles

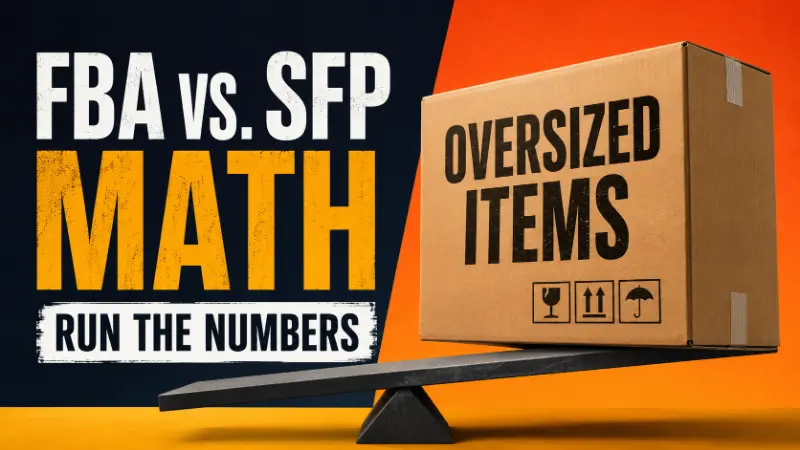
Seller Fulfilled Prime for Oversized Items: The FBA vs. SFP Math Sellers Need to Run
Seller Fulfilled Prime can work for oversized and bulky items, but it is not automatically cheaper than FBA.
How Businesses Ship So Cheap: The Reality Behind Commercial Shipping Rates
When small ecommerce merchants compare their shipping costs to what large brands appear to pay, the gap feels insurmountable.

Failed Your Seller Fulfilled Prime Trial? Fix the Root Cause Before You Retry
If you failed a Seller Fulfilled Prime trial, do not restart it until you know exactly which metric failed and what caused it.
Seller Fulfilled Prime for Oversized Items: The FBA vs. SFP Math Sellers Need to Run
In this article
23 minutes
- Why Oversized Items Look Like Obvious SFP Candidates
- The Carrier Caveat: SFP Costs Are Not Cheapest-Label Costs
- The Carton Matters More Than the Category
- Real Examples: FBA vs. Modeled Zone 5 SFP Fulfillment Cost
- What the Examples Reveal
- The SKU Where SFP Wins Is the One Sellers Should Study
- The SKUs Where FBA Wins Are Just as Important
- When Seller Fulfilled Prime Can Work for Oversized Items
- When FBA Is Still the Better Answer
- Five Questions to Ask Before Moving Bulky SKUs Into SFP
- The Real Takeaway: Oversized SFP Is SKU-Level Math
- Frequently Asked Questions
Seller Fulfilled Prime can work for oversized and bulky items, but it is not automatically cheaper than FBA. That is the mistake many sellers make when they look at high FBA fees, large cartons, or awkward products and assume they should move those SKUs into Seller Fulfilled Prime.
The real answer is more specific. Some oversized products are still cheaper in FBA. Some are close enough that the decision depends on margin, control, inventory strategy, or delivery speed. And some bulky SKUs become strong Seller Fulfilled Prime candidates because dimensional weight or extra-large FBA tiering pushes Amazon’s fulfillment fee high enough that seller-controlled fulfillment can win.
That means oversized Seller Fulfilled Prime is not a category-level strategy. It is SKU-level math.
To make that math concrete, this article compares real-world bulky product examples across Amazon’s Small Bulky, Large Bulky, and Extra-Large tiers. The examples use package dimensions, package weight, dimensional weight, modeled 2026 FBA fulfillment fees, and a modeled average Zone 5 Seller Fulfilled Prime fulfillment cost using SFP-appropriate parcel services.
The goal is not to prove that SFP always beats FBA. It does not. The goal is to show when oversized items deserve a closer look and when FBA may still be the better fulfillment option.
Why Oversized Items Look Like Obvious SFP Candidates
Oversized items often look like natural Seller Fulfilled Prime candidates for a simple reason: FBA fees can feel painful.
A bulky SKU may take up more storage space, require a larger carton, have higher fulfillment fees, and create more operational friction inside Amazon’s network. Sellers looking at those costs often wonder whether they could do better through their own warehouse, a 3PL, or a distributed fulfillment partner, and some look at Seller Fulfilled Prime for cost savings because it can avoid high FBA fees, preserve full control over inventory, and avoid FBA storage limits while keeping inventory storage in the seller’s hands.
That instinct is not wrong. It is just incomplete.
FBA fulfillment fees cover more than a shipping label. Amazon’s FBA model includes picking, packing, shipping, customer service, and returns handling, along with storage-related handling inside Amazon’s system, while sellers evaluating SFP are often trying to reduce fulfillment costs by 30 to 40% on the right SKUs. Amazon describes FBA as a program where sellers outsource fulfillment to Amazon and Amazon handles storage, packing, shipping, customer service, and returns for eligible orders. So if a seller compares an FBA fulfillment fee against only a parcel label, the comparison is already distorted.
For Seller Fulfilled Prime, the seller has to model the complete cost of fulfillment. That includes the parcel label, pick and pack, packaging, operating margin, delivery promise risk, and the cost of using carrier services that are reliable enough for Prime expectations.
That is where many oversized-item calculations change.
Let AI Optimize Your Shipping and Boost Profits
Cahoot.ai software selects the best shipping option for every order—saving you time and money automatically. No Human Required.
See AI in ActionThe Carrier Caveat: SFP Costs Are Not Cheapest-Label Costs
For ordinary merchant-fulfilled orders, sellers may be able to use a wider pool of lower-cost shipping methods. Depending on the SKU and delivery promise, that may include postal-heavy services, economy consolidators, DHL eCommerce, OSM, USPS-based options, or other discount services.
Seller Fulfilled Prime is different.
When a seller puts a SKU into SFP, the seller is responsible for shipping directly to customers, and the shipment has to protect the Prime delivery promise. For oversized and bulky items, that usually means relying on Amazon-approved shipping carriers that support Prime performance, rather than assuming the cheapest possible label is usable.
This matters because a seller may look at a bulky item and say, “I can ship that cheaper.” Maybe they can for a normal FBM order. But SFP is not just about getting the package delivered eventually. It is about protecting Amazon’s delivery-speed and on-time delivery expectations while preserving the Prime customer experience, often through Amazon Buy Shipping Services and related shipping services used to keep compliant Prime shipments on track.
That is why the SFP examples below use a modeled average Zone 5 fulfillment cost, not a cheapest-label estimate.
Important caveat: The modeled Zone 5 SFP fulfillment cost used in this article includes representative Zone 5 parcel label economics using SFP-appropriate carrier services, a pick/pack component, and an operating buffer. It is not a Cahoot rate card, not a quote, and not a guarantee. Actual costs vary by SKU, carton, destination zone, carrier agreement, residential/commercial mix, surcharges, packaging, fulfillment node, and delivery promise.
The Carton Matters More Than the Category
“Bulky” is not a precise fulfillment category. A product can look bulky in the customer’s home but ship in a compact carton. Another product can be lightweight but long enough to fall into an Extra-Large FBA tier. A third product can weigh far less than its billable shipping weight because dimensional weight drives the fee.
That is why oversized SFP decisions should start with the carton, not the product description.
The key inputs are:
- Package dimensions: length, width, and height of the shipping carton.
- Actual or package weight: the physical weight of the packaged item.
- Dimensional weight: the package cube converted into a billable weight.
- Billable shipping weight: the greater of actual weight or dimensional weight, rounded according to the applicable rule.
- FBA size tier: the Amazon tier that determines the fulfillment fee, based on Amazon’s size tier definitions, and accurate classification matters because oversized SKUs can lose Prime eligibility if they are assigned to the wrong tier.
- SFP-safe fulfillment cost: the complete cost to pick, pack, and ship the order using carrier services that can support the Prime promise.
If sellers misclassify oversized products against Amazon’s size tier definitions, Amazon can pause Prime eligibility or revoke Prime status for those seller fulfilled listings.
For the FBA side of the comparison, this article uses Amazon’s 2026 non-peak FBA fulfillment fee table for non-apparel products priced above $10. Amazon’s published 2026 table lists separate rates for Small Bulky, Large Bulky, and Extra-Large tiers, and Amazon states that the 2026 fee table does not include the separate 3.5% fuel and logistics-related surcharge that applies starting April 17, 2026.
For the SFP side, this article uses modeled average Zone 5 fulfillment costs because Zone 5 is a useful stress test. It is not the cheapest nearby shipment, and it is not the most extreme long-zone shipment. It gives sellers a more realistic view of whether the SKU has enough room to work outside FBA, especially in the context of rising FBA fees and the role of SFP in 2024.
ShipStation vs. Cahoot: 21x Faster, Real Results
Get the inside scoop on how a leading merchant switched from ShipStation to Cahoot—and what happened next. See it to believe it!
See the 21x DifferenceReal Examples: FBA vs. Modeled Zone 5 SFP Fulfillment Cost
The examples below use real-world package dimensions and weights to show how different bulky products behave. The point is not that these exact products should or should not go into SFP. The point is that items sellers casually describe as “oversized” can produce very different cost outcomes once the carton math is visible.
| Example product | Package dimensions | Actual / package weight | DIM weight | Billable weight | FBA size tier | FBA fulfillment fee with 3.5% surcharge | Modeled average Zone 5 SFP fulfillment cost | What the example shows |
| 30-inch folding storage ottoman | 30 × 15 × 2.5 in | 9 lb | 8.1 lb | 9 lb | Small Bulky | $10.96 | $21.41 | FBA is hard to beat when the product collapses into a compact carton. |
| 9-ft patio umbrella | 55 × 6.3 × 4.5 in | 11.18 lb | 11.2 lb | 12 lb | Large Bulky | $14.00 | $42.21 | A long and awkward item can still have a low FBA fee while being expensive to ship through SFP-safe parcel services. |
| 8 × 10 indoor/outdoor rug | 96 × 5.31 × 5.31 in | 15.23 lb | 19.5 lb | 20 lb | Extra-Large 0–50 lb | $34.72 | $42.21 | Extra-large by length does not automatically mean SFP is cheaper. |
| Narrow bathroom linen cabinet | 63.4 × 16.9 × 5.9 in | 59.5 lb | 45.5 lb | 60 lb | Extra-Large 50–70 lb | $45.61 | $55.00 | Actual weight pushes this SKU into a higher tier, but FBA may still win on pure fulfillment cost. |
| 42-inch metal dog crate starter kit | 44.09 × 29.53 × 8.27 in | 36 lb | 77.5 lb | 78 lb | Extra-Large 70–150 lb | $58.55 | $46.14 | DIM weight pushes FBA high enough that SFP can become meaningfully cheaper. |
| For oversized SFP, the standard is tied to prime customer page views and the delivery date shown for the customer’s location, not just whether the label was bought on time. |
Amazon also evaluates oversized and extra-large performance separately, including thresholds where at least 15% of Prime customer views must show a 1-day delivery date and 80% must show a 5-day delivery date for qualifying oversized offers.
This table is the heart of the oversized SFP decision. In this modeled set, Seller Fulfilled Prime does not clearly win on four of the five examples. That is not a weakness in the analysis. It is the lesson.
Oversized SFP is not a blanket savings strategy. It works when the SKU’s dimensions, weight, fulfillment network, carrier mix, and Prime delivery requirements create enough economic room. Without that room, FBA may still be the better option.
What the Examples Reveal
The folding storage ottoman is a good reminder that the customer’s perception of size is not the same as the shipping network’s perception of size. In the home, a 30-inch storage ottoman feels bulky. In fulfillment, it collapses into a 30 × 15 × 2.5 inch carton. That carton produces a Small Bulky FBA fee of about $10.96 after surcharge in this model. Once the seller has to use SFP-safe parcel services, add pick and pack, and include an operating buffer, the modeled Zone 5 SFP cost is much higher.
The patio umbrella shows a different problem. A 9-foot patio umbrella sounds like an oversized SKU, and its 55-inch package length makes it awkward to handle. But under the modeled FBA fee schedule, it still lands around $14.00 after surcharge. The SFP-safe Zone 5 modeled fulfillment cost is materially higher, and the delivery speed requirements have to be tailored to large items rather than borrowed from standard-size Prime shipping. The lesson is simple: long does not always mean expensive in FBA, but it can still be expensive to fulfill through a seller-controlled parcel network, especially because SFP requires strict adherence to delivery performance metrics for oversized items.
The 8 × 10 rug is more interesting because it crosses into Extra-Large because of length. At 96 inches long, the carton is clearly not a standard small-parcel item. But even there, SFP does not automatically win. The modeled FBA fee is $34.72 after surcharge, while the modeled Zone 5 SFP fulfillment cost is $42.21. Oversized items also face higher transit-damage risk, so SFP economics should account for freight claims, claims handling, and exception management. Extra-Large classification creates an opportunity to investigate SFP, not a guarantee that SFP is cheaper.
The narrow bathroom linen cabinet shows that actual weight can push an item into a higher Extra-Large tier. In this example, the dimensional weight is about 45.5 lb, but the actual package weight is 59.5 lb, so the billable weight is 60 lb. That creates an Extra-Large 50–70 lb FBA fee of $45.61 after surcharge. The modeled SFP cost is still higher, which means FBA may remain the better pure-cost option unless the seller has other strategic reasons to avoid FBA.
The dog crate starter kit is the SKU where the economics flip. The item weighs 36 lb, but the carton dimensions create a dimensional weight of about 77.5 lb, rounded to a 78 lb billable weight. That pushes the modeled FBA fulfillment fee to $58.55 after surcharge. In this case, the modeled Zone 5 SFP fulfillment cost is $46.14. That is where Seller Fulfilled Prime becomes interesting: not because the product is bulky in a generic sense, but because FBA’s dimensional-weight treatment creates a large enough cost gap for seller-controlled fulfillment to matter.
The SKU Where SFP Wins Is the One Sellers Should Study
The dog crate example is the most important row in the table because it shows the kind of oversized SKU where Seller Fulfilled Prime may create meaningful savings.
The product is not the heaviest item in the set. It weighs less than the linen cabinet. But the carton is large enough that dimensional weight, not actual weight, drives the billable shipping weight. That moves the SKU into the Extra-Large 70–150 lb FBA tier and pushes the FBA fee meaningfully higher.
That is the profile sellers should look for when evaluating oversized SFP candidates:
- The product is still parcel-shippable through SFP-safe services.
- The FBA fee is meaningfully inflated by dimensional weight or Extra-Large tiering.
- The seller can place inventory close enough to demand to avoid constant long-zone shipments, whether through own fulfillment in a warehouse they operate or a specialized national fulfillment services network for oversized shipments.
- The SKU has enough margin to absorb exceptions, particularly when sellers leverage peer-to-peer order fulfillment networks that can reduce parcel costs.
- The fulfillment operation can protect Prime delivery speed without frequent emergency upgrades, with strong inventory control across these SKUs.
That does not mean every dog crate, furniture panel, rug, or bulky home goods SKU belongs in Seller Fulfilled Prime. It means those SKUs deserve a serious SKU-level comparison before the seller assumes FBA is the only viable path.
The SKUs Where FBA Wins Are Just as Important
The most useful part of the table may be the rows where FBA wins.
That is because many sellers approach oversized fulfillment with the assumption that FBA must be overcharging them. Sometimes that is true. But sometimes Amazon’s fee is still a better deal than the seller can reproduce with SFP-safe parcel shipping, pick and pack, packaging, and operating margin.
This is especially true for Small Bulky and Large Bulky products where Amazon’s fee remains relatively low. A seller may have a product that looks awkward in the warehouse, takes up shelf space, or feels expensive compared with small standard-size items. But if Amazon can fulfill that product for $11 or $14, the seller-controlled SFP model has a very high bar to clear.
This is why high FBA fees should be treated as a signal, not a conclusion. A high fee should trigger investigation. It should not automatically trigger a fulfillment migration.
For a broader SKU-selection framework, sellers should also evaluate whether the item belongs in SFP at all. Some SKUs should stay out of Seller Fulfilled Prime because they cannot protect both the Prime promise and the seller’s margin. That includes products that are too large for normal parcel, too low-margin to absorb premium shipping, too low-volume to absorb delivery exceptions, or too demanding for the seller’s fulfillment network. See Cahoot’s guide to which SKUs should not be in Seller Fulfilled Prime for the broader exclusion framework.
When Seller Fulfilled Prime Can Work for Oversized Items
Seller Fulfilled Prime can work for oversized items when the product passes both the cost test and the operating test.
The cost test asks whether the complete SFP fulfillment cost is meaningfully lower than FBA after all relevant costs are included. That means sellers should compare FBA against the full SFP cost, not just the label. The SFP cost should include the parcel service, pick and pack, packaging, operating buffer, residential delivery exposure, dimensional weight, carrier surcharges, and the risk of faster-service upgrades.
The operating test asks whether the seller can actually deliver the product fast enough and reliably enough to protect the Prime promise. In amazon seller fulfilled prime, sellers fulfill Prime orders from their own facilities while meeting prime requirements for speed and reliability. That is how seller fulfilled prime work in practice: the seller keeps fulfillment control, but also takes on the responsibility of meeting Prime-level delivery expectations.
For oversized products, SFP is more likely to work when:
- The SKU is still compatible with normal parcel services such as UPS Ground, FedEx Ground, or FedEx Home Delivery.
- The FBA fee is materially higher than the complete modeled SFP fulfillment cost.
- The product has predictable packaging and low damage risk.
- The seller can place inventory close to demand instead of shipping every order across the country, often by using specialized Amazon SFP 3PL fulfillment services.
- The item has enough margin to absorb delivery exceptions and occasional premium shipping.
- The seller or fulfillment partner can support same-day processing, late cutoffs, and reliable carrier handoff, since weekend operations are generally required to protect prime shipping promises for oversized items.
That is where a distributed fulfillment partner can matter, because fulfillment operations are often the real reason network design matters. A single warehouse may be able to ship the item, but still fail the economics because too many orders travel too far. A stronger network can reduce long-zone exposure, protect delivery speed, and lower the need for expensive upgrades, especially when it doubles as an FBA alternative through merchant fulfilled Prime-style networks. Cahoot’s Seller Fulfilled Prime operating model guide explains why SFP success depends on more than finding a warehouse that says it can ship fast.
Cut Costs with the Smartest Shipping On the Market
Guranteed Savings on EVERY shipment with Cahoot's AI-powered rate shopping and humanless label generation. Even for your complex orders.
Cut Costs TodayWhen FBA Is Still the Better Answer
FBA is still the better answer for many oversized items. That is not a failure of SFP. It is a sign that the seller is doing the math correctly.
FBA may be better when Amazon’s bulky-item fee is still low relative to the seller’s complete fulfillment cost. The ottoman and patio umbrella examples show this clearly. Both products can be described as bulky or awkward, but the modeled FBA fees are low enough that SFP is difficult to justify on pure fulfillment cost.
FBA may also be better when the seller would need frequent long-zone shipments, premium services, or expensive parcel surcharges to hit the Prime promise. Oversized packages can be unforgiving because a small change in carton size can move the SKU into a different surcharge profile. Even if the base label looks reasonable, the final delivered cost may not be, and rising shipping costs can erase oversized SFP margins.
FBA may also be better when the item is too large for normal parcel shipping. For example, a product that exceeds common parcel length limits may no longer be a normal parcel fulfillment decision at all. It may require freight, LTL, special handling, or a limited carrier setup. In that case, the seller is not simply comparing FBA against SFP. The seller is comparing FBA against a freight-like operating model.
This is why oversized SFP should not be used as a blanket alternative to FBA. Some bulky SKUs belong in FBA. Some belong in standard FBM, where the seller keeps own inventory storage without Prime status. Some may require LTL or specialized fulfillment. And some are excellent SFP candidates. The work is knowing which is which.
Five Questions to Ask Before Moving Bulky SKUs Into SFP
Before moving oversized or bulky products into Seller Fulfilled Prime, sellers should pressure-test the SKU with five questions.
1. What is the actual FBA size tier and fee?
Do not estimate based on the product category. Use the package dimensions, package weight, dimensional weight, and Amazon’s current FBA fee schedule. A product that looks bulky may still be Small Bulky or Large Bulky. A lightweight product may become Extra-Large because of length. A moderate-weight item may become expensive because dimensional weight creates a higher billable weight.
2. What is the complete SFP fulfillment cost?
The SFP comparison should include more than the label, because sellers fulfill orders themselves and keep full control over inventory, packaging, and shipping. Add pick and pack, packaging, carrier surcharge exposure, operating margin, and the cost of using SFP-safe services. If the comparison only uses the cheapest possible shipping method, it is not a realistic comparison, which is the real math behind the seller fulfilled prime program for bulky items.
3. How much of demand can be served from nearby fulfillment nodes?
Zone mix matters. A dedicated prime shipping template or shipping template for oversized SKUs can help separate regional promises from standard items. A bulky item that works from a nearby warehouse may fail when too many orders ship across long zones. Sellers should evaluate where demand is coming from and whether inventory can be placed close enough to customers to protect both speed and cost, potentially using specialized Amazon FBM shipping and fulfillment services.
4. What happens when the order is not easy?
The average shipment is not the whole story. Sellers should model exceptions: longer zones, residential delivery, carrier surcharges, missed pickups, weekend orders, inventory imbalance, and orders that require faster service. A SKU that only works in the perfect scenario is not ready for SFP.
5. Can the operation protect Prime metrics?
Seller Fulfilled Prime is not just a cost model. It is a performance program. Sellers need the fulfillment process, inventory accuracy, cutoff discipline, carrier handoff, and tracking reliability to protect the Prime promise, including a 93.5% on-time delivery rate, cancellation rates of 0.5% or lower, and valid tracking rates of 99% as core performance metrics. These are reviewed weekly from Sunday to Saturday, not monthly, and missing them can put Prime offers at risk. Recent Amazon SFP guidelines effective October 2023 and the upcoming SFP and Premium Shipping requirement changes in June 2025 both raise the bar further. Cahoot’s Seller Fulfilled Prime trial checklist goes deeper on the readiness questions sellers should answer before entering or expanding SFP, especially given Amazon’s ongoing performance scrutiny and the strict operational discipline required to avoid penalties.
The Real Takeaway: Oversized SFP Is SKU-Level Math
The strongest lesson from the examples is that oversized items should not be accepted or rejected as a category.
A folding ottoman, patio umbrella, rug, linen cabinet, and dog crate can all be called bulky. But the fulfillment math points in different directions. The ottoman and umbrella are hard to beat in FBA. The rug and cabinet are closer, but still favor FBA in this model. The dog crate is where SFP becomes meaningfully attractive because dimensional weight pushes the FBA fee high enough for seller-controlled fulfillment to compete.
That is the decision pattern sellers should use. Start with the carton. Calculate dimensional weight. Identify the FBA tier. Model the complete SFP cost using SFP-safe carriers. Stress-test the Prime delivery promise. Then decide SKU by SKU.
Seller Fulfilled Prime can be a smart strategy for oversized and bulky items, but only when the math and the operation both work. The Prime badge is valuable because it signals fast, reliable delivery and can lift conversion rates by roughly 20 to 25%, but it does not fix bad unit economics. Prime members spend up to 3 times more than non-members, Prime products are more likely to win the Buy Box, and SFP listings can see over a 50% sales uplift after Prime eligibility. The best SFP candidates are the bulky SKUs where the seller can protect speed, preserve margin, and deliver reliably without turning every order into an exception.
Cahoot helps Amazon sellers evaluate Seller Fulfilled Prime readiness, model SKU-level fulfillment economics, and operate distributed fulfillment networks designed for fast, reliable delivery. But the first step is deciding which oversized SKUs actually belong in SFP. For bulky products, that decision starts with the carton, not the category.
Frequently Asked Questions
Is Seller Fulfilled Prime good for oversized items?
Seller Fulfilled Prime can be good for some oversized items, but not all of them. It gives third-party sellers access to prime customers and prime members while they ship from their own facilities, and the Prime badge adds free shipping benefits that standard seller fulfilled offers do not automatically get. It works best when the SKU is parcel-shippable, has enough margin, can be fulfilled from the right locations, and has a complete SFP fulfillment cost that is meaningfully lower than FBA. Many bulky items are still cheaper in FBA, even as Amazon tightens new Seller Fulfilled Prime requirements and expectations.
Are bulky items always cheaper to fulfill outside FBA?
No. Bulky items are not always cheaper outside FBA. Some Small Bulky and Large Bulky products have relatively low FBA fulfillment fees, while seller-controlled fulfillment may require more expensive parcel services, pick and pack, operating margin, and delivery-risk coverage. Sellers should compare complete fulfillment cost, not just shipping labels. While FBA fees cover storage and SFP does not impose storage limits like FBA does, potentially reducing some storage fees, bulky items are still not automatically cheaper outside FBA.
Why does dimensional weight matter for oversized SFP?
Dimensional weight matters because bulky cartons can be billed based on the space they occupy rather than their actual scale weight. A product may weigh 36 lb but have a much higher billable weight if the carton is large. That can push the SKU into a higher FBA tier and change whether Seller Fulfilled Prime is economically attractive.
Why should SFP cost models use UPS or FedEx instead of the cheapest carrier?
SFP cost models should use carrier services that can reliably protect the Prime delivery promise. For oversized parcel items, that usually means sellers need to offer premium shipping options through Amazon-integrated services, with two day shipping where applicable, using premium shipping options such as UPS Ground, FedEx Ground, or FedEx Home Delivery. Lower-cost methods may work for ordinary FBM orders, but they may not be appropriate for Seller Fulfilled Prime if they cannot support the required delivery speed and reliability.
When is FBA still better for oversized products?
FBA may still be better when Amazon’s fulfillment fee is lower than the seller’s complete SFP cost, when stronger actual delivery performance matters, when the SKU requires frequent long-zone parcel shipments, when the seller lacks enough fulfillment coverage, or when the item has high damage, return, or carrier-surcharge risk. FBA can also be better when Amazon is absorbing complexity that would be expensive for the seller to recreate.
What should sellers calculate before moving bulky SKUs into SFP?
Sellers should calculate the SKU’s package dimensions, actual weight, dimensional weight, billable shipping weight, FBA size tier, FBA fulfillment fee, complete SFP fulfillment cost, zone mix, carrier surcharge exposure, and Prime delivery risk. The decision should be made SKU by SKU. Sellers also need a professional selling account and a baseline of at least 100 seller fulfilled packages in 90 days before enrollment. Enrollment runs through seller central, includes a 30-day trial period, typically requires enough volume to ship 100 Prime packages monthly, and has a maximum limit of three trial attempts per year.
Written By:

Manish Chowdhary
Manish Chowdhary is the founder and CEO of Cahoot, the most comprehensive post-purchase suite for ecommerce brands. A serial entrepreneur and industry thought leader, Manish has decades of experience building technologies that simplify ecommerce logistics—from order fulfillment to returns. His insights help brands stay ahead of market shifts and operational challenges.
Turn Returns Into New Revenue
Related Articles

What is DHL eCommerce and Why It’s Important for Online Sellers
DHL eCommerce provides shipping solutions for online businesses worldwide.
How Businesses Ship So Cheap: The Reality Behind Commercial Shipping Rates
When small ecommerce merchants compare their shipping costs to what large brands appear to pay, the gap feels insurmountable.
Failed Your Seller Fulfilled Prime Trial? Fix the Root Cause Before You Retry
If you failed a Seller Fulfilled Prime trial, do not restart it until you know exactly which metric failed and what caused it.
How Businesses Ship So Cheap: The Reality Behind Commercial Shipping Rates
In this article
23 minutes
- Introduction to Shipping
- Retail rates versus commercial pricing is real but overestimated
- Negotiated discounts matter far less than merchants assume
- Service-level overspend destroys margins silently
- Zone reduction through inventory placement is the biggest lever
- Cartonization and dimensional efficiency eliminate waste
- Returns and reshipment costs are silent margin killers
- Rate-focused versus decision-focused shipping in practice
- Choosing the Right Shipping Carriers
- International Shipping
- USPS Shipping Options
- Software and systems make operational decisions scalable
- Conclusion
- Frequently Asked Questions
When small ecommerce merchants compare their shipping costs to what large brands appear to pay, the gap feels insurmountable. A package that costs $15 at retail rates seems to ship for $4 or $5 for major retailers. The assumption is that big businesses have access to secret carrier contracts that smaller merchants cannot obtain. While it may look like large brands simply get cheaper shipping rates, the real advantage is not just discounted rates or pre-negotiated discounts. The real advantage is software-driven decision-making that eliminates waste at every step: shorter distances through inventory placement, tighter packaging that avoids dimensional weight penalties, ground service instead of unnecessary air, and operational excellence that prevents returns and reshipments. These advantages are accessible to mid-market merchants, but only if they stop chasing rate discounts and start managing the operational levers that actually control cost.
Introduction to Shipping
Shipping is more than just getting products from point A to point B—it’s a fundamental part of running a successful business. As e-commerce continues to grow, shipping costs have become a major factor in determining a company’s profitability. Every dollar spent on shipping expenses directly impacts your bottom line, making it essential to understand and manage these costs effectively.
Key concepts like flat rate shipping, average shipping cost, and shipping discounts play a crucial role in shaping your shipping strategy. Flat rate shipping offers predictable pricing, which can help you control costs and simplify the checkout process for customers. Knowing your average shipping cost per order allows you to set accurate product prices and maintain healthy profit margins. Taking advantage of shipping discounts—whether through carrier programs or shipping software—can further reduce shipping costs and give your business a competitive edge.
Ultimately, a well-planned shipping strategy not only helps reduce shipping costs but also enhances customer satisfaction by offering reliable, affordable delivery options. By understanding the basics of shipping expenses and the tools available to manage them, businesses can create a shipping process that supports growth and keeps customers coming back.
Retail rates versus commercial pricing is real but overestimated
The difference between walking into a post office and shipping through a commercial carrier account is real. The retail price refers to the published list rates intended for consumers mailing individual packages. In contrast, commercial accounts access discounted rates, which are base rates offered to businesses with carrier accounts. These discounted shipping rates can range from roughly 20% to 40% below the retail price depending on carrier and service level, with ground services typically receiving smaller discounts than air.
For a 5-pound package shipped 1,000 miles, retail pricing might be $18 to $22. The same shipment on a commercial account drops to $12 to $15 thanks to discounted rates. This is meaningful, but it is also the baseline. Every ecommerce business with a Shopify store and a carrier integration (UPS, FedEx, or USPS through Stamps.com or similar) already has access to discounted shipping rates through these platforms. However, the final price a business pays includes not just the base rate but also surcharges, which can diminish the impact of discounted shipping rates.
The gap between what a small merchant pays and what a large brand pays is not primarily explained by negotiated rate cards. It is explained by operational decisions that happen before the package ever reaches a carrier.
Let AI Optimize Your Shipping and Boost Profits
Cahoot.ai software selects the best shipping option for every order—saving you time and money automatically. No Human Required.
See AI in ActionNegotiated discounts matter far less than merchants assume
Volume-based negotiated discounts do exist. A merchant shipping 10,000 packages per month can negotiate 5% to 15% off commercial base rates depending on mix, weight, and zones. A merchant shipping 100,000 packages per month might push that to 20% to 30% off. However, many shipping platforms now offer pre-negotiated discounts and pre-negotiated rates, allowing merchants to access lower costs and cost savings without having to negotiate directly with carriers. These pre-negotiated rates are available regardless of shipping volume and can help businesses save money on shipping expenses. But these discounts apply to the base rate before surcharges, and surcharges now represent 35% to 50% of the final invoice. Fuel surcharges, residential delivery fees, delivery area surcharges, address correction fees, and dimensional weight adjustments are not typically discounted, meaning a 20% discount on base rates translates to roughly 10% to 12% on total spend.
More importantly, negotiated discounts evaporate quickly when operational inefficiencies dominate. Focusing on operational improvements—such as optimizing packaging, analyzing order history, and strategically placing inventory—leads to greater cost savings and helps businesses save money and lower costs more effectively than relying solely on rate negotiations. A merchant with a 25% rate discount who ships oversized boxes across the country in Zone 7 and 8 will spend more per package than a merchant with standard commercial rates who right-sizes packaging, places inventory regionally, and ships in Zones 2 to 4. The math is not close. A Zone 8 shipment with dimensional weight of 30 pounds costs $35 to $42 even with a 20% discount. A Zone 3 shipment with actual weight of 5 pounds costs $8 to $11 at standard commercial rates.
This is why businesses that appear to ship cheaply are not primarily benefiting from carrier contracts. They are benefiting from systems that ensure most shipments are short-distance, ground service, right-sized packages. Those operational wins compound across thousands of orders in ways that rate discounts cannot match.
Service-level overspend destroys margins silently
One of the most common silent cost drivers is service-level misalignment. Merchants should balance cost with shipping speed instead of defaulting to 2-Day Air or Next Day Air for every shipment because they believe customers expect fast shipping. While fast shipping options like UPS® 2nd Day Air and USPS Priority Mail Express are available for quick delivery, they significantly increase costs and should be used strategically. Ground service from a well-placed warehouse reaches 85% of the U.S. within two to three business days. Air service is only necessary for the remaining 15% of distant customers or for time-sensitive orders.
The cost difference is dramatic. A 5-pound package shipped ground 800 miles costs approximately $10 to $13. The same package via 2-Day Air costs $22 to $28. Next Day Air costs $35 to $45. Merchants who use air service by default are spending an extra $12 to $32 per package when ground would have delivered within the same customer expectation window.
Large brands solve this through automated service-level selection. Their warehouse management systems calculate the furthest shipping zone a package can reach via ground and still meet the promised delivery date. Only packages that cannot meet that window are upgraded to air. This single decision can reduce average shipping cost per order by 30% to 50% for brands that were previously using air service broadly.
Small and mid-market merchants often lack this automation. They either manually select service levels (which leads to inconsistent, overly conservative choices) or they set a blanket policy (usually defaulting to faster, more expensive options to be safe). Offering free shipping can support the customer experience, but margins depend on aligning service levels with delivery promises while also managing rising return rates and shipping costs. The result is systematic overspend. The software to automate service-level selection based on destination, promised delivery date, and carrier transit time maps exists and is accessible through most modern shipping platforms and 3PLs. Implementing it is one of the highest-return operational improvements available.
Zone reduction through inventory placement is the biggest lever
Of all the factors that make businesses appear to ship cheaply, inventory placement is by far the most impactful. Shipping zones are based on distance. Zone 2 covers roughly 50 to 150 miles. Zone 8 is coast to coast. A package to Zone 2 costs 50% to 60% less than the same package to Zone 8, and dimensional weight penalties are identical across zones, meaning zone reduction saves money on every package regardless of size or weight.
A business with one warehouse on the East Coast will ship 60% to 70% of packages to Zones 5 through 8 if their customer base is distributed nationally. A business with three warehouses (West Coast, Central, East Coast) will ship 85% of packages to Zones 2 through 4. The cost impact is profound. At 5,000 orders per month, shifting average zone from 6 to 3 can save $25,000 to $40,000 monthly.
This is why large brands with distributed inventory appear to have impossibly low shipping costs. They are not negotiating better rates on long-distance shipments. They are eliminating long-distance shipments entirely. Their systems route each order to the fulfillment center closest to the customer, ensuring that nearly every package travels less than 500 miles. Using many carriers can further optimize shipping zones, since merchants can compare region-specific options and improve reliability by choosing the best fit for each shipping scenario.
For mid-market merchants, distributed inventory and the right warehousing services provider or order fulfillment service designed for ecommerce companies become economically viable at 50 to 100 orders per day or roughly $3 million to $5 million in annual revenue. Below that threshold, the fixed costs of operating multiple warehouse locations (duplicate safety stock, split inventory management, technology integration) can outweigh the savings. While multiple warehouses can increase operational costs, the savings from reduced shipping distances and zone optimization often outweigh these expenses for businesses above a certain volume. But above that threshold, the math strongly favors two to three fulfillment locations over a single centralized warehouse.
Merchants who cannot yet justify multiple warehouses can still optimize single-warehouse location. A centrally located warehouse (Kansas, Missouri, Tennessee, or similar) minimizes average distance to customers compared to a coastal location. This is a lesser version of the same principle, and it still delivers meaningful savings.
ShipStation vs. Cahoot: 21x Faster, Real Results
Get the inside scoop on how a leading merchant switched from ShipStation to Cahoot—and what happened next. See it to believe it!
See the 21x DifferenceCartonization and dimensional efficiency eliminate waste
Dimensional weight pricing means carriers charge for space, not just weight. To calculate dimensional weight, measure the package’s length, width, and height in inches, multiply these dimensions together, and then divide by the carrier’s DIM factor (139 for UPS and FedEx, 166 for USPS). If the calculated dimensional weight exceeds the actual weight, the higher number determines the price. These dimensional weight charges make box size especially important for bulky but light shipments.
Businesses that appear to ship cheaply have solved the packaging optimization problem. This involves two components: cartonization (selecting the right box size for each order) and material efficiency (eliminating excess void fill and overly large protective packaging). Minimizing packaging cost is a key strategy for reducing overall shipping expenses.
Cartonization is the process of matching box dimensions to order contents. A merchant with 10 box sizes can fit most orders into a box that minimizes dimensional weight while still protecting the product. A merchant with three box sizes (small, medium, large) will consistently use boxes that are too big, inflating dimensional weight. Software-based cartonization tools analyze order contents (dimensions and weight of each SKU) and recommend the optimal box from available inventory in real time. This is standard in large fulfillment operations and increasingly available through 3PL partners for mid-market brands that leverage ecommerce fulfillment software with smart inventory placement.
The savings are not trivial. A 3-pound order in an 18x14x8 inch box calculates to 14 pounds of dimensional weight. The same order in a 12x10x6 inch box calculates to 5 pounds. At commercial rates, that is the difference between $11 and $8 per shipment, a 27% cost reduction achieved purely through packaging choice.
Material efficiency also matters. Excess void fill (bubble wrap, air pillows, packing peanuts) increases box size, which increases dimensional weight. Brands that use poly mailers for soft goods instead of boxes eliminate dimensional weight entirely on those orders, as mailers typically fall under the dimensional weight threshold. Rigid mailers for books and documents accomplish the same goal. USPS Priority Mail Cubic is often cheaper for small, dense packages. These decisions happen during fulfillment, not during rate negotiation, and they compound across thousands of shipments. Businesses can also take advantage of free packaging supplies offered by carriers to further reduce costs. USPS flat-rate boxes can ship items up to 70 lbs, which helps when weight is high but box size is controlled.
Using a postage scale to accurately measure package weight is essential so you avoid rating errors, additional fees, and surcharges by getting precise shipping charges every time.
Returns and reshipment costs are silent margin killers
The average ecommerce return rate is 20.4%, and returns are a hidden shipping cost multiplier. Every return incurs an outbound shipment cost and a return shipment cost, but only one of those shipments generated revenue. This effectively doubles the transportation cost on 20% of orders.
Return processing costs go beyond shipping. The full cost of processing a return includes the return label ($8 to $12), inspection and receiving labor ($5 to $8), restocking ($2 to $4), and customer service overhead ($2 to $5), totaling $17 to $29 per return. Only 48% of returned products are resold at full price, meaning inventory depreciation adds another 10% to 40% of the product’s value on top of processing costs.
Businesses that appear to ship cheaply have invested in return rate reduction and in crafting an effective e-commerce returns program. This means better product photography, accurate sizing information, detailed product descriptions, and return flow design that encourages exchanges instead of refunds. Effective return management not only reduces costs but also supports customer retention by improving satisfaction and encouraging repeat business. An apparel brand that reduces return rate from 30% to 20% through better size guides and fit recommendations eliminates returns on 1,000 orders annually at $20 to $30 per return, saving $20,000 to $30,000 in direct return costs. The shipping budget savings alone (eliminating 1,000 return labels at $10 each) is $10,000.
Additionally, businesses with tight quality control and accurate order fulfillment avoid the reshipment costs that occur when wrong items are sent or products arrive damaged. A 2% error rate on 10,000 monthly orders means 200 reshipments, costing $2,000 to $3,000 monthly in redundant shipping charges. Operational excellence that drives error rates below 0.5% eliminates most of this waste.
Rate-focused versus decision-focused shipping in practice
The distinction between rate-focused and decision-focused shipping becomes clearest through direct comparison. Consider two hypothetical merchants, each shipping 3,000 orders monthly with an average order value of $80 and average product weight of 3 pounds.
Merchant A (rate-focused) negotiates a 15% discount off commercial base rates through volume commitments. They ship from a single warehouse in California. They use three standard box sizes (10x8x6, 14x12x8, and 18x16x10) and default to 2-Day Air service to ensure fast delivery. Their packaging includes substantial void fill for protection. They offer free returns with prepaid labels. Their average shipping cost per order is $16.50, resulting in $49,500 in monthly shipping spend.
Merchant B (decision-focused) uses standard commercial rates without volume discounts. They ship from two warehouses (California and Pennsylvania). They use eight box sizes selected through cartonization software and poly mailers for 30% of orders. Their warehouse management system selects ground service unless air is required to meet the promised delivery date, resulting in 82% ground usage. They use minimal void fill and right-sized packaging. They encourage exchanges over refunds and charge return shipping for buyer’s remorse returns. Their average shipping cost per order is $8.20, resulting in $24,600 in monthly shipping spend.
Merchant B spends $24,900 less per month on shipping despite having no negotiated discounts. The savings come from inventory placement ($12,000 monthly), service-level optimization ($8,000 monthly), packaging efficiency ($3,000 monthly), and return reduction ($1,900 monthly). Over a year, Merchant B saves $298,800 compared to Merchant A, an amount that no carrier negotiation could replicate.
Small business owners can adopt similar decision-focused strategies—such as using right-sized packaging, optimizing service levels, and strategically placing inventory—to help small businesses save money on shipping, even without large-scale negotiated discounts, especially when paired with marketing strategies that make free shipping profitable.
This example is not hypothetical in principle. It reflects the actual operational patterns that separate businesses that ship efficiently from those that ship expensively while assuming the problem is carrier pricing, including how they structure free shipping to remain profitable.
Choosing the Right Shipping Carriers
Selecting the right shipping carriers is a critical step in keeping shipping costs low and ensuring your products reach customers quickly and reliably. With a variety of shipping carriers to choose from—including major carriers like usps ups fedex and DHL, as well as regional carriers—businesses have more options than ever to find the most cost effective shipping solution.
To find the best fit, businesses should compare shipping rates across carriers because they use varying pricing structures. USPS is often the cheapest shipping for packages under 15 pounds. UPS Ground Saver often becomes the cheapest option for packages over 15 pounds. Major carriers offer a range of shipping services, from ground shipping for everyday deliveries to express delivery for urgent orders and international shipping for global customers. Regional carriers can be especially valuable for shorter shipping distances, often providing significant savings and faster delivery within specific areas.
When evaluating carriers, it’s important to look beyond just the base shipping rates. Additional expenses such as fuel surcharges, packaging costs, and extra fees for residential or remote deliveries can add up quickly. By understanding the full picture—including how each carrier handles shipping zones and surcharges—you can make informed decisions that reduce shipping costs and improve your shipping operations.
Merchants should compare shipping rates regularly to maintain competitive pricing and reduce your shipping costs, while leveraging multi-carrier shipping software to compare rates in real time and reviewing shipping data to unlock significant savings. The right mix of carriers and services will depend on your shipping volume, product types, and customer locations, but a thoughtful approach can lead to more cost effective shipping and better customer satisfaction.
Cut Costs with the Smartest Shipping On the Market
Guranteed Savings on EVERY shipment with Cahoot's AI-powered rate shopping and humanless label generation. Even for your complex orders.
Cut Costs TodayInternational Shipping
Expanding your business internationally opens up new markets, but businesses have a few options for international shipping depending on budget and delivery requirements. International shipping costs can be significantly higher than domestic rates, so it’s essential to develop a shipping strategy that keeps expenses in check while ensuring reliable delivery.
Choosing the right international shipping service is key. Flat rate shipping options are one way to keep international shipping costs more predictable. Options like USPS Priority Mail Express, FedEx International Economy, and DHL Express each offer different delivery speeds, coverage areas, and pricing structures. Using flat rate boxes and poly mailers can help minimize packaging costs and avoid unexpected shipping fees, especially for lightweight or compact items.
Accurately calculating dimensional weight is crucial for international shipments, as carriers often charge based on the greater of actual weight or dimensional weight. Using shipping software can simplify this process by giving you access competitive rates, helping you compare international services, print shipping labels, and stay compliant with international shipping regulations. Review tracking capabilities alongside price when choosing international delivery services. Staying up to date on customs requirements and documentation will also help you avoid delays and extra costs.
By optimizing your packaging materials, leveraging cost effective shipping services, and using technology to streamline your shipping operations, you can reduce international shipping costs and offer competitive rates to customers around the world.
USPS Shipping Options
The United States Postal Service (USPS) provides a variety of shipping options that can help businesses reduce shipping costs and improve customer satisfaction, especially for Shopify merchants who complement USPS services with specialized Shopify fulfillment services offering fast nationwide shipping. Understanding the strengths of each USPS service allows you to choose the most cost effective option for every order.
USPS First Class Mail is ideal for lightweight parcels, offering affordable rates and reliable delivery for packages up to 16 ounces. For heavier or time-sensitive shipments, USPS Priority Mail provides fast delivery and includes tracking and insurance at no extra cost, and Priority Mail Flat Rate can be a useful option for heavier items that fit standardized packaging. If you’re shipping books, CDs, or other media items, USPS Media Mail offers significant savings, making it a great choice for eligible products.
One of the advantages of using USPS is access to free shipping supplies, such as flat rate boxes and envelopes, which can further reduce your packaging costs. By selecting the right USPS service and taking advantage of free shipping supplies, businesses can keep shipping expenses low while maintaining high levels of customer satisfaction.
Software and systems make operational decisions scalable
The common thread across all of these operational advantages is that they require real-time decision-making at scale. A human cannot manually select the optimal box for every order, calculate the cheapest carrier and service level for every destination, or route each order to the closest warehouse. These decisions require software.
Modern warehouse management systems, order management platforms, and shipping software automate these choices. They integrate with inventory systems to know which warehouse holds which products. They access carrier rate tables to compare shipping rates across carriers and service levels in real time to identify the cheapest shipping method for each order. They apply cartonization algorithms to recommend packaging. They flag high-risk orders for quality checks to prevent reshipment costs.
For mid-market merchants, this ecommerce shipping software is accessible through three paths, whether they choose general multi-carrier platforms, specialized ecommerce fulfillment software built around a peer-to-peer network, or compare options like Veeqo versus more advanced fulfillment-focused solutions. First, many 3PL providers include these capabilities in their warehouse management systems as part of their service, so merchants should understand how to choose the best 3PL for their Shopify store and how 3PL cost structures work for ecommerce fulfillment. Second, standalone shipping platforms and multi-carrier shipping software support business shipping by automating labels, rate shopping, and routing for merchants fulfilling in-house. Third, modern ecommerce platforms like Shopify are increasingly building shipping optimization into their native fulfillment tools, helping merchants save time while choosing the cheapest way to ship based on destination and service level, especially when supported by a solid Shopify order fulfillment strategy.
The cost of this software is not trivial, but it is small relative to the savings it enables. A $500 to $2,000 monthly software cost that saves $10,000 to $30,000 monthly in shipping spend is a clear positive return. The businesses that appear to ship cheaply have made these investments. The businesses struggling with high shipping costs typically have not.
Conclusion
Reducing shipping costs is an ongoing process that requires a strategic approach to every aspect of your shipping operations. By carefully selecting shipping carriers, using cost effective packaging materials, and negotiating for better rates, businesses can significantly reduce shipping expenses and unlock significant savings.
Understanding international shipping options, leveraging shipping software, and staying current with shipping regulations are also essential for streamlining your shipping process and keeping costs under control. Calculating dimensional weight accurately, accounting for fuel surcharges, and factoring in packaging costs will help you find the most cost effective shipping solutions for your business.
For small businesses, these strategies can lead to improved profit margins, faster delivery speed, and higher customer satisfaction and retention. By making smart shipping decisions and continuously optimizing your shipping strategy, you can reduce shipping costs, offer competitive rates—even free shipping—and position your business for long-term success.
Frequently Asked Questions
Do large businesses really get secret carrier rates that small businesses cannot access?
No. Large businesses do receive volume-based negotiated discounts of 20% to 30% off commercial base rates, but these are not secret and are accessible to mid-market merchants shipping 10,000+ packages monthly. However, these discounts apply only to base rates before surcharges. Since surcharges now represent 35% to 50% of the final invoice, a 20% base rate discount translates to only 10% to 12% total savings. More importantly, businesses that appear to ship cheaply achieve their advantage through operational decisions (inventory placement, packaging optimization, service-level selection) that save more than negotiated discounts ever could.
What is the biggest operational factor that makes businesses ship cheaply?
Inventory placement is the single largest operational lever. Shipping zones are based on distance, and a package to Zone 2 (50-150 miles) costs 50% to 60% less than the same package to Zone 8 (coast to coast). A business with three warehouses (West Coast, Central, East Coast) ships 85% of packages to Zones 2-4, while a business with one coastal warehouse ships 60%-70% to Zones 5-8. At 5,000 orders monthly, shifting average zone from 6 to 3 saves $25,000 to $40,000 per month. This advantage is accessible to mid-market merchants at 50-100+ orders daily or $3-$5 million+ annual revenue.
How much does packaging optimization actually save on shipping costs?
The cheapest way depends on package weight, dimensions, and packaging choice, not just published rates, because packaging optimization eliminates dimensional weight waste and can reduce shipping costs 20% to 40% on affected shipments. A 3-pound order in an 18x14x8 inch box calculates to 14 pounds of dimensional weight at commercial rates ($11 per shipment). The same order in a 12x10x6 inch box calculates to 5 pounds ($8 per shipment), a 27% savings. Software-based cartonization tools that match box size to order contents and poly mailers for soft goods eliminate this waste. For merchants shipping 3,000 orders monthly, proper packaging saves $6,000 to $12,000 per month.
Why do some businesses default to air service when ground is cheaper?
Businesses default to air service (2-Day or Next Day Air) because they lack automated service-level selection and overestimate customer delivery expectations. However, ground service from a well-placed warehouse reaches 85% of the U.S. within 2-3 business days. Air service costs 40% to 60% more per package: a 5-pound package costs $10-$13 ground versus $22-$28 for 2-Day Air versus $35-$45 for Next Day Air. Automated warehouse management systems calculate whether ground meets the promised delivery date and only upgrade to air when necessary, reducing average shipping cost 30% to 50% for merchants who were using air broadly.
How do returns affect the true cost of shipping?
Returns double the transportation cost on affected orders because both outbound and return shipments cost money but only one generates revenue. At an average ecommerce return rate of 20.4%, processing a return costs $17-$29 including return label ($8-$12), inspection ($5-$8), restocking ($2-$4), customer service ($2-$5), and, on higher-value returns or outbound orders, shipping insurance to limit losses from damage or theft. Only 48% of returned products resell at full price, adding 10%-40% inventory depreciation. Reducing return rate from 30% to 20% through better product information eliminates 1,000 annual returns at $20-$30 each, saving $20,000-$30,000 in direct costs plus $10,000 in return shipping labels.
Can small businesses access the same shipping advantages as large brands?
Yes, but small businesses can access similar advantages once their shipping needs are clear enough to match tools, carriers, and warehouse strategy to order volume, though some gains only appear above certain thresholds. Commercial pricing (20%-40% off retail rates) is accessible immediately through carrier accounts and ecommerce platforms. Automated service-level selection and cartonization software is available through 3PLs or shipping platforms at $500-$2,000 monthly. Distributed inventory becomes economically viable at 50-100 orders daily or $3-$5 million annual revenue. Below these thresholds, merchants can still optimize single warehouse location (central U.S. instead of coastal), right-size packaging manually, and reduce returns through better product information. The core advantage is not secret rates but operational decisions that minimize distance, dimensional waste, and service overspend.
What should merchants prioritize: negotiating better rates or improving operations?
Merchants should prioritize operational improvements, even though they can negotiate discounted rates and reduce costs that way; a 20% negotiated discount on base rates translates to only 10%-12% total savings after surcharges, and those savings erode as carriers implement annual 8%-12% effective rate increases. The best shipping discounts still matter only after the underlying shipping process is efficient.
Meanwhile, shifting average shipping zone from 6 to 3 through inventory placement saves 40%-50% per order. Right-sizing packaging saves 20%-40% on dimensionally-charged shipments. Service-level optimization saves 30%-50% versus defaulting to air. Return rate reduction eliminates double shipping costs on 20%+ of orders. These operational wins are larger, more durable, and compound across thousands of shipments in ways rate discounts cannot match.
What software or tools enable businesses to ship more efficiently?
Efficient shipping requires warehouse management systems with automated order routing (to nearest fulfillment center), cartonization algorithms (optimal box selection), and service-level selection (ground versus air based on transit time and delivery promise). Efficient tools help merchants find the cheapest shipping and support offering free shipping without losing control of margins. Multi-carrier shipping software provides real-time rate shopping across carriers. These capabilities are available through: (1) 3PL providers who include these features in their warehouse management systems; (2) Standalone shipping platforms for in-house fulfillment; (3) Native ecommerce platform tools (Shopify, etc.). Typical cost is $500-$2,000 monthly, which saves $10,000-$30,000+ monthly in shipping spend for merchants at scale, delivering clear positive ROI.
Written By:

Indy Pereira
Indy Pereira helps ecommerce brands optimize their shipping and fulfillment with Cahoot’s technology. With a background in both sales and people operations, she bridges customer needs with strategic solutions that drive growth. Indy works closely with merchants every day and brings real-world insight into what makes logistics efficient and scalable.
Turn Returns Into New Revenue
Related Articles
What is DHL eCommerce and Why It’s Important for Online Sellers
DHL eCommerce provides shipping solutions for online businesses worldwide.
Seller Fulfilled Prime for Oversized Items: The FBA vs. SFP Math Sellers Need to Run
Seller Fulfilled Prime can work for oversized and bulky items, but it is not automatically cheaper than FBA.
Failed Your Seller Fulfilled Prime Trial? Fix the Root Cause Before You Retry
If you failed a Seller Fulfilled Prime trial, do not restart it until you know exactly which metric failed and what caused it.
Failed Your Seller Fulfilled Prime Trial? Fix the Root Cause Before You Retry
In this article
20 minutes
- What Should You Do After a Failed Seller Fulfilled Prime Trial?
- A Seller Can Fail the SFP Trial Even When Every Order Ships Correctly
- Why Did Your Seller Fulfilled Prime Trial Fail?
- Check the Systems That Create Amazon’s Delivery Promise
- Rebuild Inventory Placement Before Restarting the SFP Trial
- Choose the Prime SKU Pool to Support Both Performance and Page Views
- Coordinate Amazon Advertising With the Delivery Promise Window
- Do Not Blame the Carrier Until You Separate Carrier Risk From Network Design
- Build a Post-Mortem Before You Restart the Seller Fulfilled Prime Trial
- Seller Fulfilled Prime Trial Restart Checklist
- Should You Restart SFP or Reconsider the Strategy?
- The Key Lesson: Fix the Promise System, Not Just the Failed Metric
- Frequently Asked Questions About a Failed Seller Fulfilled Prime Trial
If you failed a Seller Fulfilled Prime trial, do not restart it until you know exactly which metric failed and what caused it. Amazon may let an eligible seller retry, but a second attempt with the same handling-time feed, shipping templates, inventory placement, SKU mix, carrier setup, and traffic pattern is likely to produce the same result.
The most important lesson is that an SFP trial can fail even when shipping and tracking performance are perfect. One Cahoot seller maintained clean shipping and tracking metrics but failed because its 1-day page view speed remained around 15%, below the required level for its trial. The causes were spread across its integration, Amazon shipping templates, inventory placement, SKU selection, and advertising schedule—not warehouse execution.
For Amazon sellers already in the Seller Fulfilled Prime trial—or preparing to start one—this article focuses on what to do after a failed trial, how to run a useful post-mortem, how to verify handling times and shipping templates, how inventory placement, SKU choice, advertising, and carrier decisions affect Prime promises, and when it actually makes sense to restart. Fixing those root causes is what protects you from repeated failures, improves the delivery promises customers see, and gives you a real chance to earn the Prime badge without burning another trial. Sellers preparing for their first attempt should begin with Cahoot’s Seller Fulfilled Prime trial checklist to pressure-test SKU fit, inventory readiness, warehouse coverage, and launch risk before Prime performance is on the line.
Slash Your Fulfillment Costs by Up to 30%
Cut shipping expenses by 30% and boost profit with Cahoot's AI-optimized fulfillment services and modern tech —no overheads and no humans required!
I'm Interested in Saving Time and MoneyWhat Should You Do After a Failed Seller Fulfilled Prime Trial?
| Recovery step | What to examine | Why it matters |
| Identify the failed metric | Page view speed, on-time delivery, tracking, cancellations, weekend coverage, or another trial requirement | The visible metric determines where the investigation should begin. |
| Trace the metric to its root cause | Feeds, shipping templates, inventory location, carrier rules, cutoff times, SKU selection, and traffic timing | The SFP dashboard often shows the symptom, not the system that produced it. |
| Fix every contributing issue | Correct listing data, template assignments, inventory depth, advertising windows, staffing, and routing | Partial fixes leave the next trial exposed to the same failure pattern. |
| Rebuild the trial around suitable SKUs | Demand, margin, size, regional coverage, replenishment reliability, and page view potential | Not every SKU helps an SFP trial or belongs in SFP long term. |
| Restart only when the setup is stable | End-to-end testing from Amazon listing data through final delivery | A retry should be a controlled relaunch, not another experiment. |
| After a failed trial, start with the specific metric Amazon flagged, then use the seller fulfilled prime dashboard to examine the SFP performance dashboard and identify the likely failure cause before you change settings. During the trial itself, monitor performance metrics continuously so you can catch drift early instead of waiting until Amazon records a failure. |
A Seller Can Fail the SFP Trial Even When Every Order Ships Correctly
One Cahoot seller’s experience shows why a failed SFP trial requires a broader investigation than checking late shipments.
With Amazon’s Seller Fulfilled Prime, the trial period is meant to help sellers demonstrate fulfillment capabilities before Prime access is granted. The seller’s shipping and tracking metrics were perfect throughout the trial. Orders left the warehouse correctly, tracking was valid, and fulfillment execution was not the problem. Yet the seller’s 1-day page view speed remained around 15%, and the account failed to meet the trial requirement.
When Cahoot and the seller investigated, they found four causes that were not obvious from the SFP dashboard:
| Hidden problem | What happened | Effect on the SFP trial |
| Incorrect handling-time feed | The seller’s ChannelAdvisor integration was silently sending a 2-day handling time to Amazon for all listings, including Prime listings. | Amazon calculated slower delivery promises even though the warehouse could ship faster. |
| Wrong Prime shipping template | Amazon created a “Default Prime” template when the trial began, and some ASINs were assigned to it instead of the correctly configured Cahoot SFP template. | Some products did not receive the intended Prime coverage and delivery settings. |
| Inventory missing from key locations | Several Prime SKUs lacked inventory at fulfillment locations needed to serve important 1-day zones. | Shoppers in those regions did not see a fast delivery promise. |
| Traffic arrived after the promise window | A meaningful share of ad-driven page views arrived in the evening, after the relevant cutoff. | Those page views were recorded when Amazon could no longer display the same fast promise. |
| The seller did not fail because its warehouse could not fulfill Prime orders. It failed because the systems surrounding fulfillment did not consistently create the customer-facing promise Amazon was measuring. |
That distinction should shape every SFP recovery plan: start with the failed metric, but investigate the entire promise chain while monitoring trial status, since listings do not have prime branding or the prime badge displayed during the trial.
Why Did Your Seller Fulfilled Prime Trial Fail?
The first step is to identify the metric that failed. Sellers should download available performance and defect data, review Amazon’s notification, and compare the issue against order-level, ASIN-level, location-level, and traffic data. Check the failed result against Amazon’s required thresholds, including a 93.5% on-time delivery rate, a valid tracking rate over 95%, and a cancellation rate below 0.5%, with seller-initiated cancellations capped at 0.5%.
Do not assume the most visible problem is the root cause. Use the table below to decide where to investigate first.
| Failed SFP metric | Likely areas to investigate | Common mistake |
| 1-day or 2-day page view speed | Handling time, shipping template assignment, inventory location, Prime SKU pool, cutoff times, and advertising schedule | Reviewing shipped orders only, even though the failure occurred before an order was placed |
| On-time delivery rate | Warehouse cutoff, carrier pickup, service selection, distance to customer, late-risk lanes, and delivery scans | Blaming the carrier without examining whether the network depended on perfect carrier performance |
| Valid tracking rate | Label workflow, tracking uploads, first scans, integrations, carrier support, and data mapping | Assuming a generated tracking number is the same as valid, timely carrier tracking |
| Cancellation rate | Inventory synchronization, overselling, replenishment, damaged stock, channel allocation, and routing failures | Looking only at total inventory instead of available inventory by location |
| Weekend performance | Staffing, warehouse schedules, carrier pickup availability, cutoff configuration, and exception handling | Turning on weekend settings before the physical operation is ready |
| For a broader explanation of current program rules and recovery guardrails, see Cahoot’s guide to Seller Fulfilled Prime and Premium Shipping program changes and the impact of Amazon’s new shipping and delivery policy updates. Sellers should also confirm current requirements in Amazon Seller Central because program rules and account-specific instructions can change. |
Looking for a New 3PL? Start with this Free RFP Template
Cut weeks off your selection process. Avoid pitfalls. Get the only 3PL RFP checklist built for ecommerce brands, absolutely free.
Get My Free 3PL RFPCheck the Systems That Create Amazon’s Delivery Promise
Seller Fulfilled Prime performance begins before the warehouse receives an order. Amazon builds the delivery promise from listing data, inventory availability, shipping settings, delivery regions, cutoff times, and other inputs, all of which must align with the updated Seller Fulfilled Prime requirements. A fast warehouse cannot compensate for inaccurate information being sent to Amazon.
Verify the handling time Amazon is actually receiving
Do not rely on what the integration or order-management system appears to show. Confirm the handling time displayed and used inside Amazon for the affected listings.
In the Cahoot seller example, ChannelAdvisor silently pushed a 2-day handling time across Prime listings. The warehouse could ship quickly, but Amazon was making its promise from slower data. Sellers using middleware, an ERP, an OMS, a marketplace connector, or bulk listing tools should verify which system controls handling time and whether another feed can overwrite it.
This is especially important because Amazon handling-time settings influence the promise shown to shoppers. Cahoot’s article on the Amazon handling time requirement explains why listing configuration and physical fulfillment speed must agree.
Confirm every SFP ASIN is assigned to the correct Prime template
Amazon may create or modify templates during setup, and listings can end up assigned to a template the seller did not intend to use. Export or inspect the SKU-to-template assignments instead of checking only the template that appears correctly configured.
For each SFP SKU, verify:
- the assigned shipping template;
- the Prime regions and delivery speeds enabled;
- the order cutoff and weekend settings;
- the fulfillment locations supporting the promise and the shipping services tied to the template, making sure they use approved carriers and integrated carrier options for valid tracking; and
- whether any automated rule, integration, or Amazon-created default can overwrite the assignment.
Prime eligible SKUs should be configured with shipping services that support Prime delivery promises and reliable tracking through approved carriers such as UPS or FedEx.
Test the customer-facing promise by location and time of day
The dashboard is not the only place to inspect an SFP trial. Sellers should test what shoppers actually see, especially when they fulfill orders from their own warehouse rather than Amazon’s network.
Check representative ASINs using ZIP codes near each fulfillment location and in important customer regions. Repeat the test before and after the order cutoff. The goal is to understand when and where Amazon displays a 1-day or 2-day promise—and where it does not.
This makes invisible gaps visible. A listing may look properly configured but still show a slower promise in a high-traffic region because inventory is too far away, a cutoff has passed, or the ASIN is assigned incorrectly, and this customer-facing test helps confirm that Seller Fulfilled Prime gives sellers control over inventory and logistics while the seller fulfilled setup actually supports Prime-eligible promises in each region.
Rebuild Inventory Placement Before Restarting the SFP Trial
Total inventory is not enough. The right SKUs need sufficient inventory in the locations that support the delivery promises Amazon measures.
Before restarting, the Cahoot seller analyzed its sales data, identified its best-selling SKUs, and prepared to send significantly deeper inventory of those products to every relevant fulfillment location. That decision addressed two problems: the risk of a location stocking out and the risk that a shopper would see a slower promise because the nearest node lacked stock.
The recovery analysis should answer:
- Which SKUs generate the most sales and qualified page views?
- Where are those shoppers located?
- Which fulfillment locations can support 1-day and 2-day promises to those regions?
- How much safety stock is needed at each location for the full trial?
- Which SKUs have replenishment times that make distributed stocking risky?
Inventory placement is one reason SFP should not be treated as a simple badge activation. Cahoot’s analysis of Amazon’s Prime delivery speed and inventory placement explains why proximity to demand often matters more than trying to ship every distant order faster.
Sellers that are still deciding how many warehouses they need should use the SFP trial readiness checklist to evaluate whether the current footprint supports the intended coverage.
Choose the Prime SKU Pool to Support Both Performance and Page Views
Not every SKU belongs in Seller Fulfilled Prime, but a trial also needs enough appropriate products and qualified traffic to create a meaningful page view base.
The Cahoot seller planned to add more suitable SKUs to its Prime pool before restarting. The goal was not to enroll the entire catalog. It was to broaden the view base with products that had demand, sufficient inventory, reliable replenishment, and sustainable fulfillment economics.
| Stronger SFP trial candidate | Riskier SFP trial candidate |
| Consistent sales and page views | Very low traffic or highly unpredictable demand |
| Healthy margin after required shipping | Low margin that depends on cheap, slow delivery |
| Inventory stocked across required locations | Inventory concentrated in one region |
| Reliable replenishment | Long or uncertain replenishment cycle |
| Standard, easy-to-ship parcel | Bulky, fragile, extra-large, or operationally complex item |
| The Prime badge can improve conversion, but it does not automatically make every SKU profitable. Seller Fulfilled Prime can help sellers avoid FBA storage fees, but only if shipping costs and operational risk still work at the SKU level. Sellers should compare the required shipping cost, shipping costs exceptions, and operating risk at the SKU level. Cahoot’s Seller Fulfilled Prime profit math article explains why SFP decisions should be made product by product rather than across the entire catalog. |
Coordinate Amazon Advertising With the Delivery Promise Window
More traffic does not automatically improve SFP page view speed metrics. Timing matters.
In the Cahoot seller’s first trial, a meaningful share of ad traffic arrived in the evening, outside the strongest delivery promise window. Those shoppers viewed the listing after the relevant cutoff, when Amazon could no longer display the same fast promise.
For the retry, the seller hired a dedicated person to manage Amazon marketing and actively drive page views during the delivery promise window.
This does not mean advertising should be manipulated solely to satisfy a metric. It means the marketing team must understand that the promise shown on the product page changes with time, inventory, and location, especially around major sales peaks such as Amazon Prime Day preparation and promotions. During an SFP trial, advertising and fulfillment cannot operate as separate functions.
Before restarting, compare hourly traffic against the delivery promises displayed for priority ASINs. If campaigns disproportionately send shoppers after cutoff, test whether budget scheduling, bid adjustments, or campaign timing can shift more qualified traffic into periods when the fast promise is available.
Scale Faster with the World’s First Peer-to-Peer Fulfillment Network
Tap into a nationwide network of high-performance partner warehouses — expand capacity, cut shipping costs, and reach customers 1–2 days faster.
Explore Fulfillment NetworkDo Not Blame the Carrier Until You Separate Carrier Risk From Network Design
Some SFP failures are caused by late delivery, and carriers do create real risk. A seller can ship on time and still receive a late delivery scan because of network congestion, weather, a missed sort, or another carrier exception. That can happen even with expedited shipping on difficult lanes.
However, the recovery analysis should still ask whether the fulfillment model allowed enough margin for normal carrier volatility. A network that depends on one warehouse, one service, one late pickup, or flawless carrier execution is fragile, and delayed shipments can also reflect insufficient operational capacity, especially when carrier shipment exceptions and their resolution are not well understood and managed.
Review:
- which carrier and service handled each failed lane;
- whether the package received a timely first scan;
- whether another fulfillment location could have shortened the zone;
- whether the order was routed before or after a safe cutoff;
- whether an alternate carrier could have protected the promise; and
- whether amazon buy shipping services were used correctly to buy shipping labels, authenticate tracking numbers, and preserve compliance protections.
Amazon customer service handles post-order support for Prime orders, but carrier relationships and fulfillment operations still determine whether delivery promises are met. Many sellers rely on specialized Amazon SFP 3PL fulfillment services to support consistent nationwide 1- and 2-day delivery.
Cahoot’s analysis of Seller Fulfilled Prime carrier on-time delivery covers how carrier performance can affect Prime eligibility and why sellers still need operational safeguards around the carrier.
Build a Post-Mortem Before You Restart the Seller Fulfilled Prime Trial
A useful SFP post-mortem should connect Amazon’s performance metrics to the operational and technical causes behind it.
| Post-mortem question | Required answer before retrying |
| Which metric failed? | The exact trial metric, affected period, size tier, ASINs, regions, or orders |
| What created the failure? | Specific feed, template, inventory, traffic, carrier, staffing, or routing causes |
| Why was it not detected earlier? | The monitoring, ownership, or data gap that allowed the issue to continue during the Seller Fulfilled Prime trial, even though metrics are reviewed weekly and drift should be caught before failure |
| What has changed? | Concrete configuration and operational fixes—not a promise to “monitor more closely” |
| How will the fix be verified? | Test orders, customer-facing promise checks, feed audits, inventory checks, and daily reporting |
| Who owns the next trial? | Named owners for Seller Central, integrations, inventory, fulfillment, carriers, and advertising |
| The Cahoot seller’s recovery plan included four concrete changes: |
- Send deeper inventory of best-selling SFP SKUs to every required fulfillment location.
- Add more suitable SKUs to broaden the Prime page view base.
- Assign a dedicated Amazon marketing owner to drive qualified page views during the delivery promise window.
- Fix the handling-time feed and verify every Prime shipping template assignment before reactivation.
Amazon typically notifies sellers which specific metrics were not met after a failed trial, and that notice should be turned into operational improvements before another attempt. That is the standard a recovery plan should meet. “We will watch the dashboard more carefully” is not a root-cause fix.
Seller Fulfilled Prime Trial Restart Checklist
Confirm before restart that you can complete the 30-day trial, ship at least 100 Prime orders, maintain a 93.5% on-time delivery rate, and meet the 99% valid tracking rate requirement.
| Before restarting | Complete? |
| Failed metric and affected SKUs, regions, or orders have been identified | |
| Enough expected prime order volume exists to reach the minimum 100 Prime trial orders required for evaluation | |
| Handling time has been verified inside Amazon, not only in the source system | |
| All SFP SKUs are assigned to the intended Prime shipping template | |
| Customer-facing promises have been tested by ZIP code and time of day | |
| Priority SKUs have enough inventory at every required fulfillment location | |
| The Prime SKU pool balances page view potential, operational fit, and margin | |
| Advertising timing has been compared with delivery promise windows | |
| Carrier, cutoff, weekend, and exception workflows have been tested | |
| Named owners, weekend operations readiness for at least one weekly shipping day, and daily monitoring of prime trial orders and trial performance metrics are in place | |
| Sellers that need to re-evaluate the full operating model before another attempt should review why Seller Fulfilled Prime only works with the right operating model and how to focus on winning on Amazon Seller Fulfilled Prime. A strong trial setup needs more than a capable warehouse; it requires aligned inventory, systems, templates, carriers, marketing, and accountability. |
Should You Restart SFP or Reconsider the Strategy?
A failed trial does not automatically mean Seller Fulfilled Prime is the wrong program. It may reveal fixable configuration or execution problems. But sellers should still use the post-mortem to decide whether SFP makes sense for every SKU and every region.
FBA may be a better fit for some high-velocity standard items. Standard FBM may be safer for slow, bulky, fragile, or low-margin products. Premium Shipping may provide a useful fast-delivery option without applying SFP across the same assortment, while alternatives such as merchant fulfilled Prime and other FBA substitutes can diversify fulfillment risk. SFP may be best reserved for products where margin, inventory placement, and fulfillment reliability all support the Prime promise.
The decision should be economically honest. Use Cahoot’s SFP profit analysis and strategies from the webinar on using Amazon SFP to fight rising FBA fees to compare the badge’s potential conversion benefit against shipping cost and execution risk.
The Key Lesson: Fix the Promise System, Not Just the Failed Metric
A failed Seller Fulfilled Prime trial is not always evidence of poor shipping. The warehouse may perform perfectly while a handling-time feed, default template, inventory gap, or after-cutoff page view prevents Amazon from showing the required delivery promise.
Before restarting, trace the failed metric across the full system: listing data, integrations, templates, SKU selection, inventory placement, traffic timing, order routing, warehouse operations, carrier delivery, and even broader changes in order fulfillment models like peer-to-peer networks and Buy with Prime.
Amazon may let an eligible seller retry the SFP trial. But the opportunity should not be treated as a reset button. It should be treated as a controlled relaunch built from the first attempt’s evidence.
Do the post-mortem first. Fix every root cause. Then restart with a setup designed to pass—and to keep working after the trial ends.
Frequently Asked Questions About a Failed Seller Fulfilled Prime Trial
Can you restart a Seller Fulfilled Prime trial after failing?
Amazon states that a seller who does not pass the trial may restart it when the account meets the applicable prequalification requirements outlined in the latest Seller Fulfilled Prime guidelines and signup criteria. Amazon generally limits SFP trial attempts to three per calendar year, so sellers should plan those trial attempts carefully. A failed trial uses one of those attempts, some failures can trigger an automatic reset if performance criteria are not met, and repeated failure may temporarily block re-application depending on Amazon’s current policy. Sellers should check their current Seller Central instructions before restarting because eligibility and program requirements may change.
Why did my SFP trial fail if my orders shipped on time?
SFP trial performance includes more than warehouse shipping. A seller can fail because shoppers did not see enough qualifying fast delivery promises. Handling time, shipping templates, inventory location, cutoff times, and page view timing can affect the promise even when fulfilled orders ship correctly.
What is Seller Fulfilled Prime page view speed?
Page view speed measures the share of eligible product page views, including prime customer page views, that show qualifying fast delivery promises rather than only what happens after an order is placed. It is influenced by where inventory is located, the shopper’s delivery ZIP code, when the page is viewed, handling time, shipping settings, and the SKU’s template assignment.
Should I immediately retry after a failed SFP trial?
No. First identify the exact failed metric, complete a root-cause analysis, make the required fixes, and verify the customer-facing delivery promise. Review your seller fulfilled prime dashboard to identify the exact cause of failure before retrying. Restarting with the same setup is likely to repeat the failure.
Can advertising affect an SFP trial?
Advertising can affect which products receive page views and when those views occur. If a large share of traffic arrives after a shipping cutoff, shoppers may see a slower delivery promise, and campaign timing during major sales events or major weather events can distort those windows and raise trial risk, so avoid launching during peak Q4 holiday traffic when possible. During the trial, marketing teams should understand how campaign timing intersects with delivery promise windows.
How do I choose SKUs for an SFP trial retry?
Favor SKUs with reliable demand, sufficient page views, healthy margin, predictable replenishment, manageable parcel characteristics, and inventory positioned across the locations needed to support fast delivery so the SKU pool can also help you maintain Prime eligibility after the retry, not just pass the trial. Avoid adding products only to increase assortment if they create fulfillment or margin risk, and remember that sellers can reapply after fixing operational issues when choosing SKUs with sustainable fulfillment economics that protect prime offers.
Written By:
Manish Chowdhary
Manish Chowdhary is the founder and CEO of Cahoot, the most comprehensive post-purchase suite for ecommerce brands. A serial entrepreneur and industry thought leader, Manish has decades of experience building technologies that simplify ecommerce logistics—from order fulfillment to returns. His insights help brands stay ahead of market shifts and operational challenges.
Turn Returns Into New Revenue
Related Articles
What is DHL eCommerce and Why It’s Important for Online Sellers
DHL eCommerce provides shipping solutions for online businesses worldwide.
Seller Fulfilled Prime for Oversized Items: The FBA vs. SFP Math Sellers Need to Run
Seller Fulfilled Prime can work for oversized and bulky items, but it is not automatically cheaper than FBA.
How Businesses Ship So Cheap: The Reality Behind Commercial Shipping Rates
When small ecommerce merchants compare their shipping costs to what large brands appear to pay, the gap feels insurmountable.
UPS Ground Saver vs UPS Ground: Costs, Speed, Limits, and When to Use Each

In this article
17 minutes
- UPS Ground Saver vs UPS Ground: The Short Answer
- UPS Ground Saver vs UPS Ground Comparison Table
- What Is UPS Ground Saver?
- What Is UPS Ground?
- Ground Saver Saves Money by Trading Away Speed and Flexibility
- UPS Ground Offers a Faster and More Capable Standard Service
- USPS May Handle the Final Delivery for Ground Saver
- The $50 Coverage Limit Makes Shipment Value a Deciding Factor
- Package Weight, Size, and Address Eligibility Can Rule Out Ground Saver
- A Cheaper Label Can Create Higher Customer-Service Costs
- When Ecommerce Sellers Should Use UPS Ground Saver
- When Ecommerce Sellers Should Keep UPS Ground
- How to Automate the Decision at Scale
- Frequently Asked Questions
UPS Ground Saver vs UPS Ground: The Short Answer
UPS Ground Saver is the lower-cost economy option for lightweight, low-value, non-urgent residential shipments, with final delivery handled by UPS or the U.S. Postal Service depending on the destination. UPS Ground is the standard ground service run end-to-end through the UPS network, typically with faster transit, fewer restrictions, and a better fit for heavier packages, higher-value orders, commercial addresses, or tighter delivery promises. The two services are not interchangeable, and choosing between them by base rate alone almost always misreads the total cost.
For ecommerce operators deciding how to ship orders efficiently and cost-effectively, the real comparison goes beyond price. Shipment value, package profile, address type, delivery speed, final-mile handling, coverage limits, and service eligibility all affect which option makes sense and how reliably you meet customer expectations. A lightweight, low-value, non-urgent residential parcel is a strong Ground Saver candidate; a $300 electronics order with a tight delivery promise belongs on UPS Ground. At scale, this decision should be automated using order attributes rather than made per-label.
Let AI Optimize Your Shipping and Boost Profits
Let AI Optimize Your Shipping and Boost Profits
Cahoot.ai software selects the best shipping option for every order—saving you time and money automatically. No Human Required.
See AI in ActionUPS Ground Saver vs UPS Ground Comparison Table
| Attribute | UPS Ground Saver | UPS Ground |
|---|---|---|
| Typical delivery timing | Comparable to UPS Ground plus approximately 1 to 2 additional business days, Monday through Saturday | 1 to 5 business days depending on origin and destination zone |
| Cost tendency | Generally lower base rate on suitable lightweight residential shipments; not universally cheaper once surcharges and package profile are considered | Higher base rate; often more predictable total cost on heavier, longer-zone, or higher-value shipments |
| Final-mile carrier | UPS or USPS depending on destination | UPS end-to-end |
| Address type | Designed for residential delivery | Residential and commercial |
| PO Boxes | Eligible U.S. PO Boxes supported through USPS final delivery | Not delivered |
| APO, FPO, DPO addresses | Supported through USPS final delivery | Not delivered |
| Origin and destination coverage | Picked up within the 48 contiguous states; delivered to the 48 contiguous states, Alaska, Hawaii, Puerto Rico, U.S. Territories, U.S. PO Boxes, and APO/FPO/DPO addresses; not international | All 50 states and Puerto Rico |
| Maximum weight | Positioned for lighter packages; verify current maximum against your UPS contract and the UPS Ground Saver Terms and Conditions | Up to 150 lbs per package |
| Package size | Narrower size envelope than UPS Ground | Up to 108″ length and up to 165″ length plus girth |
| Tracking | Package-level tracking via UPS tracking number; visibility may continue during USPS final delivery | Package-level tracking via UPS tracking number, end-to-end within the UPS network |
| Included loss or damage coverage | Up to $50 per package, subject to UPS terms and conditions | Standard included coverage per UPS terms; declared value can be increased on eligible shipments |
| Best use case | Lightweight, low-value, non-urgent residential orders; PO Box and military addresses through USPS participation | Heavier or higher-value orders, commercial addresses, tighter delivery promises, and shipments needing broader UPS service capabilities |
| Main risk | Longer transit variability and lower included coverage relative to shipment value | Higher label cost when the shipment does not require the additional speed or capability |
| Contract-specific weight, dimension, and surcharge rules can vary, so confirm your account terms before assigning shipments at scale. |
What Is UPS Ground Saver?
UPS Ground Saver is UPS’s economy ground shipping option, positioned as an economical alternative for businesses that need a lower-cost option than standard UPS Ground for non-urgent packages. It is a contract-only service, so it must be enabled on your UPS account rather than selected ad hoc at a retail counter.
The service was previously called UPS SurePost. UPS rebranded and restructured the product, and Ground Saver has continued to evolve. Under the current model, UPS handles UPS ground transportation, and final delivery is completed by either UPS or the U.S. Postal Service depending on the destination. That last-mile split shapes last mile delivery, makes eligible PO Box and military addresses reachable, and is why Ground Saver behaves differently from a pure UPS-only service.
The intended shipment profile is residential, with a flexible delivery window, and Ground Saver is designed for lightweight packages and less urgent packages. UPS describes typical transit times as comparable to UPS Ground plus approximately one to two additional business days, with delivery generally Monday through Saturday. There is no expedited version, no signature-required option, and no service guarantee comparable to UPS’s time-definite air services, so it is not built for urgent deliveries.
ShipStation vs. Cahoot: 21x Faster, Real Results
Get the inside scoop on how a leading merchant switched from ShipStation to Cahoot—and what happened next. See it to believe it!
See the 21x DifferenceWhat Is UPS Ground?
UPS Ground is the broader UPS Ground service most sellers already know. It moves entirely within the UPS network from pickup to delivery, covers all 50 states and Puerto Rico, and offers day-definite delivery in one to five business days depending on the zone. It accepts packages up to 150 pounds, up to 108 inches in length, and up to 165 inches in combined length and girth.
Because UPS Ground stays inside a single network, tracking is continuous, exception handling is simpler, and value-added service options are broader. Commercial deliveries, residential deliveries, signature requirements, address changes through UPS My Choice, and higher declared value are all easier to support. That capability is why UPS Ground remains the default for most B2C and B2B shipments where cost and delivery speed both matter.
Ground Saver Saves Money by Trading Away Speed and Flexibility
Ground Saver’s savings come from the combination of an economy service tier and a delivery model that includes USPS participation on certain lanes. For less urgent deliveries, the base rate is often lower than UPS Ground on qualifying lightweight residential parcels, especially when cost matters more than speed. That is where the appeal starts and, for many sellers, where the analysis stops, even though the lower price only makes sense in the right order context.
The problem is that carriers do not price parcels only by base rate. Residential delivery, fuel, delivery area, dimensional weight, additional handling, and peak-season fees can all be layered onto ground shipments. A cheaper label with a heavier surcharge profile can end up producing a similar or higher total cost than UPS Ground on the same package. Any serious comparison has to consider shipping surcharges and total landed shipment cost, not the label price alone.
This is one of several economy shipping levers available to ecommerce sellers, and it is worth testing economy shipping strategically against your actual package mix and lanes rather than assuming savings will materialize evenly.
UPS Ground Offers a Faster and More Capable Standard Service
UPS Ground earns its place when the shipment carries more risk, more value, or a more sensitive delivery promise. The extra cost buys tighter transit, end-to-end UPS handling, broader address coverage, and access to features Ground Saver does not offer.
Keep UPS Ground for orders that meet any of the following conditions:
- The customer expects a tighter delivery window than Ground Saver’s plus-one-to-two-day range comfortably supports.
- Shipment value is meaningfully above the $50 included coverage on Ground Saver.
- The package is heavier or larger than Ground Saver’s eligibility envelope.
- The order requires signature on delivery or another service capability that Ground Saver does not provide.
- The destination is commercial.
- Ground Saver savings are small, and any operational issue would erase them.
USPS May Handle the Final Delivery for Ground Saver
Ground Saver packages travel through UPS ground transportation. On qualifying destinations, UPS hands the parcel to USPS for the final leg of last mile delivery. On others, UPS completes the delivery itself. The mix varies by destination and by ongoing operational changes to the service.
The USPS handoff is what makes eligible U.S. PO Boxes and APO, FPO, and DPO addresses reachable through Ground Saver, which UPS Ground does not serve, and that final-delivery model is especially relevant for qualifying residential addresses. That single capability is often the deciding factor for sellers with military customers or buyers who prefer PO Box delivery, particularly for Amazon sellers who also rely on Amazon Buy Shipping integrated fulfillment workflows.
The tradeoff is operational visibility. Tracking is provided through a UPS tracking number and is designed to keep ups ground saver shipments visible through final delivery, but a carrier handoff introduces more potential points where an update can lag or a scan can be missed. That has direct downstream effects on how your team needs to manage delivery exceptions, since a customer looking at a tracking page that has not updated for a day does not care which carrier is on the road at that moment.
The $50 Coverage Limit Makes Shipment Value a Deciding Factor
UPS Ground Saver includes up to $50 of loss or damage coverage per package, subject to UPS’s terms and conditions. That number is not a placeholder. It is the ceiling for what is included, and it is the single most important service constraint for shipment selection.
Included coverage is not equivalent to conventional insurance, and the terms specific to Ground Saver may differ from other UPS services. What matters practically is this: if the retail value of the shipment exceeds $50 and you do not carry independent parcel insurance or elevated declared value coverage, you are exposed on any loss or damage above that threshold.
That makes Ground Saver structurally unsuited to jewelry, higher-end electronics, luxury apparel, or any product where a replacement will cost more than the coverage limit. Assigning those SKUs to Ground Saver to save a small amount per label is a bet that no shipment will go wrong. Some will, and the ones that do can erase the year’s savings on that lane.
Cut Costs with the Smartest Shipping On the Market
Guranteed Savings on EVERY shipment with Cahoot's AI-powered rate shopping and humanless label generation. Even for your complex orders.
Cut Costs TodayPackage Weight, Size, and Address Eligibility Can Rule Out Ground Saver
Ground Saver is designed for a narrower package profile than UPS Ground, so optimizing how you pack orders with efficient smart cartonization tools can directly affect which service each shipment qualifies for. UPS Ground accepts packages up to 150 lbs, 108 inches long, and 165 inches in combined length and girth. Ground Saver is limited to packages under 70 pounds and 60 inches in length and is not intended for heavy or oversized items. The intended profile is packages under 10 pounds and under one cubic foot. Confirm the exact current thresholds in the UPS Ground Saver Terms and Conditions and against your negotiated contract before setting up automated service selection rules.
Address eligibility also filters shipments out. Ground Saver requires an origin within the 48 contiguous states. Destinations include the 48 contiguous states, Alaska, Hawaii, Puerto Rico, U.S. Territories, U.S. PO Boxes, and APO/FPO/DPO addresses. International packages are not supported. Commercial delivery is not the service’s intended use case. Any of these can quietly disqualify shipments your operations team assumed were eligible, which is why your warehousing services and provider choice need to align with your carrier rules and service mix.
A Cheaper Label Can Create Higher Customer-Service Costs
Label cost is not the same as total operational cost. A Ground Saver shipment that saves fifty cents on postage but generates a “where is my order” support ticket, a replacement, or a negative review because the package did not arrive when the customer expected has produced a net loss for the business.
The costs that do not appear on the label include:
- Support tickets and chat inquiries from customers watching a tracking page that has gone quiet during a carrier handoff.
- Labor spent investigating shipment exceptions and coordinating with two carriers instead of one.
- Replacements or refunds on late deliveries when a customer-facing delivery estimate does not match the service you selected, especially if the promised delivery speed set a different expectation.
- Negative reviews and marketplace metrics damage when the delivery experience feels slower or less predictable than the customer expected.
- Lifetime-value erosion from customers who quietly stop reordering.
None of these are unique to Ground Saver, but the service concentrates the risk in a specific segment of orders. A small per-label saving needs a large number of clean shipments to pay for a single mishandled one, especially when you factor in the extra effort required to resolve carrier shipment exceptions quickly.
When Ecommerce Sellers Should Use UPS Ground Saver
Consider assigning an order to Ground Saver when all of the following are true and the tradeoff makes sense for that shipment:
- Shipment value sits comfortably under the $50 included coverage, or you have independent insurance covering the gap so you can maintain control through coverage rules.
- The package is lightweight and within Ground Saver’s eligible size envelope for lightweight packages.
- The destination is a residential address for residential deliveries, a qualifying U.S. PO Box, or an APO, FPO, or DPO address.
- The customer-facing delivery estimate at checkout accommodates the additional one to two business days.
- Signature confirmation is not required.
- The order is not tied to a strict promised delivery date.
- The rate comparison, including surcharges, shows a meaningful net saving over UPS Ground on this specific package and lane.
Example: a low-value household item weighing under two pounds, going to a residential customer with a “delivered in 5 to 8 business days” estimate at checkout. That order does not need the additional speed or coverage of UPS Ground, and the savings are worth taking. Another candidate: a qualifying lightweight shipment going to a PO Box or military address, including those generated from Google Shopping order fulfillment workflows. UPS Ground does not deliver to those addresses at all, so USPS participation through Ground Saver is often the operational reason to use the service.
When Ecommerce Sellers Should Keep UPS Ground
Keep UPS Ground on any order that meets any of the following, especially when slower economy transit is not appropriate for urgent deliveries:
- Merchandise value is materially above $50 and the coverage gap matters.
- The order was sold with a specific or tight delivery promise.
- The package is heavier or larger than the Ground Saver envelope.
- The order requires signature on delivery.
- The destination is a commercial address.
- Ground Saver savings are small once surcharges are included.
- The customer segment is sensitive to tracking gaps, delivery timing, or brand experience.
Sample profile: a $300 electronics order. The label saving from Ground Saver is a rounding error next to the cost of a lost or damaged shipment, a support escalation, or a replacement, so paying more for UPS Ground makes sense when timing sensitivity or replacement risk is high. UPS Ground’s end-to-end handling, broader coverage options, and predictable transit are worth the extra postage.
How to Automate the Decision at Scale
Once an operation moves past a few hundred orders per day, choosing a shipping service manually stops being viable, and many brands turn to specialized order fulfillment services for ecommerce companies to keep decisions consistent. The decision needs to be enforced by rules that look at the actual order rather than the label alone, giving merchants more control over shipping choices at scale. That rule set should also be easy to adjust when carrier rules change.
A workable rate-shop model compares, at minimum, and is usually easiest to execute with multi-carrier shipping software for ecommerce:
- Eligible services for the destination, including PO Box, military-address filters, and other qualifying residential addresses.
- Actual label cost by service, including known surcharges rather than base rate only.
- Package weight and dimensions against each service’s eligibility.
- Order value against included coverage, plus any external insurance policy.
- Residential or commercial classification at the destination.
- The customer-facing delivery estimate shown at checkout, so the selected service does not silently break the promise of when the order is expected to arrive.
- Any customer-selected shipping method paid for at checkout, which typically overrides the rate shop.
That is the layer ecommerce shipping software and ecommerce order fulfillment services that outclass traditional 3PLs are built for, and it helps merchants control how options appear to customers at checkout. Instead of assigning Ground Saver to every order that would fit it on paper, the system evaluates each order against the criteria above and picks the service that produces the best result on total cost and delivery expectation. Cahoot helps merchants automate this kind of service selection so the right orders get the economy service and the wrong ones do not, including qualification rules tied to how shipments are tendered and packages picked.
It is also worth pairing service selection with regular surcharge and contract reviews, especially when you are working to bring overall order fulfillment costs for ecommerce down. Sellers with meaningful UPS volume often benefit from a periodic effort to mitigate UPS and FedEx surcharges alongside service-mix optimization, and understanding the broader factors that drive parcel costs such as zones, fuel, residential delivery, and remote-area fees helps determine which orders truly benefit from an economy tier.
Frequently Asked Questions
Is UPS Ground Saver cheaper than UPS Ground?
Ground Saver is often cheaper on qualifying lightweight residential shipments, but it is not universally cheaper. Surcharges, dimensional weight, and package profile can narrow or reverse the base-rate advantage. Compare actual all-in cost, not published base rates.
How much slower is UPS Ground Saver?
UPS describes Ground Saver transit times as typically comparable to UPS Ground plus approximately one to two additional business days. Actual transit varies by origin, destination, and when the shipment is tendered to UPS. Delivery generally occurs Monday through Saturday.
Does USPS deliver UPS Ground Saver packages?
Sometimes. This handoff is part of the service’s last mile delivery model. UPS Ground Saver packages may be delivered by UPS or by USPS depending on the destination. USPS participation is what allows eligible PO Boxes and military addresses to be served, but USPS does not handle every Ground Saver package.
Does UPS Ground Saver include tracking?
Yes. Ground Saver shipments include package-level tracking through a UPS tracking number, with visibility available while the package is in the UPS network and, where applicable, during USPS final delivery.
What happened to UPS SurePost?
UPS SurePost was renamed UPS Ground Saver. The core positioning as an economy option for less-urgent shipments carried over, but service details, delivery model, coverage, and eligibility have been updated. Do not apply old SurePost rules to Ground Saver without verifying against current UPS documentation.
Can UPS Ground Saver deliver to PO Boxes?
Yes. Eligible U.S. PO Boxes are supported through USPS participation in final delivery. UPS Ground does not deliver to PO Boxes, so Ground Saver is often the practical option for those addresses.
Can UPS Ground Saver deliver to APO, FPO, and DPO addresses?
Yes. APO, FPO, and DPO addresses are supported through USPS final delivery. UPS Ground does not serve those addresses directly.
What is the coverage limit for UPS Ground Saver?
UPS Ground Saver includes up to $50 of loss or damage coverage per package, subject to UPS’s terms and conditions. Shipments worth more than $50 should either move to a different service or carry independent parcel insurance to cover the gap.
Is UPS Ground Saver reliable?
Ground Saver is a production UPS service with package-level tracking and defined transit expectations. It can be reliable for the shipment profile it was designed for. It is less reliable as a general-purpose service, particularly when assigned to heavier, higher-value, or delivery-promise-sensitive orders it was not designed to carry.
Which service is better for ecommerce sellers?
Neither service is universally better. UPS Ground Saver is an economical alternative for lightweight, lower-value, non-urgent residential orders and qualifying PO Box and military-address shipments. UPS Ground fits heavier, higher-value, commercial, or delivery-promise-sensitive orders where delivery speed matters more. The right answer at scale is to automate the selection using order attributes rather than defaulting the entire book of business to either service.
Written By:
Indy Pereira
Indy Pereira helps ecommerce brands optimize their shipping and fulfillment with Cahoot’s technology. With a background in both sales and people operations, she bridges customer needs with strategic solutions that drive growth. Indy works closely with merchants every day and brings real-world insight into what makes logistics efficient and scalable.
Turn Returns Into New Revenue
Related Articles
What is DHL eCommerce and Why It’s Important for Online Sellers
DHL eCommerce provides shipping solutions for online businesses worldwide.
Seller Fulfilled Prime for Oversized Items: The FBA vs. SFP Math Sellers Need to Run
Seller Fulfilled Prime can work for oversized and bulky items, but it is not automatically cheaper than FBA.
How Businesses Ship So Cheap: The Reality Behind Commercial Shipping Rates
When small ecommerce merchants compare their shipping costs to what large brands appear to pay, the gap feels insurmountable.
USPS Ground Advantage vs Priority Mail: Which Shipping Service Should Ecommerce Sellers Use?
In this article
14 minutes
- USPS Ground Advantage vs Priority Mail: The Short Answer
- USPS Ground Advantage vs Priority Mail Comparison Table
- What Is USPS Ground Advantage?
- What Is Priority Mail?
- Ground Advantage Usually Wins on Cost When Delivery Is Flexible
- Priority Mail Is Worth Considering When Speed or Packaging Matters
- Flat Rate Packaging Can Change the Cost Equation
- Do Both Services Include Tracking and Insurance?
- Accurate Dimensions Matter More Than Sellers Think
- How Ecommerce Sellers Should Choose Between Ground Advantage and Priority Mail
- Why Service Selection Should Not Be Manual at Scale
- Frequently Asked Questions
For most ecommerce sellers, USPS Ground Advantage is the more economical default for lightweight, non-urgent domestic parcels with a 2 to 5 business day delivery window, while Priority Mail is the better fit when faster delivery is needed, Flat Rate packaging lowers the cost, or a customer is paying for expedited shipping. Neither service wins every order. The right pick depends on package weight, dimensions, zone, delivery promise, and margin.
That is the operational reality behind the usps ground advantage vs priority mail decision. Choosing the wrong service affects shipping cost, delivery speed, and customer satisfaction, so small pricing mistakes can turn into lower margins or delayed orders at scale. This comparison is written for ecommerce sellers who need a practical way to choose between the two for domestic parcels, including delivery speed, pricing, Flat Rate boxes, tracking and insurance, best use cases, and how to select the right service based on the order and the customer expectation.
USPS Ground Advantage vs Priority Mail: The Short Answer
Ground Advantage is usually the cheaper choice for standard domestic parcels when a 2 to 5 business day delivery window is acceptable. Priority Mail is usually the better choice when the delivery promise is tighter, when the customer is paying for expedited shipping, or when a heavy but compact item fits inside Flat Rate packaging that flattens the zone-based math.
Neither service is universally superior. Both include USPS Tracking and up to $100 of insurance on most shipments. Both can handle packages up to 70 lbs. The difference shows up in delivery speed, packaging options, and how the rates behave against your specific weight, dimensions, and zone.
Let AI Optimize Your Shipping and Boost Profits
Cahoot.ai software selects the best shipping option for every order—saving you time and money automatically. No Human Required.
See AI in ActionUSPS Ground Advantage vs Priority Mail Comparison Table
| Feature | USPS Ground Advantage | USPS Priority Mail |
| Delivery speed | 2 to 5 business days | Typically 2 to 3 business days |
| Cost tendency | Often lower for standard parcels with flexible delivery | Often higher, but can win with Flat Rate or small dense packages |
| Weight limit | Up to 70 lbs | Up to 70 lbs on most shipments |
| Tracking | Included | Included |
| Insurance | Up to $100 included | Up to $100 included on most shipments |
| Flat Rate packaging | Not available | Flat Rate envelopes and boxes supported |
| Best use cases | Lightweight parcels, non-urgent orders, margin-sensitive SKUs, returns | Speed-sensitive orders, heavy items in Flat Rate, small dense products |
| Main seller caveat | Delivery window is a range, not a promise | Cost can climb quickly with weight and distance without Flat Rate |
What Is USPS Ground Advantage?
USPS Ground Advantage is a domestic shipping service, and USPS launched Ground Advantage by consolidating older economy options into one product. It replaced First-Class Package Service, USPS Retail Ground, Parcel Select Ground, and other retail ground offerings. It handles parcels up to 70 lbs with an expected delivery window of 2 to 5 business days, and it includes USPS Tracking and up to $100 of insurance at no extra cost. It is the only USPS service for certain hazardous materials that must travel by ground, including lithium batteries.
For ecommerce sellers, Ground Advantage is the workhorse service for orders where the customer does not need it tomorrow. It typically wins on cost for the kinds of parcels most online retailers ship every day: lightweight, standard-shaped, and destined for residential addresses. Because tracking and basic insurance are included, sellers do not have to bolt on extra services to get the visibility their customers expect, which is especially important on marketplaces like Google Shopping where delivery and shipping order fulfillment performance directly influences conversion.
What Is Priority Mail?
Priority Mail is USPS’s faster domestic package service because priority mail delivers sooner by using air and ground transportation, typically arriving in 1 to 3 business days. Like Ground Advantage, it includes USPS Tracking and up to $100 of insurance on most shipments, and it supports packages up to 70 lbs.
What sets Priority Mail apart is flat rate shipping. USPS provides free Priority Mail boxes and a USPS flat-rate envelope with flat rate pricing, so those packages ship at a fixed price regardless of weight within the package limit or destination zone. For heavy or dense products that fit those packages, Flat Rate can dramatically undercut what weight-based pricing would produce. Sellers also use Priority Mail when a marketplace expects faster delivery, when the buyer paid for expedited shipping, or when a tighter delivery promise justifies the higher base cost. If you buy labels directly from USPS, the process is covered in more detail in our USPS Click-N-Ship guide. It is the better shipping option when faster delivery times matter.
Ground Advantage Usually Wins on Cost When Delivery Is Flexible
The pattern most ecommerce operations settle into is that Ground Advantage handles the bulk of standard orders, and Priority Mail handles the exceptions. That works because the shipments Ground Advantage is designed for line up neatly with what most online retailers actually ship, making it a preferred shipping option for non urgent shipments when shipping costs start at $4.75 at retail.
- Lightweight parcels that used to move under First Class Package Service, alongside the broader class mail and USPS First Class Mail category sellers often compared historically, including USPS First Class for letters and small mailpieces.
- Non-urgent orders where the customer has not paid for faster delivery.
- Margin-sensitive SKUs where every dollar of shipping cost matters.
- Free shipping offers, where the seller is absorbing the label cost.
- Returns, where speed is less critical than keeping the reverse logistics affordable.
USPS Ground Advantage packages typically move in 2 to 5 business days; ground advantage packages also support saturday delivery, but usps ground advantage deliver schedules do not include Sundays.
Returns are worth calling out separately. When a customer sends an item back, the delivery window is rarely the deciding factor, and cost usually is. Ground Advantage often makes the most sense for prepaid return labels, though the mechanics of setting those up are covered in more depth in our guide on how return shipping labels work.
ShipStation vs. Cahoot: 21x Faster, Real Results
Get the inside scoop on how a leading merchant switched from ShipStation to Cahoot—and what happened next. See it to believe it!
See the 21x DifferencePriority Mail Is Worth Considering When Speed or Packaging Matters
Priority Mail earns its cost when this shipping service can justify higher rates through faster delivery times, packaging advantages, or tighter promises that support customer satisfaction.
- Tighter delivery promises, such as a two-day expectation on a product page or checkout page.
- Customer-paid expedited shipping, where the buyer chose and paid for the faster option.
- Marketplace delivery expectations that lean toward faster service levels.
- Heavier products that fit inside a Priority Mail Flat Rate box.
- Small dense products that price well under Priority Mail’s cubic-based commercial options because of package volume.
Small dense items are the classic case where Priority Mail can quietly beat expectations. A five-pound product in a compact box may cost more under weight-based pricing but qualify for Priority Mail Cubic pricing under commercial plans, changing the math entirely.
Flat Rate Packaging Can Change the Cost Equation
Priority Mail Flat Rate is one of the most misunderstood tools in USPS pricing. The rule is simple: if it fits in the box, and it is within the weight limit, it ships at the same price to any domestic zone. That fixed-price model contrasts with zone based pricing, where cost changes by distance and weight, so the advantage depends on how far the package is going and how heavy it is.
A dense five- or ten-pound product that fits in a medium Flat Rate box can ship to the other side of the country at a price that weight- and zone-based services simply cannot match. A USPS flat-rate envelope can also beat weight-based pricing for compact, heavy items that fit within its limits. On short zones with lighter items, Flat Rate almost always loses. The trick is knowing which SKUs actually benefit, and packing them accordingly. Our breakdown of USPS Flat Rate Boxes walks through the box sizes and the scenarios where each one earns its keep.
Do Both Services Include Tracking and Insurance?
Yes. USPS Ground Advantage and Priority Mail both include USPS Tracking and up to $100 of insurance on most shipments, with no extra charge and no separate purchase required. For most ecommerce orders, that baseline is enough.
Sellers should still pay attention to a few practical details. The $100 included coverage will not be enough for high-value items, and additional insurance coverage can be purchased up to $5,000 when it makes sense. Claims require proof of value and evidence of loss or damage, so keeping order records and packaging photos accessible is worth the small operational effort. If proof of mailing or delivery documentation matters, services such as certified mail may also be available separately depending on the shipment type. For a deeper look at how the tracking data flows and how to use it in customer communications, see our USPS Tracking explained article, and many merchants also review order fulfillment services reviews when evaluating partners to help manage these shipping and claims workflows.
Accurate Dimensions Matter More Than Sellers Think
Package dimensions are quietly one of the biggest drivers of shipping cost accuracy. Package size limits still apply, and the maximum combined length and girth is 130 inches. Dimensional weight, or DIM weight, is the pricing model carriers use to charge for the space a package occupies rather than just its physical weight. A light but bulky box can end up priced as if it weighed several pounds more. Ground Advantage and Priority Mail both use dimensional pricing above certain size thresholds, so understating the dimensions of a package can produce label prices that do not match what USPS actually charges.
This matters even more now that USPS is expanding requirements for accurate parcel dimensions in shipping manifests, with updated dimension reporting requirements taking effect July 12, 2026. Sellers who have been rounding down, guessing, or reusing old dimension data on their SKUs will want to clean up their product data before those changes tighten. Beyond compliance, accurate dimensions produce accurate rate shopping, which is the foundation of every automated service selection decision downstream. This is a common area where hidden shipping fees quietly erode margin.
How Ecommerce Sellers Should Choose Between Ground Advantage and Priority Mail
The decision is easier when comparing USPS Ground Advantage for shipping decisions through a few operational checks rather than relying on a general preference for one service, especially when you are already using multi-carrier shipping software for ecommerce to automate rate comparisons.
- Start with the promised delivery date on the order. If the buyer expects delivery in three business days or less, Priority Mail is often the safer choice because faster delivery times usually matter most.
- Check actual package weight and dimensions, not estimates. The right service can flip on a single pound or a single inch.
- Compare zone and commercial rates for the specific shipment, whether you buy labels online or drop off at the post office. Ground Advantage often wins on short zones, but not always.
- Test Flat Rate when the item is heavy and compact. If it fits, run the numbers before defaulting to weight-based pricing.
- Consider customer expectations and margin. A low-margin order with a flexible delivery window is a Ground Advantage candidate. A customer-paid expedited order is a Priority Mail candidate.
- Use shipping software or fulfillment logic instead of choosing manually. Rate shopping across services and carriers on every order is only realistic through automation, and a streamlined shipping process with ecommerce fulfillment software can improve customer satisfaction for ecommerce businesses and ecommerce sellers.
It is also worth remembering that USPS is not the only economical ground option. For some shipments, alternatives like UPS Ground Saver deserve a spot in the rate shopping comparison, especially at higher volumes or on specific lanes. That is also useful when comparing USPS Ground Advantage against other low-cost services for non-urgent shipments.
Cut Costs with the Smartest Shipping On the Market
Guranteed Savings on EVERY shipment with Cahoot's AI-powered rate shopping and humanless label generation. Even for your complex orders.
Cut Costs TodayWhy Service Selection Should Not Be Manual at Scale
Choosing between USPS Ground Advantage and Priority Mail on a single order is straightforward. Doing it correctly across thousands of orders a day, with different weights, dimensions, zones, marketplaces, delivery promises, and margin profiles, is not something a human should be doing order by order, and free package pickup through USPS Package Pickup can also support higher-volume operations without extra trips; many brands instead rely on order fulfillment services for ecommerce companies to handle this complexity.
At any real volume, service selection belongs to shipping rules and rate shopping logic. For automation-focused teams, that pickup convenience matters too because it removes manual handoff steps from shipping decisions. That means clean product dimension and weight data, accurate delivery promises tied to each order source, real-time rate comparison across carriers and service levels, and the ability to route each order to the fulfillment location that produces the best combination of cost and delivery date. Platforms that provide ecommerce order fulfillment services help ecommerce brands make those fulfillment and shipping decisions automatically based on inventory location, package profile, carrier options, and delivery promises, so the right USPS service (or non-USPS service) gets chosen on every order without a human deciding one label at a time.
Frequently Asked Questions
Is USPS Ground Advantage cheaper than Priority Mail?
Ground Advantage is usually cheaper for standard parcels when a 2 to 5 business day delivery window is acceptable. At retail, USPS Ground Advantage starts at $4.75, so shipping costs are often lower, while Priority Mail may still win when Flat Rate pricing benefits the shipment. Priority Mail can still be cheaper on heavy items that fit Flat Rate packaging, and on some small dense parcels priced under commercial cubic rates.
Is Priority Mail faster than Ground Advantage?
Yes, typically. Priority Mail is positioned around a 2 to 3 business day delivery timeframe and uses air and ground transportation, while Ground Advantage is 2 to 5 business days and relies on ground transportation and ground transport. Neither is a guaranteed delivery date. Priority Mail is usually the better choice for urgent orders, while Ground Advantage fits non-urgent shipments.
Does USPS Ground Advantage include tracking?
Yes. USPS Tracking is included with Ground Advantage at no additional cost.
Does Priority Mail include insurance?
Most Priority Mail shipments include up to $100 of insurance at no extra cost. Additional coverage can be purchased for higher-value items.
Can I use Priority Mail Flat Rate boxes with Ground Advantage?
No. Flat Rate packaging is a Priority Mail feature. Ground Advantage uses your own packaging priced by weight, dimensions, and zone. It does not support flat rate shipping or a USPS flat-rate envelope.
Which USPS service is better for ecommerce sellers?
Neither service is universally better. Ground Advantage is often the default for lightweight, non-urgent orders, and it is often the better choice for USPS Ground Advantage packages going to PO Boxes, military addresses, and military bases when speed is not urgent. Priority Mail is a better fit when speed, Flat Rate packaging, or tighter delivery promises are involved. For ecommerce sellers, the right choice also affects shipping costs and customer satisfaction. The best approach is automated rate shopping on every order.
Is USPS Ground Advantage good for returns?
Yes. Returns rarely require fast delivery, so Ground Advantage often makes sense on prepaid return labels where cost is the priority.
Should ecommerce sellers use USPS for every order?
No. USPS is competitive on many lightweight and residential parcels, but not every lane or package profile. Some sellers still compare Ground Advantage with older USPS services at the post office, but current shipping decisions should be based on live rates and delivery needs. Sellers at scale should rate shop across USPS and other carriers rather than defaulting to a single provider, and many rely on a distributed network of US fulfillment centers for ecommerce fulfillment services to keep parcels close to customers while controlling costs.
Written By:
Indy Pereira
Indy Pereira helps ecommerce brands optimize their shipping and fulfillment with Cahoot’s technology. With a background in both sales and people operations, she bridges customer needs with strategic solutions that drive growth. Indy works closely with merchants every day and brings real-world insight into what makes logistics efficient and scalable.
Turn Returns Into New Revenue
Related Articles
What is DHL eCommerce and Why It’s Important for Online Sellers
DHL eCommerce provides shipping solutions for online businesses worldwide.
Seller Fulfilled Prime for Oversized Items: The FBA vs. SFP Math Sellers Need to Run
Seller Fulfilled Prime can work for oversized and bulky items, but it is not automatically cheaper than FBA.
How Businesses Ship So Cheap: The Reality Behind Commercial Shipping Rates
When small ecommerce merchants compare their shipping costs to what large brands appear to pay, the gap feels insurmountable.
Which SKUs Should Not Be in Seller Fulfilled Prime?
In this article
16 minutes
- Seller Fulfilled Prime Is a SKU-Level Decision
- Keep SKUs Out of SFP When They Cannot Ship Economically Through Parcel
- Avoid SKUs Where Premium Shipping Can Wipe Out the Margin
- Be Careful With Low-Volume SKUs That Make Every Late Package Matter
- Exclude SKUs Whose Size Tier Requires More Coverage Than Your Network Can Provide
- Do Not Choose SKUs Just Because FBA Looks Expensive
- Picking the Right SKU Is Only Half the Battle
- Final Rule: Put Only Resilient SKUs Into SFP
- Frequently Asked Questions
Seller Fulfilled Prime SKUs are the individual products an Amazon seller chooses for SFP based on whether each one can protect both the Prime promise and the seller’s margin. The SKUs that should not be in Seller Fulfilled Prime are the ones that cannot do both. That usually includes SKUs that are too large for parcel shipping, too low-margin to absorb premium shipping, too low-volume to survive delivery exceptions, or too geographically demanding for the seller’s fulfillment network.
That is the mistake many Amazon sellers and e-commerce operators make when they evaluate SFP. They look at a high FBA fee, a product with decent demand, or the potential upside of the Prime badge and assume the SKU belongs in Seller Fulfilled Prime. Sometimes that is true. But sometimes the SKU that looks attractive on paper becomes the one that burns margin, creates late deliveries, or puts SFP metrics at risk.
Seller Fulfilled Prime is not a catalog-wide strategy. It is a SKU-level operating decision for sellers managing SKU selection, fulfillment operations, and margin control. The goal is not to put every possible product into SFP. The goal is to identify the SKUs that can repeatedly hit the Prime delivery promise at a sustainable cost. That means evaluating shipping feasibility, margin resilience, order volume, fulfillment footprint, and operational readiness before a SKU is enrolled. This article focuses on how to decide which SKUs should and should not be included in Seller Fulfilled Prime so you can protect Prime status, avoid performance failures, and keep SFP profitable.
Slash Your Fulfillment Costs by Up to 30%
Cut shipping expenses by 30% and boost profit with Cahoot's AI-optimized fulfillment services and modern tech —no overheads and no humans required!
I'm Interested in Saving Time and MoneySeller Fulfilled Prime Is a SKU-Level Decision
A strong Seller Fulfilled Prime strategy usually starts with exclusion, not inclusion. Before asking which products should go into Seller Fulfilled Prime (SFP), sellers should ask which products clearly should not, since seller fulfilled prime skus display the Prime badge while remaining seller fulfilled.
That filter matters because every SKU behaves differently. Two products can have the same sales velocity and completely different fulfillment profiles. One may fit neatly into a standard parcel network with predictable ground coverage. Another may require oversized packaging, special handling, premium shipping, or inventory placement across more fulfillment nodes than the seller actually has.
A SKU should not be selected for SFP only because:
- FBA fees look expensive
- The Prime badge may improve conversion
- The seller wants more inventory control
- A warehouse or 3PL says it offers two-day shipping
- The SKU sells well through another fulfillment model
Those may be reasons to investigate SFP. They are not enough to prove that SFP will work. For third party sellers, prime offers can make listings prime eligible, and seller fulfilled prime offers often have greater visibility and sales potential than standard FBM items. Each SKU still has to pass the operational test: Can this product hit the delivery promise without relying on constant exceptions, expensive upgrades, or manual heroics?
Keep SKUs Out of SFP When They Cannot Ship Economically Through Parcel
The clearest example is an extra-large product that looks expensive in FBA but does not actually fit normal parcel shipping.
Take a projector screen that is 117 inches long. At first glance, this can look like a perfect Seller Fulfilled Prime candidate. If FBA is charging more than $50 per order to fulfill the item, moving it out of FBA may seem like an obvious way to save money.
But the shipping reality changes the calculation. UPS lists a maximum package length of 108 inches, and FedEx Ground lists packages up to 108 inches in length and 165 inches in length plus girth. A 117-inch projector screen exceeds that normal parcel length limit.
That means the seller is no longer comparing FBA against ordinary parcel shipping. The real comparison is FBA versus freight, LTL, special handling, limited carrier options, or some other non-parcel shipping setup. Unless the seller has very strong LTL rates and a fulfillment process built to ship freight on every order, SFP may not be a good idea for that SKU.
This is why high FBA fees do not automatically make a product a good SFP candidate. A $50-plus FBA fee may be painful, but it can still be cheaper and more predictable than trying to force a non-parcel item into a Prime delivery promise.
For oversized and extra-large products, the first question should not be “Is FBA expensive?” It should be “Can we ship this product through a reliable carrier method, at the required speed, without destroying the margin?”
If the answer is no, that SKU should probably stay out of Seller Fulfilled Prime.
Avoid SKUs Where Premium Shipping Can Wipe Out the Margin
Some SKUs are technically shippable through parcel but still too fragile for Seller Fulfilled Prime economics.
The issue is not the average order. The issue is the exception order. A SKU may look profitable when most orders ship by ground, but SFP does not only test the easy orders. It also exposes the seller to orders that require air service, faster shipping, longer zones, or Premium Shipping options through less efficient fulfillment nodes.
A practical stress test is to model normal ground shipping around $18, then ask what happens if 2% of orders require air service at $23 to $47. Then stress-test the same SKU at 5% and 10% premium-shipping exposure.
If the SKU still works under those scenarios, it may deserve further evaluation. If the SKU only works when every order ships by cheap ground, it is too fragile for SFP.
That is especially true for low-margin products. A few premium shipments can erase the profit from many normal orders, especially because prime customers expect fast and free shipping, and when those exception shipments stack up, SFP sellers can face high shipping costs compared to FBA, with high shipping fees quickly pushing up total shipping costs. Sellers who only compare FBA fees against average ground rates may miss the real risk: Seller Fulfilled Prime economics are shaped by the expensive tail of orders, not just the average shipment.
Before enrolling a SKU, sellers should model the downside cases. What happens when the order has to go farther than expected? What happens when the nearest fulfillment node is out of stock? What happens when the delivery promise requires air? What happens when carrier pricing changes?
If the SKU cannot survive those scenarios, it should not be in SFP yet. For a deeper look at the margin side of this decision, see Cahoot’s guide to Seller Fulfilled Prime economics and profit math.
Looking for a New 3PL? Start with this Free RFP Template
Cut weeks off your selection process. Avoid pitfalls. Get the only 3PL RFP checklist built for ecommerce brands, absolutely free.
Get My Free 3PL RFPBe Careful With Low-Volume SKUs That Make Every Late Package Matter
Low-volume SKUs can create a different kind of SFP risk: metric volatility.
A SKU producing 25 SFP orders per week gives the seller very little room for delivery exceptions. One late delivery may be survivable. Two delayed packages can quickly become a metrics problem, even if the warehouse shipped the orders correctly.
That is what makes low-volume SFP selection tricky. The SKU may be operationally simple. It may fit parcel shipping. It may even have decent margin. But if the order volume is too low, every carrier issue carries more statistical weight.
This does not mean low-volume SKUs can never work in Seller Fulfilled Prime. It means sellers should be careful about using them as trial SKUs or relying on them to prove SFP performance. A small number of exceptions can make performance look worse than the underlying operation really is.
The key question is whether the SKU has enough volume to absorb normal carrier noise. No fulfillment operation can prevent every late scan, weather delay, missed pickup, or carrier issue. If one or two events can materially hurt the seller’s SFP metrics, the SKU may not be resilient enough for the program, and visible delivery misses can also hurt customer satisfaction and customer trust.
This is also where carrier performance matters. Sellers should understand how carrier on-time delivery affects Seller Fulfilled Prime metrics, but the SKU-selection takeaway is simple: avoid SFP candidates where a tiny number of delayed packages can create an outsized performance problem.
Exclude SKUs Whose Size Tier Requires More Coverage Than Your Network Can Provide
Standard-size, oversize, and extra-large SKUs are not operationally equivalent in Seller Fulfilled Prime. Size tier affects shipping cost, delivery feasibility, carrier options, inventory placement, and how much fulfillment coverage the seller may need.
This becomes even more important as Amazon tightens SFP speed requirements. Beginning July 6, 2026, the delivery-speed bar increases across key size tiers. Sellers must enable Prime shipping in their shipping template for configured delivery regions, including one-day and two-day delivery commitments, and still ship Prime orders within 2 days to qualify. Sellers should not treat that as a generic program update. They should treat it as a SKU-selection filter.
A standard-size SKU with strong ground coverage from a few nodes may be a reasonable SFP candidate. An oversize or extra-large SKU may require a much broader fulfillment footprint to offer premium shipping options across the configured delivery regions and hit the same customer promise economically. The product may not be wrong for SFP in theory, but it may be wrong for the seller’s current network.
That is where some sellers get caught. A two-warehouse setup may look sufficient on a spreadsheet, especially if the seller is only thinking about average delivery distance. But for serious Seller Fulfilled Prime coverage, some sellers may need four or more fulfillment nodes. Strong one-day coverage can require six.
The point is not that every seller needs six warehouses. The point is that the SKU’s physical profile and the seller’s fulfillment footprint have to match. If the SKU requires geographic coverage the seller does not have, or coverage that does not align with its configured delivery regions, SFP can push the operation into expensive shipping upgrades, missed promises, or both, and the Prime shipping benefits depend on matching the SKU’s size tier to coverage that supports fast and free delivery economically.
For sellers evaluating outside help, this is also why “two-day shipping” is not enough. A provider may offer fast shipping in a general sense, but Seller Fulfilled Prime requires performance against the seller’s specific SKUs, size tiers, customer geography, cutoff times, inventory placement, and margin profile. Cahoot’s guide to choosing a Seller Fulfilled Prime 3PL goes deeper on that provider-selection problem.
Do Not Choose SKUs Just Because FBA Looks Expensive
High FBA fees are a reason to investigate Seller Fulfilled Prime, not proof that SFP is better, especially since SFP listings can increase sales by over 50% on average in some cases and the economics deserve investigation rather than assumptions.
This is one of the most important SKU-selection lessons. FBA may look expensive because Amazon is absorbing complexity that the seller would otherwise have to handle. In some cases, seller fulfilled prime worth comes from better margins on certain SKUs by avoiding FBA storage fees and, at times, Amazon storage and removal fees. That complexity may come from product size, dimensional weight, delivery geography, packaging, handling requirements, or the cost of meeting a fast delivery promise.
The 117-inch projector screen example makes this clear. A $50-plus FBA fee may look like the problem. But once the seller realizes the item exceeds the normal 108-inch parcel length limit, the FBA fee starts to look different. It may be reflecting the cost and complexity of fulfilling that item at scale.
A SKU with high FBA fees may still be a bad SFP candidate if:
- It exceeds parcel length or weight limits
- It requires LTL, freight, or special handling
- It needs frequent air shipping to hit the Prime promise
- It has too little margin to absorb exceptions
- It has too little volume to absorb delivery volatility
- It requires more fulfillment coverage than the seller currently has
The better approach is to treat FBA fees as a signal, not a conclusion. If the fee is high, investigate why. If the SKU can be shipped faster and cheaper through a strong SFP network, and control across broader sales channels matters to the business, it may be worth testing. If the SKU only looks good before freight, premium shipping, or metric risk is included, keep it out.
Picking the Right SKU Is Only Half the Battle
Even after sellers exclude poor SFP candidates, SKU selection is still only the first filter. A SKU can be a good SFP candidate on paper and still fail during the trial period if the fulfillment operation is not ready for Seller Fulfilled Prime’s strict readiness standards. Sellers also need an amazon professional seller account and must pre qualify before entering the trial.
Inventory has to be received, counted, synced, and available in the right fulfillment nodes. Cutoff times and routing logic have to prevent avoidable premium-shipping decisions. Carrier on-time delivery has to protect SFP metrics even when the warehouse ships on time. Weekend operations and same-day fulfillment discipline still have to work consistently, and they are often necessary to protect timely deliveries during the 30-day trial period.
The same caution applies to fulfillment partners. A 3PL saying it offers “two-day shipping” does not automatically mean it can protect Seller Fulfilled Prime performance for the seller’s exact SKUs, customer geography, cutoff times, and margin profile.
These are not SKU-selection failures. They are readiness issues. But they still matter because the wrong operating model can make even a good SFP SKU perform badly.
Before enrolling, sellers also need a plan in seller central to identify and fulfill prime trial orders at trial volume, including weekend coverage and reliable cutoff control. Teams should look for prime trial orders there and process them correctly before cutoff. The 30-day trial requires at least 100 Prime packages with a 99% on-time shipment rate and a cancellation rate below 0.5%, and sellers can attempt it up to three times per year. Sellers should also monitor prime order volume so the operation can handle trial demand consistently. It also requires a 93.5% on-time delivery rate, a valid tracking rate above 95%, strong valid tracking, and use of amazon buy shipping services on at least 98.5% of orders so teams can buy shipping through Amazon and generate compliant shipping labels consistently. Shipping settings automation can help protect delivery promises and performance during the trial.
Once you have excluded the SKUs that clearly do not belong in Seller Fulfilled Prime, use Cahoot’s Seller Fulfilled Prime trial checklist to evaluate whether your operation is actually ready to support the SKUs that remain. The checklist covers the broader readiness questions that should come after SKU filtering, including inventory readiness, delivery promises, operational setup, and trial preparation.
Scale Faster with the World’s First Peer-to-Peer Fulfillment Network
Tap into a nationwide network of high-performance partner warehouses — expand capacity, cut shipping costs, and reach customers 1–2 days faster.
Explore Fulfillment NetworkFinal Rule: Put Only Resilient SKUs Into SFP
A good SFP SKU is not simply a SKU with high FBA fees or high Prime upside. It is a SKU that can repeatedly hit the promise inside seller fulfilled prime sfp, let third party sellers ship prime orders directly from their own warehouse while keeping listings prime eligible, protect margin after exceptions, and fit the seller’s fulfillment footprint without constant heroics.
That is the standard sellers should use before enrolling products in Seller Fulfilled Prime. If a SKU cannot ship economically through parcel, cannot survive prime shipping exposure, has too little volume to absorb normal delivery exceptions while still meeting the promised delivery date, or requires more network coverage than the seller has, it should probably stay out of SFP, because prime eligibility depends on keeping prime offers active through resilient execution, and sellers may need to re enable prime offers after fixing performance issues if Amazon disables them.
The strongest SFP candidates are resilient. They fit the carrier network. They have enough margin to survive exceptions. They generate enough volume to make performance measurable. They match the seller’s fulfillment footprint. And they can be supported by an operating model built for Prime-level execution and ongoing Prime status.
Cahoot helps sellers evaluate and operate Seller Fulfilled Prime with distributed fulfillment, same-day order processing, and the operational discipline required to protect delivery promises. But SFP still starts with the right SKU decision. The best fulfillment network cannot make every product a good SFP candidate, though seller fulfilled prime items can create stronger visibility than standard merchant-fulfilled listings when performance is maintained.
Frequently Asked Questions
Should every SKU be enrolled in Seller Fulfilled Prime?
No. Seller Fulfilled Prime should be evaluated SKU by SKU. Unlike standard FBM, seller fulfilled prime offers are prime items that remain seller fulfilled rather than automatically Prime eligible like FBA listings. The right SFP candidates are products that can protect the Prime promise and preserve margin after shipping exceptions.
Are large and bulky products good candidates for Seller Fulfilled Prime?
Sometimes, but not automatically. Large products may have high FBA fees, which can make SFP worth investigating. But if the product exceeds parcel limits, requires freight, or needs expensive special handling, SFP may not be economical.
Why can high FBA fees still be cheaper than Seller Fulfilled Prime?
High FBA fees may reflect real fulfillment complexity. If moving the SKU to SFP requires premium shipping, freight, broader inventory placement, special handling, or a more complex operating model, the total SFP cost can exceed the FBA fee.
Are low-volume SKUs risky for Seller Fulfilled Prime?
Yes. Low-volume SKUs can be statistically fragile because one or two late deliveries can have an outsized impact on performance metrics. A SKU with only 25 SFP orders per week may not have much room for normal carrier exceptions.
What should I check after choosing potential SFP SKUs?
After choosing candidate SKUs, sellers should check inventory readiness, fulfillment-node coverage, cutoff times, carrier performance, weekend operations, and whether their internal team or fulfillment partner can fulfill orders directly from their own warehouse or node network, since Seller Fulfilled Prime allows shipping directly from sellers’ warehouses while still protecting the Prime promise through the merchant fulfilled network and approved shipping services. Amazon customer service handles customer service inquiries for Prime items even when sellers fulfill them. Sellers should also plan for general return expectations buyers will have, including return shipping labels and the configured return shipping location for seller-fulfilled returns, while noting that the return shipping label sellers must account for can affect costs and workflows, including cases where prime items past the normal window may still be accepted. SKU selection should come before a full SFP readiness review, not replace it.
Written By:

Rinaldi Juwono
Rinaldi Juwono leads content and SEO strategy at Cahoot, crafting data-driven insights that help ecommerce brands navigate logistics challenges. He works closely with the product, sales, and operations teams to translate Cahoot’s innovations into actionable strategies merchants can use to grow smarter and leaner.
Turn Returns Into New Revenue
Related Articles
What is DHL eCommerce and Why It’s Important for Online Sellers
DHL eCommerce provides shipping solutions for online businesses worldwide.
Seller Fulfilled Prime for Oversized Items: The FBA vs. SFP Math Sellers Need to Run
Seller Fulfilled Prime can work for oversized and bulky items, but it is not automatically cheaper than FBA.
How Businesses Ship So Cheap: The Reality Behind Commercial Shipping Rates
When small ecommerce merchants compare their shipping costs to what large brands appear to pay, the gap feels insurmountable.
Prime Day 2026 Results: What Ecommerce Sellers Should Learn from the Numbers
In this article
14 minutes
- Prime Day 2026 proved that summer deal events are now cross-channel
- The headline sales number was strong, but the basket data showed a cautious consumer
- Deal satisfaction fell, which means sellers had to earn the order
- The sales spike is only valuable if fulfillment can keep up
- FBA is useful, but it is not a complete risk-management strategy
- Fast fulfillment is now part of the promotion
- Prime badge strategy matters more when shoppers are comparing
- BNPL growth showed that strong sales do not automatically mean a strong consumer
- Prime Day 2026 should be treated as a rehearsal for Q4
- Key takeaways: What ecommerce sellers should do with the Prime Day 2026 results
- Frequently Asked Questions
Prime Day 2026 results were strong on the surface and more demanding underneath: U.S. online shoppers spent $26.4 billion from June 23 through June 26, up 9.3% year over year, but the bigger lesson for ecommerce sellers is that performance came down to margin control, inventory placement, fulfillment speed, and cross-channel competition—not just deeper discounts.
Prime Day 2026 was not just another Amazon shopping event. It was a four-day stress test for ecommerce sellers, retail competitors, fulfillment networks, and consumers who are still willing to spend when the deal is compelling enough.
According to Adobe Analytics, Day 1 alone reached $8.3 billion in U.S. online spending, making it the biggest U.S. ecommerce day of 2026 so far.
Those headline numbers look strong. But the seller lesson is more complicated than “Prime Day worked.” Shoppers bought early, compared prices across retailers, leaned into low-cost essentials, used financing more often, and spread their attention across Amazon, Walmart, Target, Best Buy, brand sites, and other channels.
For ecommerce sellers and operators planning for the next major retail event, especially Q4, Prime Day has become an operating model problem, not just a promotional calendar event. The brands that win are not necessarily the ones that discount the most. They are the ones that can protect margin, place inventory intelligently, fulfill quickly, and recover after the sales spike without creating stockouts, late shipments, or profitless revenue. That is what this analysis breaks down: the Prime Day 2026 sales data, shopper behavior, pricing and promotion lessons, fulfillment pressure points, inventory planning decisions, and the cross-channel signals that matter for future event strategy.
Slash Your Fulfillment Costs by Up to 30%
Cut shipping expenses by 30% and boost profit with Cahoot's AI-optimized fulfillment services and modern tech —no overheads and no humans required!
I'm Interested in Saving Time and MoneyPrime Day 2026 proved that summer deal events are now cross-channel
Amazon still anchors the event, but Prime Day is no longer contained inside Amazon. In 2026, Walmart Deals, Target Circle Deal Days, Best Buy, and many brand sites competed for the same shopper attention during the same week.
Numerator found that 49% of Prime Day shoppers shopped or planned to shop Walmart Deals, while 32% shopped or planned to shop Target Circle Deal Days. Forrester also reviewed 116 retail and brand websites during the June 23–26 period and found that nearly three out of five participated in the timing or spirit of Prime Day, while four out of five had some form of sale running. During that event period, Amazon Prime Day 2026 ran from June 23 to 26 across 200+ countries.
This matters because the operational requirements of Prime Day are no longer limited to Amazon sellers. A merchant running a sale on Amazon, Walmart, Shopify, Target Plus, TikTok Shop, or a brand-owned storefront may be competing in the same shopping window, even if only one of those channels technically calls it Prime Day.
That is why Cahoot has argued that sellers need to prepare for cross-channel Prime Day demand spikes, not just Amazon order volume. The 2026 results made that point harder to ignore. The event has become a summer retail moment, and sellers need a fulfillment strategy that follows the customer wherever the order is placed.
The headline sales number was strong, but the basket data showed a cautious consumer
The $26.4 billion headline suggests a healthy shopping event. But average order and household-level data tells a more cautious story.
Numerator reported that the average Amazon Prime Day order was $47.66, down 11% from $53.34 in 2025. Average household spend fell to $143.45, down from $156.37 last year. At the item level, 69% of products purchased were under $20, while only 3% were above $100. Numerator also found that 45% of purchases were items shoppers had been waiting to buy, and 46% of surveyed shoppers waited specifically for Prime Day discounts before buying, underscoring the focus on savings. Two thirds of households placed two or more separate orders during the event.
In other words, Prime Day got bigger while the average Amazon basket got smaller. That is an important distinction for sellers. Consumers were willing to shop, but many were still acting carefully. They stocked up on household goods, pet products, drinks, snacks, personal care items, and discounted essentials while selectively buying higher-ticket products when the deal felt strong enough.
For sellers, that means a Prime Day plan built only around aggressive discounting can backfire. A brand may generate volume but still damage contribution margin if it discounts too broadly, spends heavily on ads, or fails to account for fulfillment costs during the spike.
Deal satisfaction fell, which means sellers had to earn the order
Prime Day shoppers were not passive. Numerator found that 59% of shoppers reported high satisfaction with deals in 2026, down from 68% last year. It also found that 93% of shoppers knew it was Prime Day before ordering. And 89% of Prime Day shoppers had shopped a previous Prime Day, pointing to informed shopper behavior. More than half of shoppers also compared prices across retailers before buying.
That changes the seller playbook. A discount by itself is not enough if competitors have similar pricing, better availability, faster delivery, or a clearer value proposition. When shoppers are comparing across Amazon, Walmart, Target, Best Buy, and DTC sites, the winner may be the seller that combines a good enough price with reliable inventory and a delivery promise the shopper trusts.
This is where ecommerce operators need to think beyond the promotion. Prime Day demand is compressed. The shopper may be ready to buy immediately, but they are also ready to leave immediately if the offer looks weak or the shipping date is not competitive.
Looking for a New 3PL? Start with this Free RFP Template
Cut weeks off your selection process. Avoid pitfalls. Get the only 3PL RFP checklist built for ecommerce brands, absolutely free.
Get My Free 3PL RFPThe sales spike is only valuable if fulfillment can keep up
A sales spike is good only if the seller can fulfill profitably and reliably. Otherwise, Prime Day can create the wrong kind of growth: late orders, oversold SKUs, support tickets, stranded inventory, canceled shipments, higher labor costs, and damaged account health.
That is why sellers need to evaluate Prime Day order fulfillment options before the event, not during the event. FBA, MCF, Buy With Prime, FBM, Seller Fulfilled Prime, 3PL fulfillment, and distributed fulfillment each solve different problems. None of them is automatically right for every SKU, channel, or margin profile.
The operational question is not “Which fulfillment method is best?” The better question is: which fulfillment model gives this product the best chance of being profitable, in stock, and delivered on time during a compressed demand window?
For some sellers, that may mean leaning heavily on FBA for Amazon-native Prime demand. For others, it may mean using a hybrid model, thoughtfully balancing FBA versus FBM fulfillment on Amazon, where Amazon inventory, non-Amazon marketplace inventory, and DTC inventory are planned together instead of managed in silos.
FBA is useful, but it is not a complete risk-management strategy
FBA is still one of the most powerful fulfillment systems in ecommerce, especially for Amazon conversion. But Prime Day 2026 showed why sellers should not treat any single fulfillment channel as a complete risk-management strategy.
When demand spreads across multiple channels, inventory locked into one network may not be available where the order actually happens. When FBA capacity, placement, receiving speed, or quantity restrictions become a constraint, sellers can find themselves overstocked in one place and understocked in another.
Cahoot has covered this risk in the context of FBA inventory limits. The same logic applies to Prime Day planning. If a seller cannot send enough inventory into FBA before a major event, or if they also need to support Walmart, Shopify, TikTok Shop, or wholesale demand, then a single-channel inventory plan may leave money on the table.
A stronger model is to think in terms of inventory flexibility. Which units need to be inside Amazon? Which units should remain available for other channels? Which SKUs need backup fulfillment? Which products should not be promoted because the margin or replenishment profile is too weak?
Fast fulfillment is now part of the promotion
Prime Day has trained shoppers to expect speed. That expectation does not disappear when the shopper leaves Amazon. If a brand runs a Prime Day-adjacent sale on its own site, the offer is still being mentally compared against Amazon-like delivery standards, and prime members increasingly expect fast options such as same-day delivery for everyday essentials.
That means fast fulfillment is part of the promotion. A 25% discount looks less compelling if the delivery date is vague, slow, or unreliable. A smaller discount can still convert if the shopper trusts the delivery promise and the product is available immediately.
Cahoot has written about why fast fulfillment requirements matter for Amazon sellers, but the lesson is broader. During tentpole events, every hour of handling time can affect conversion, customer experience, and marketplace performance.
For operators, this creates a practical test: if Prime Day demand doubled tomorrow, would the fulfillment operation still ship on time without emergency labor, expensive workarounds, or customer-facing delays?
Prime badge strategy matters more when shoppers are comparing
When consumers compare prices across retailers, the Prime badge, Prime membership, and other prime exclusive delivery benefits can act as trust signals that shape which offer feels safer to buy. If two sellers offer similar prices, the one with faster, more reliable delivery may win the order, which is why many operators are exploring using Amazon SFP to offset rising FBA fees while still meeting fast-shipping expectations.
This does not mean every seller should chase Seller Fulfilled Prime. The updated Seller Fulfilled Prime (SFP) program requirements are operationally demanding, and it only makes sense when a seller can consistently meet the program’s speed and performance requirements. But for sellers that can execute, Seller Fulfilled Prime can offer more control over inventory and fulfillment than a pure FBA-only model.
The key is to make the Prime badge part of a real fulfillment capability, not just a conversion tactic. If the operation cannot support the promise, the badge becomes a liability.
BNPL growth showed that strong sales do not automatically mean a strong consumer
Adobe reported that buy now, pay later orders rose 9.5% year over year and accounted for $2.1 billion during the Prime Day period. Electronics still surged, with sales up 120% versus the previous month’s daily average, even as shoppers stayed budget-conscious. That is another sign that sellers should be careful when interpreting gross sales as pure consumer strength.
Shoppers are still spending, but many are doing so selectively, comparing deals, prioritizing essentials, and using financing to manage cash flow. For sellers, that reinforces the need to protect margin and watch how budget is allocated. A promotional event can look successful in top-line revenue while still being weak after discounts, ad spend, return risk, fulfillment cost, and post-event demand softness are included.
The right question after Prime Day is not only “How much did we sell?” It is also “Which sales were profitable, which SKUs created operational drag, and which channels produced customers worth serving again?”
Prime Day 2026 should be treated as a rehearsal for Q4
Prime Day happened in June this year, but the lessons carry directly into back-to-school, fall deal events, Black Friday, Cyber Monday, and holiday fulfillment.
Sellers should treat Prime Day as a diagnostic and, where possible, reinforce those learnings by engaging with logistics and fulfillment industry events. The typical Prime Day 2026 shopper was a suburban woman aged 45–64, a brand-aware, high income buyer with strong intent in discretionary categories. It reveals which SKUs can handle promotional demand, which fulfillment nodes are weak, which channels create margin pressure, which ad campaigns scale profitably, and where inventory planning breaks down.
That is also why Cahoot’s Amazon Q4 playbook is relevant here. Artificial intelligence-driven traffic increased 89% year over year during Prime Day 2026, which is another cue to prepare for AI-assisted discovery on devices tied to Google Gemini ahead of Prime Big Deal Days and Q4. The same operating questions that determine Q4 performance also show up during Prime Day: how to avoid stockouts, how to protect profit, how to maintain delivery speed, and how to keep backup fulfillment options available when demand exceeds the plan.
The sellers that learn from Prime Day have a better shot at a profitable Q4. The sellers that only celebrate the revenue number may repeat the same mistakes at higher stakes.
Scale Faster with the World’s First Peer-to-Peer Fulfillment Network
Tap into a nationwide network of high-performance partner warehouses — expand capacity, cut shipping costs, and reach customers 1–2 days faster.
Explore Fulfillment NetworkKey takeaways: What ecommerce sellers should do with the Prime Day 2026 results
Prime Day 2026 gave sellers a useful signal: ecommerce demand is still there, but it is concentrated, comparison-driven, and operationally unforgiving.
Before the next major sales event, sellers should review these key takeaways from Prime Day 2026 results through an operator lens: apparel was the most purchased category, and different product categories showed very different upside across categories.
- Which SKUs produced profitable sales after discounting, advertising, fulfillment, and return risk?
- Which products sold well but created operational strain?
- Health and wellness products saw significant sales during the event.
- Beauty products ranked high in household penetration.
- One natural hair color brand saw a 280% revenue lift, showing the category-specific upside available with strong demand and positioning.
- Which channels captured incremental demand versus shifting demand from another channel?
- Which inventory positions caused stockouts, delays, or missed sales?
- Which fulfillment promises were easy to keep, and which required expensive workarounds?
- Which products should be promoted again during Q4, and which should be excluded?
The best sellers will not respond to Prime Day 2026 by simply discounting harder next year. They will build a better operating model around the event.
That means planning inventory across channels, using fulfillment methods intentionally, protecting margin at the SKU level, and making fast delivery part of the offer. Prime Day is no longer just about winning a four-day sales spike. It is about proving whether the ecommerce operation is ready for the promotional calendar that now defines modern retail.
Frequently Asked Questions
How much did shoppers spend online during Prime Day 2026?
U.S. online shoppers spent $26.4 billion from June 23 through June 26, 2026, according to Adobe Analytics data cited by Retail Dive. That represented a 9.3% year-over-year increase. Prime Day usually happens in July, but 2026 was an earlier summer event.
Was Prime Day 2026 only an Amazon event?
No. Amazon anchored the event, but Prime Day 2026 became a broader retail moment. Walmart, Target, Best Buy, and many brand sites ran competing promotions during the same period, and many shoppers compared prices across retailers before buying.
What was the biggest seller lesson from Prime Day 2026?
The biggest lesson is that sales volume alone is not enough. Sellers were also competing with some of the best Prime Day and best deals shoppers saw, including Google Nest Wifi Pro at up to 57% off and Samsung Frame TV at up to 36% off. Other visible examples included the iRobot Roomba Max 705 at 45% off and Apple Watch Series 11 at 28% off. The Dyson V8 vacuum at 36% off was another example of the best prices shoppers could compare across retailers. Sellers need to evaluate Prime Day through margin, inventory, fulfillment speed, channel mix, and post-event recovery. A strong revenue spike can still be operationally weak if it creates unprofitable orders, stockouts, or late shipments.
Why does Prime Day matter for fulfillment strategy?
Prime Day compresses demand into a short window. Sellers need inventory in the right places, enough capacity to ship quickly, and backup fulfillment options when one channel or network becomes constrained, including merchant-fulfilled Prime and other FBA alternatives. Fulfillment strategy can directly affect conversion, customer experience, and profitability during the event.
How should sellers use Prime Day results to prepare for Q4?
Sellers should use Prime Day as a stress test before Q4. The event can reveal which SKUs are profitable under promotion, where inventory planning breaks down, which fulfillment methods scale, and which channels create the best post-discount economics. Sellers should also track when the event ends and how new deals may keep appearing throughout the sale window, sometimes every five minutes, because that affects pacing and post-event planning.
Written By:
Rinaldi Juwono
Rinaldi Juwono leads content and SEO strategy at Cahoot, crafting data-driven insights that help ecommerce brands navigate logistics challenges. He works closely with the product, sales, and operations teams to translate Cahoot’s innovations into actionable strategies merchants can use to grow smarter and leaner.
Turn Returns Into New Revenue
Related Articles
What is DHL eCommerce and Why It’s Important for Online Sellers
DHL eCommerce provides shipping solutions for online businesses worldwide.
Seller Fulfilled Prime for Oversized Items: The FBA vs. SFP Math Sellers Need to Run
Seller Fulfilled Prime can work for oversized and bulky items, but it is not automatically cheaper than FBA.
How Businesses Ship So Cheap: The Reality Behind Commercial Shipping Rates
When small ecommerce merchants compare their shipping costs to what large brands appear to pay, the gap feels insurmountable.
TikTok Shop Fulfillment Requirements: How Sellers Can Protect LDR, OTDR, and Delivery Performance
In this article
21 minutes
- TikTok Shop fulfillment is the full customer promise, not just the warehouse handoff
- The core TikTok Shop fulfillment metrics sellers need to know
- What happens if TikTok Shop fulfillment metrics fall short?
- The bigger shift: TikTok Shop is getting closer to Amazon-style fulfillment accountability
- TikTok Shop fulfillment options: seller shipping, TikTok Shipping, FBT, and 3PL
- Fulfilled by TikTok can reduce some risk, but it is not always the right answer
- FBT vs a 3PL: which fulfillment model makes sense?
- Common TikTok Shop fulfillment mistakes sellers should avoid
- TikTok Shop fulfillment readiness checklist
- When to consider a TikTok Shop 3PL or fulfillment partner
- Final takeaway: TikTok Shop sellers need fulfillment designed around the promise
- Need help fulfilling TikTok Shop orders?
- Frequently Asked Questions
TikTok Shop fulfillment requirements center on speed, tracking, and delivery performance: sellers need to dispatch orders within 2 business days, upload valid tracking information, meet delivery timelines with an on-time delivery rate of at least 80%, and keep core metrics such as Late Dispatch Rate (LDR) below 4%, Valid Tracking Rate (VTR) above 95%, and Seller-Fault Cancellation Rate (SFCR) below 2.5%.
TikTok Shop can create demand faster than most fulfillment operations can absorb it.
That is the opportunity. It is also the risk.
A creator video can send a product into a sudden order spike. A paid campaign can concentrate demand in a short window. A product that looked easy to fulfill at 20 orders a day can become operationally fragile at 200 orders a day. And unlike a normal DTC order, the consequences of fulfillment failure on TikTok Shop do not stop at one disappointed customer.
For ecommerce sellers and brands already using TikTok Shop or evaluating it as a sales channel, the operational standard is not vague. TikTok Shop tracks fulfillment performance through seller metrics such as Late Dispatch Rate (LDR), On-Time Delivery Rate (OTDR), Valid Tracking Rate (VTR), and Seller-Fault Cancellation Rate (SFCR). Those metrics affect shop health, customer experience, and a seller’s ability to keep scaling the channel.
In other words, TikTok Shop is not just a social commerce channel anymore. It is becoming a fulfillment-performance marketplace.
That matters because TikTok Shop is already becoming more expensive and competitive as a growth channel. Cahoot previously covered TikTok Shop’s shift from free viral reach to pay-to-play, including rising fees, shrinking subsidies, and sellers reporting that organic sales became harder to sustain. When customer acquisition gets more expensive, fulfillment failures become more expensive too. A late shipment no longer wastes only postage and labor. It can waste the demand you paid to create.
This guide breaks down what TikTok Shop fulfillment means in practice, how the main performance metrics are calculated, what happens when sellers miss them, the fulfillment options available including Fulfilled by TikTok and 3PLs, the mistakes that put seller accounts at risk, and how to decide which operating model fits your business before volume exposes the weak points.
TikTok Shop Fulfillment Is the Full Customer Promise, Not Just the Warehouse Handoff
TikTok’s own Fulfillment Policy defines fulfillment as the entire fulfillment process of receiving, processing, and delivering a customer’s order. That includes preparing the product for shipment, providing valid tracking information, handing the package to a logistics service provider, and making sure delivery happens within the required timeline. Source: TikTok Shop Fulfillment Policy.
That definition is important because many sellers still think about fulfillment too narrowly. They ask whether the warehouse shipped the order. TikTok is asking whether the customer received the package within the promise TikTok showed them.
For regular orders, TikTok’s Fulfillment Policy says the order must be marked In Transit within 2 business days of Awaiting Shipment. TikTok also says regular orders have a deliver-by SLA of 6 business days from Awaiting Shipment, and the order status must be marked Delivered by that deadline. Business days exclude Saturdays, Sundays, and U.S. federal holidays.
That means the handoff is only one part of the job. A seller can print a label, pack the order, and still fail the dispatch requirement if the carrier scan does not happen on time. A seller can ship on time and still run into delivery-performance pressure if the customer promise is missed, depending on the shipping method and metric rules.
This is the direction marketplaces are moving. They do not want to adjudicate whether the warehouse, carrier, software integration, or inventory team caused the failure. They want the buyer to receive the order when the marketplace said they would.
Operator takeaway: TikTok Shop fulfillment should be managed around the customer delivery promise, not only the warehouse ship date.
Slash Your Fulfillment Costs by Up to 30%
Cut shipping expenses by 30% and boost profit with Cahoot's AI-optimized fulfillment services and modern tech —no overheads and no humans required!
I'm Interested in Saving Time and MoneyThe Core TikTok Shop Fulfillment Metrics Sellers Need to Know
The most useful way to understand TikTok Shop fulfillment is to map the platform’s metrics to the operational process that causes them. These are not abstract compliance numbers. They are direct measurements of inventory accuracy, warehouse speed, tracking quality, carrier performance, and cancellation discipline.
| Metric | TikTok requirement or target | What it measures | Common operational causes | What sellers should fix |
| Late Dispatch Rate (LDR) | TikTok recommends LDR at or below 4%. Enforcement may apply when LDR is above 10%. | The percentage of dispatched orders that were not updated to In Transit within the required dispatch SLA. | Label printed but package not scanned, carrier pickup missed, warehouse backlog, late order release, poor cutoff discipline. | Earlier cutoff times, same-day pick/pack discipline, carrier scan monitoring, backup pickup/drop-off process. |
| On-Time Delivery Rate (OTDR) | TikTok says sellers must maintain OTDR at or above 80%. | The percentage of eligible orders delivered by the designated deliver-by date. | Slow shipping service, one-warehouse fulfillment, long zones, carrier disruption, incorrect estimated delivery setup. | Distributed inventory, better carrier routing, realistic delivery promises, regional carrier-performance reporting. |
| Valid Tracking Rate (VTR) | TikTok says sellers must maintain VTR at or above 95%. | The percentage of orders with accurate and verifiable tracking numbers. | Manual tracking errors, unsupported carrier names, integration failures, mismatched tracking IDs. | Automated tracking sync, carrier-service validation, exception reports for tracking upload errors. |
| Seller-Fault Cancellation Rate (SFCR) | TikTok says sellers must maintain SFCR at or below 2.5%. | The percentage of confirmed orders cancelled due to seller fault. | Overselling, inaccurate inventory, delayed shipment, unpaid postage, pricing errors, product availability issues. | Real-time inventory sync, inventory buffers for fast movers, SKU-level inventory governance, cancellation root-cause reporting. |
| Source: TikTok Shop Fulfillment Policy and TikTok Shop OTDR Requirements. |
The numbers make the risk concrete. A shop with a 95% VTR target does not have much room for sloppy tracking uploads. A 2.5% SFCR target leaves little margin for overselling during a creator-driven spike. A recommended LDR of 4% means sellers need a dispatch process that works consistently, not occasionally.
And the OTDR threshold changes the conversation from warehouse speed to end-to-end delivery performance. A seller that ships from one warehouse to the entire U.S. may meet dispatch deadlines and still struggle with delivery promises in farther zones unless the shipping method, inventory placement, and promise settings are aligned.
What Happens if TikTok Shop Fulfillment Metrics Fall Short?
TikTok Shop’s Fulfillment Policy says enforcement actions may include Account Health Rating point deductions, removing product listings, revoking access to offer products for sale, order volume limits, refunds to customers, and account deactivation.
For OTDR specifically, TikTok’s OTDR Requirements page says shops below 80% can face enforcement, including Account Health Rating point deductions, order volume limits, or extended settlement periods. TikTok also says OTDR is one of the four core metrics used to evaluate fulfillment performance and shop health.
That is why sellers should not treat fulfillment metrics as back-office reporting. They are channel-health metrics. A late dispatch problem is not only a warehouse issue. It can become a growth issue.
The Bigger Shift: TikTok Shop Is Getting Closer to Amazon-Style Fulfillment Accountability
TikTok Shop is not Amazon, and sellers should be careful about pretending every marketplace is the same. But the direction is familiar.
Amazon has trained sellers to understand that delivery promises, tracking, cancellation rates, handling time, and customer experience can affect marketplace performance. TikTok Shop is moving toward a similar operating logic: sellers are judged less by what they intended to do and more by what the customer actually experienced.
That is also consistent with TikTok’s broader move toward more platform control over fulfillment execution. Cahoot previously covered how TikTok’s USPS label requirement signaled a shift in marketplace control. That policy forced USPS labels for TikTok Shop orders to be purchased through TikTok Shipping starting January 2026, moving a key part of shipping execution into platform-owned infrastructure. TikTok logistics is also rolling out more broadly, with US sellers required to use it by March 31, 2026, which raises the importance of robust order fulfillment integrations across ecommerce partners.
The current fulfillment-performance conversation fits the same pattern. TikTok wants cleaner tracking, more reliable dispatch, better delivery visibility, and fewer customer-facing failures. Sellers still have choices in how they fulfill orders, but the platform is tightening the expectations around whether those choices produce a reliable customer experience.
Looking for a New 3PL? Start with this Free RFP Template
Cut weeks off your selection process. Avoid pitfalls. Get the only 3PL RFP checklist built for ecommerce brands, absolutely free.
Get My Free 3PL RFPTikTok Shop Fulfillment Options: Seller Shipping, TikTok Shipping, FBT, and 3PL
Sellers do not have only one fulfillment path. The right setup depends on the seller’s channel mix, order volume, product profile, inventory strategy, and tolerance for platform dependency.
| Fulfillment option | Who stores inventory? | Who manages shipping execution? | Metric implications | Best fit | Watch-outs |
| Seller Shipping | Seller, seller warehouse, or seller’s 3PL. | Seller manages carrier selection, label workflow, tracking, and fulfillment process. | Seller is responsible for VTR, LDR, OTDR, and SFCR performance. | Brands that want control over carriers, packaging, inventory placement, and cross-channel fulfillment. | Requires strong integrations, accurate tracking, reliable carrier scans, and proactive exception handling; with own shipping, the seller must enter correct tracking IDs, carrier, and service details to stay compliant. |
| TikTok Shipping | Seller, seller warehouse, or seller’s 3PL. | Seller ships using TikTok’s logistics partners and label workflow. | TikTok says TikTok Shipping orders dispatched within the dispatch SLA are considered on-time deliveries in OTDR calculations. | Sellers that want to keep inventory outside FBT while using TikTok-managed shipping labels and logistics rules. | Seller still needs to dispatch on time. Label and carrier flexibility may be more constrained than seller-managed shipping. |
| Collection by TikTok | Seller, seller warehouse, or seller’s 3PL. | TikTok-arranged collection where available. | For TikTok Shipping orders, including Collection by TikTok, a late delivery status applies only if dispatch fails to occur within the dispatch SLA. | Sellers in covered pickup areas that want TikTok-supported logistics flow. | Coverage, eligibility, pickup reliability, and warehouse process fit need to be checked carefully. |
| Fulfilled by TikTok (FBT) | TikTok’s fulfillment network of fulfillment centers. | TikTok stores, picks, packs, and ships eligible items. | TikTok says FBT orders are excluded from several logistics-related seller performance metrics. | Sellers that want platform fulfillment, 3-day delivery eligibility, and reduced TikTok-specific logistics burden. | Less inventory flexibility, less packaging control, inbound inventory planning, and possible tradeoffs for brands selling across many channels. |
| 3PL or fulfillment partner | External 3PL, distributed fulfillment network, or hybrid of seller and partner locations. | 3PL handles order fulfillment, often across TikTok, Shopify, Amazon, Walmart, and other channels. | Seller still needs the fulfillment partner to meet TikTok’s SLA and tracking requirements. | Multi-channel brands that need TikTok fulfillment without isolating inventory in a TikTok-only network. | The 3PL must support TikTok integrations, tracking sync, scan timing, carrier rules, and SKU-level exception handling, and solutions like Cahoot’s order fulfillment services for ecommerce companies are built with those demands in mind. |
Fulfilled by TikTok Can Reduce Some Risk, but It Is Not Always the Right Answer
Fulfilled by TikTok is TikTok Shop’s in-house fulfillment service and a logistics solution for TikTok Shop merchants. TikTok says FBT handles inventory storage, packing, and shipping for sellers. It also says FBT offers 3-day shipping that covers more than 80% of U.S. orders, 24-hour processing, and shipping from 14+ locations. Source: TikTok Shop FBT overview.
Those are meaningful claims. TikTok also says FBT can reduce per-order costs by about 20% to 35% on average, and some promotional materials cite sellers reporting order fulfillment cost reductions of up to 40%, that eligible products with a Free 3-Day Delivery tag can see a 15% to 20% higher conversion rate, and that many newly inbounded FBT products saw a 40% or more increase in daily product views, based on TikTok internal data cited in its FBT materials.
Its internal data also gives a useful delivery comparison. TikTok says that among the top 40 health industry sellers it analyzed, sellers using FBT for more than 30% of their orders had an average delivery time of 83.65 hours, with 82.7% of orders delivered within 3 days. Sellers using FBT for less than 30% of orders had a 139.72-hour average delivery time, with 43.3% delivered within 3 days. TikTok also promotes cases where sellers using FBT saw revenue rise by as much as 200%.
| FBT usage group in TikTok analysis | Average delivery time | Share delivered within 3 days |
| FBT usage above 30% of orders | 83.65 hours | 82.7% |
| FBT usage below 30% of orders | 139.72 hours | 43.3% |
| Those numbers are a strong argument for FBT in the right situation. But they do not automatically make FBT the right answer for every seller. |
Cahoot has already covered what Fulfilled by TikTok really means for ecommerce sellers. The core tradeoff is simple: for ecommerce businesses, FBT can improve reliable fulfillment and customer satisfaction, but it can also reduce flexibility. Once inventory is placed into a platform-managed network, the seller has to think carefully about how that inventory supports other channels, how replenishment works, how packaging is controlled, and how quickly inventory can be reallocated if demand shifts.
FBT vs a 3PL: Which Fulfillment Model Makes Sense?
The answer depends less on whether FBT is good or bad and more on the role TikTok Shop plays in the seller’s business.
| Question | FBT may fit better if… | A 3PL may fit better if… |
| Is TikTok Shop your primary channel? | TikTok is a major or dominant demand source and the seller wants fulfillment optimized around TikTok. | TikTok is one channel alongside a Shopify store, Amazon, Walmart, Target, wholesale, or retail replenishment. |
| How much control do you need? | The seller is comfortable with TikTok managing the fulfillment flow for eligible products. | The seller needs control over carriers, packaging, routing logic, inventory placement, and exceptions. |
| How important is inventory flexibility? | Inventory can be dedicated to TikTok Shop without creating shortages elsewhere. | The same inventory pool needs to support multiple sales channels. |
| How important is branded packaging or special handling? | Standardized fulfillment is acceptable. | The brand has kitting, inserts, packaging, B2B, bundles, FBA forwarding, or other custom workflows. |
| What is the main operational risk? | The seller wants to reduce TikTok-specific fulfillment burden and gain FBT delivery benefits. | The seller wants to scale TikTok while keeping cross-channel operations flexible and centralized. |
| For TikTok-first brands with simple SKUs and predictable inventory allocation, FBT can make a lot of sense. For brands selling across several channels, a TikTok-only fulfillment silo can create a new problem: inventory becomes harder to allocate where demand actually shows up. |
That is where a TikTok Shop fulfillment partner can help. Cahoot’s TikTok Shop order fulfillment services support real-time two-way sync, inventory and tracking updates, nationwide 2-day shipping through 100+ U.S. warehouses, multi-carrier rate shopping, and fulfillment across major sales channels, which can also support more shipping options and lower shipping costs. That kind of setup is useful when TikTok orders need to be fulfilled alongside Shopify, Amazon, Walmart, and other channels instead of being managed as a separate operational island, and it leverages ecommerce order fulfillment services that outclass traditional 3PLs.
Scale Faster with the World’s First Peer-to-Peer Fulfillment Network
Tap into a nationwide network of high-performance partner warehouses — expand capacity, cut shipping costs, and reach customers 1–2 days faster.
Explore Fulfillment NetworkCommon TikTok Shop Fulfillment Mistakes Sellers Should Avoid
The biggest TikTok fulfillment mistakes are usually not dramatic. They are small process gaps that become expensive when order volume spikes.
1. Treating TikTok Shop Like a Side Channel
TikTok Shop may start as a test, but TikTok sellers face real platform metrics from the beginning. If the warehouse team treats TikTok orders as secondary volume behind Amazon, Shopify, or wholesale orders, dispatch performance can slip before the seller realizes it, and that risk is especially high during flash sales or viral surges.
2. Printing Labels Without Controlling Carrier Scan Timing
TikTok’s dispatch requirement depends on the order being updated to In Transit. That means a printed label is not enough, and the dispatch status should also be reflected in seller center when the carrier scan happens. The package needs to be scanned by the carrier within the dispatch SLA.
3. Overselling During Creator-Driven Demand Spikes
Creator content can change demand quickly. If TikTok inventory is not synced accurately across channels, sellers can take orders they cannot fulfill. That can increase seller-fault cancellations and damage shop health.
4. Shipping Every Order From One Warehouse
A single warehouse may work for low order volume. It becomes harder when TikTok starts measuring delivery performance across regions, where shipping lead times are tougher to control from one node and the shipping lead, or delivery timeline, can vary more by destination. Long zones, slow ground lanes, and one-size-fits-all carrier logic can hurt OTDR, and weak domestic shipping coverage from a single node can make that worse.
5. Not Separating Performance by SKU, Carrier, and Region
Shop-level averages can hide the actual problem. One SKU, one warehouse zone, or one carrier service can be responsible for most late deliveries. Sellers need reporting that shows the operational source of the metric issue.
6. Ignoring Returns and Post-Purchase Experience
Fulfillment quality includes more than speed. TikTok’s Fulfillment Policy also calls out poor fulfillment quality examples such as packages marked delivered but not received, damaged items or packaging, missing items, and wrong items delivered. Proper packaging matters because packages must be secure and prevent movement during transit, and weak packaging can also lead to additional fees when shipments fail packaging standards. Those issues create refunds, support load, and negative customer experience even when the original dispatch was on time.
TikTok Shop Fulfillment Readiness Checklist
Before scaling TikTok Shop, sellers should pressure-test the operation against the metrics TikTok actually uses.
| Area | Question to ask | Why it matters |
| Inventory accuracy | Is available-to-sell inventory synced in near real time across TikTok and other channels? | Bad inventory data creates oversells, cancellations, and customer disappointment. |
| Warehouse cutoff | Can TikTok orders be picked, packed, and handed to the carrier within the required dispatch SLA? | LDR depends on the order reaching In Transit within the required window, which also supports timely deliveries. |
| Carrier scan control | Do you know whether packages are physically scanned on time, not just labeled? | A label without a scan can still become a late dispatch issue. |
| Tracking sync | Are tracking IDs, carrier names, and service levels uploaded accurately? | VTR requires accurate and verifiable tracking. |
| Delivery promise | Are shipping templates, service levels, and warehouse locations aligned with the shipping process and actual transit performance? | OTDR depends on orders arriving by the deliver-by date. |
| Regional performance | Can you see late delivery patterns by region, zone, carrier, and SKU? | Averages hide operational weak spots. |
| Surge capacity | What happens if a creator video causes a 5x or 10x order spike? | TikTok demand can move faster than replenishment and warehouse staffing. |
| Exception handling | Who owns stuck orders, missed scans, inventory discrepancies, damaged shipments, and failed deliveries? | Fulfillment problems need fast ownership before they become customer and metric problems. |
| Cross-channel routing | Can TikTok orders route to the best fulfillment node without starving Amazon, Shopify, or Walmart inventory? | Multi-channel sellers need speed without losing inventory flexibility. |
When to Consider a TikTok Shop 3PL or Fulfillment Partner
A seller may not need a fulfillment partner on day one. But the need becomes clearer when TikTok starts exposing operational weak spots.
Consider a TikTok Shop 3PL or fulfillment partner if:
- TikTok order volume is growing faster than the warehouse can process it.
- LDR, OTDR, VTR, or SFCR is trending in the wrong direction.
- The brand ships from one warehouse and struggles to meet delivery expectations nationally.
- Inventory is manually managed across TikTok, Shopify, Amazon, Walmart, and other channels, and the operation lacks ecommerce fulfillment software for real-time optimization.
- Creator campaigns create sudden spikes that overwhelm normal fulfillment capacity.
- The brand wants faster delivery or more flexible express shipping options without moving all TikTok inventory into FBT, making a peer-to-peer order fulfillment service that beats old 3PLs an attractive alternative.
- The seller needs fulfillment support across B2C, B2B, marketplace, and replenishment workflows and is evaluating a top-rated collaborative order fulfillment company.
The key is not simply outsourcing pick and pack. The key is choosing a reliable fulfillment setup that protects TikTok’s customer promise while keeping the rest of the business flexible.
Final Takeaway: TikTok Shop Sellers Need Fulfillment Designed Around the Promise
TikTok Shop fulfillment is not only about getting orders out the door. It is about protecting the delivery promise TikTok places in front of shoppers.
The platform’s fulfillment requirements make that clear. Regular orders need to move to In Transit within 2 business days. VTR must stay at or above 95%. LDR is recommended at or below 4%, with possible enforcement above 10%. OTDR must stay at or above 80%. SFCR must stay at or below 2.5%.
Those numbers turn fulfillment into a growth requirement.
Fast creative and creator demand can generate the order. Fulfillment determines whether that order strengthens the channel or creates a performance problem.
For some sellers, Fulfilled by TikTok will be the right path. For others, especially multi-channel brands that need inventory flexibility, a strong 3PL or distributed fulfillment network may be a better fit. The right answer depends on how TikTok fits into the broader business.
But the operating principle is the same for everyone: build TikTok Shop fulfillment around the customer promise, not around the warehouse handoff.
Need Help Fulfilling TikTok Shop Orders?
Cahoot helps ecommerce brands fulfill TikTok Shop orders across Shopify, Amazon, Walmart, other channels, and connected shop accounts. With real-time TikTok order sync, tracking updates, distributed inventory placement for shipping products, multi-carrier rate shopping, and a network of 100+ U.S. warehouses, Cahoot helps sellers improve delivery speed, reduce shipping cost and fulfillment costs, and protect marketplace performance, which is especially valuable for brands also needing best-in-class Shopify fulfillment services.
Learn more about Cahoot’s TikTok Shop fulfillment services, or contact Cahoot for a customized fulfillment quote.
Frequently Asked Questions
What are TikTok Shop fulfillment requirements?
TikTok Shop fulfillment requirements include dispatching orders within the required SLA, providing valid tracking information, meeting delivery timelines, and maintaining core fulfillment metrics such as VTR, LDR, OTDR, and SFCR. For regular orders, TikTok’s Fulfillment Policy says orders must be marked In Transit within 2 business days of Awaiting Shipment, and sellers onboarding to TikTok Shop should review these requirements early to avoid compliance problems as volume grows.
What is TikTok Shop Late Dispatch Rate?
Late Dispatch Rate, or LDR, measures the percentage of dispatched orders that were not updated to In Transit within the required dispatch SLA. TikTok recommends sellers maintain LDR at or below 4%, and enforcement may apply when LDR is greater than 10%.
What is TikTok Shop On-Time Delivery Rate?
On-Time Delivery Rate, or OTDR, measures the percentage of eligible orders delivered by their designated deliver-by date. TikTok says sellers must maintain OTDR at or above 80%.
Does Fulfilled by TikTok protect seller metrics?
TikTok says FBT orders are fully managed by TikTok Shop’s fulfillment system and that logistics-related issues, including late dispatches, cancellations, and negative reviews, are excluded from seller performance metrics, which can also help preserve the seller’s shop performance score when those issues are handled by FBT. Sellers should still evaluate FBT based on inventory flexibility, fees, packaging control, and cross-channel strategy, especially if they also rely on channels like Google Shopping with specialized delivery-focused fulfillment.
Should TikTok Shop sellers use FBT or a 3PL?
FBT may be a strong fit for sellers that want TikTok-managed fulfillment and, for a small independent company, simplify TikTok-only logistics with efficiency and growth support. A 3PL may be a better fit for sellers that need to fulfill TikTok orders alongside Shopify, Amazon, Walmart, wholesale, or other channels while keeping inventory flexible.
Can a 3PL fulfill TikTok Shop orders?
Yes. A 3PL can fulfill TikTok Shop orders as part of a broader logistics solution if it supports TikTok order ingestion, inventory sync, tracking updates, carrier compliance, and the operational speed required to meet TikTok’s fulfillment metrics. Sellers should verify that their 3PL can support LDR, OTDR, VTR, and cancellation-rate requirements before scaling TikTok Shop volume, and reviews from peers on order fulfillment services and customer experiences can also inform that decision.
Written By:
Rinaldi Juwono
Rinaldi Juwono leads content and SEO strategy at Cahoot, crafting data-driven insights that help ecommerce brands navigate logistics challenges. He works closely with the product, sales, and operations teams to translate Cahoot’s innovations into actionable strategies merchants can use to grow smarter and leaner.
Turn Returns Into New Revenue
Related Articles
What is DHL eCommerce and Why It’s Important for Online Sellers
DHL eCommerce provides shipping solutions for online businesses worldwide.
Seller Fulfilled Prime for Oversized Items: The FBA vs. SFP Math Sellers Need to Run
Seller Fulfilled Prime can work for oversized and bulky items, but it is not automatically cheaper than FBA.
How Businesses Ship So Cheap: The Reality Behind Commercial Shipping Rates
When small ecommerce merchants compare their shipping costs to what large brands appear to pay, the gap feels insurmountable.
The History of Ecommerce Returns (And Where It Broke)
In this article
15 minutes
- Introduction
- Ecommerce Returns Were More Tolerable When the Average Ecommerce Return Rate Was Lower
- The Warehouse Became the Default Endpoint for Reverse Logistics in an Earlier Era
- The Break Came When Scale, Shipping, and Expectations All Changed
- What Once Looked Workable in Returns Management Became Structurally Outdated
- Today's Policy, Protect Margin, and Strategy Pressures Are Downstream of That Break
- The Real Problem Is That the Model Outlived the Conditions That Made It Defensible
- Conclusion
- Frequently Asked Questions
Introduction
Ecommerce returns did not arrive broken. They became broken because a model built for an earlier, smaller version of online retail kept running long after the conditions that justified it had changed. The headlines about return fees, fraud, and reverse-logistics costs in 2025 are not a sudden crisis. They are the visible end of a slow structural drift that started years ago.
That distinction matters operationally. If returns are a recent policy problem, you can fix them with policy tweaks. If they are the downstream consequence of a system that outlived its assumptions, then tweaking policy will not be enough. This piece walks through how the original returns model emerged, why the warehouse became its default endpoint, and where the assumptions underneath that model quietly stopped holding. The point is not that anyone designed the system poorly. It is that the system has been asked to do something it was never shaped to do.
Ecommerce Returns Were More Tolerable When the Average Ecommerce Return Rate Was Lower
Early ecommerce returns were not painless, but they were episodic rather than industrial. Order volume was lower. SKU counts were smaller. Apparel and home goods, the categories that now drive the worst return rates, were not yet the dominant share of online sales; today, the average ecommerce return rate ranges much higher than for in-store purchases, and 25% of U.S. online shoppers returned clothing in the past year. Reverse logistics flows moved at a pace warehouses could absorb without restructuring around them.
In that environment, the original assumptions behind free returns were not irrational. They reduced friction for shoppers who were still being convinced to buy sight unseen. They built trust at a moment when trust was the binding constraint on growth. They also shaped customer behavior in online shopping: lenient policies may encourage impulsive purchasing behaviors, and 40% of online shoppers order extra items intending to return some, a pattern often described as bracketing in ecommerce returns. And the cost of the occasional return did not stand out next to the conversion lift it produced. Returns were treated as a customer-acquisition expense, not a category-defining operational burden, because at that scale they actually behaved that way.
The takeaway is not that early operators were naive. It is that the math worked. A model that looks indefensible at today’s volumes looked perfectly reasonable when volumes were a fraction of what they are now. Understanding why ecommerce returns were never designed for scale starts with accepting that the original design was a fit for its era, not a mistake from its era, even as rising ecommerce return rates have turned a manageable cost center into a structural issue.
Make Returns Profitable, Yes!
Cut shipping and processing costs by 70% with our patented peer-to-peer returns solution. 4x faster than traditional returns.
See How It WorksThe Warehouse Became the Default Endpoint for Reverse Logistics in an Earlier Era
When returns did happen in early ecommerce, sending them back to a distribution center was the obvious choice. The warehouse already had the people, the dock doors, the inventory systems, and the inspection capacity to receive goods. It was the natural place to regain physical and informational control over a unit that had left the network and was coming back in unknown condition.
So the canonical return loop hardened: the return process for customer returns began when a customer initiated a return, the item shipped back to a DC, intake and inspection ran, the unit was repackaged or dispositioned, and only then could it be restocked, resold, liquidated, or destroyed. Effective reverse logistics can recover more value from returned merchandise once items are inspected and dispositioned, and networks like Happy Returns drop-off locations attempt to streamline that experience for both shoppers and brands. That sequence felt workable because each step had an obvious home in infrastructure that already existed. Nobody built a parallel system because nobody needed one.
This is how the warehouse-centric return loop became the industry default. Not by decree, and not because anyone studied the alternatives and rejected them. It became default because it was the lowest-friction path through the operating assets retailers already owned. Once that path was wired into RMS platforms, WMS integrations, returns management systems, carrier contracts, and 3PL agreements, it stopped being a choice and started being the architecture. Modern returns management software and portal tools also let shoppers generate labels and track returns without contacting support.
The Break Came When Scale, Shipping, and Expectations All Changed
The system did not change as fast as the environment around it changed. Four shifts piled onto the same warehouse-first loop, and the loop kept producing the same outputs at much higher cost.
- Scale increased. Total U.S. retail returns ran near $396B in 2018 and reached roughly $890B by 2024. Online returns alone hit about $247B in 2023, with the average ecommerce return rate still rising and projected to reach 12.1% by 2029, so retailers are feeling how ecommerce return rates affect profit margins far more acutely than they did a decade ago. The loop was being asked to absorb a volume of physical handling it was never sized for.
- Shipping cost became more consequential. Two-leg reverse logistics is the most expensive part of a return, and return shipping is a key factor in total return cost, especially when merchants offer free returns as a default benefit. Every increase in carrier rates, dimensional weight surcharges, and peak handling fees lands twice on each returned unit, even as 79% of consumers expect free return shipping.
- Reverse logistics burden got heavier. More SKUs, more apparel and footwear, more bracketing behavior, more inspection variance. The labor and time required per return rose at the same time the volume did.
- Customer expectations hardened. Free, fast, frictionless became the baseline, not the perk. Refund windows tightened in the customer’s mind even as cycle times for processing got longer in the warehouse.
None of these shifts on their own would have broken the model. The break came because all four happened at once while the routing logic underneath returns stayed identical. Two shipping legs, an intake queue, an inspection step, a repackaging step, a restocking step, and a markdown clock running the whole time. The loop did not get worse. The world it was operating in got harder, and the loop did not respond. Returns now cost retailers an estimated $550 billion annually.
That mismatch is what people mean when they talk about the hidden economics of a $100 return. The per-return math was tolerable under the old conditions. It became untenable under the new ones, as those costs can erase profit margins on sale items and put pressure on ecommerce retailers to protect margin, even though the steps themselves never changed.
Convert Returns Into New Sales and Profits
Our peer-to-peer returns system instantly resells returned items—no warehouse processing, and get paid before you refund.
I'm Interested in Peer-to-Peer ReturnsWhat Once Looked Workable in Returns Management Became Structurally Outdated
This is the part that gets misread most often. The old model did not suddenly become stupid. It became outdated. Those are different diagnoses, and they point to different fixes.
A system that is poorly executed can be improved with better execution. A system that is structurally outdated cannot. The same logic running at modern scale produces worse economics regardless of how well it is run. Returns software gets better, customer portals get smoother, drop-off networks expand, carriers consolidate, and the cost per return does not move the way the investment in those tools would suggest it should. Best practices in ecommerce returns management focus on transparency, automation, and reducing preventable returns, and treating returns as a chance to build loyalty with an exceptional returns program, which is different from making the same loop slightly more efficient. That is the signature of a structural problem, not an execution problem.
The warehouse-first default is not failing because warehouses are failing. Warehouses still do exactly what they were built to do. The problem is that the default assumption underneath the loop, that every returned unit must travel backward through a central node before it can re-enter the market, was a fit for a smaller, slower, cheaper ecommerce environment. At modern volumes, shipping costs, and expectation levels, that same assumption produces compounding loss, especially when weak product pages create avoidable returns that precise specifications and clear product descriptions could have prevented, while returned units still have to move back through the same choke point and create downstream pressure on quality control and inventory management. The model outlived the conditions that once made it workable.
This is why incremental improvement keeps disappointing. You can sharpen every step in a loop and still get worse results if the loop itself is the wrong shape for the work.
Today’s Policy, Protect Margin, and Strategy Pressures Are Downstream of That Break
Most of what shows up in 2025 as a returns crisis is not really new. It is the historical break expressing itself through current pressure.
When Zara, H&M, Anthropologie, and others started charging return fees, that was not a sudden change of heart. It was a recognition that the social contract around free returns had become more expensive to honor than to renegotiate. Over 60% of consumers review a return policy before making a purchase, so those choices shape customer retention and repeat business as much as cost recovery. The fact that consumer backlash largely did not materialize suggests the market knew, too. Allowed return periods commonly range from 14 to 90 days, and some large retailers extend them to 90 days. The expectation that free returns aren’t sacred anymore is itself a downstream consequence of a loop that stopped being able to absorb its own cost.
The same is true for margin pressure. Returns now sit explicitly in board conversations about working capital drag, Scope 3 emissions, fraud exposure, and gross-margin durability, including whether historically free returns are coming to an end as merchants reassess the economics. That is not because the conversation suddenly got smarter. It is because the gap between what the loop was built to handle and what it is being asked to handle finally got wide enough to show up in finance reviews for finance teams. Ecommerce brands often structure outcomes around a full refund, store credit, or exchanges, and exchanges or store credit can help protect revenue and keep loyal customers. Some also use small restocking fees or flat return fees to manage losses and set expectations, while store credit incentives give them another way to preserve margin. Once it is visible there, it is no longer an operational footnote, even though seamless handling still matters because 92% of consumers will buy again after an easy experience.
Regulatory pressure works the same way. The EU restricting destruction of unsold goods, scrutiny of Scope 3 in reverse logistics, FTC attention on “free returns” claims, all of it is the world tightening around a model that was designed when none of those constraints existed. The constraints did not appear because the model is broken. They appeared because the model’s externalities finally got large enough to attract policy.
The Real Problem Is That the Model Outlived the Conditions That Made It Defensible
The most useful frame for understanding the history of ecommerce returns is also the most uncomfortable one. The current pain is not a story about retailers who got something wrong. It is a story about a system that was correctly designed for one set of conditions and then asked, without redesign, to operate under a very different set.
That framing changes what counts as a real fix. Anything that keeps the warehouse-first loop intact and tries to make each step inside it more efficient is working on the wrong layer. The loop is the thing that no longer fits, not the steps inside it. The most successful brands now treat returns as a cross-functional issue spanning operations, supply chain, fraud, and customer journey design. Software, scale, and consolidation can sand down the edges, but they cannot change the direction of travel. Return fraud is one reason the old model no longer scales, with 93% of retailers reporting it as a significant issue, and many smaller brands adopt tools like the Return Prime returns solution to add structure without building full-scale logistics capabilities. In one example of the pressure this creates, 42% of men admitted lying about not receiving an online purchase, which is why controls have to stay targeted rather than penalize honest customers. Many merchants now set clear expectations by requiring items to be unused, unwashed, and in original packaging, and some direct-to-consumer brands enforce 14-day windows. More than two thirds of retailers are upgrading returns capabilities to meet customer expectations, but tooling alone does not solve the structural issue. That is why the most serious conversations in the industry have shifted from “how do we optimize returns” to “why do returns have to work this way at all.” The answer to the second question is what makes the case that returns need to go forward, not back.
You do not have to accept any particular alternative model to take the diagnosis seriously. You only have to recognize that a structural mismatch does not get smaller on its own. It gets normalized, then expensive, then strategic, in roughly that order. We are somewhere in the third stage now.
Traditional Returns Are Ending
Ecommerce built a returns system for a smaller internet. Today it’s collapsing under scale. Warehouses can’t absorb the volume, costs keep rising, and retailers are quietly tightening policies. This article explains why the old model is failing and what replaces it.
Read the Returns BibleConclusion
The history of ecommerce returns is not the story of a system that was always obviously broken. It is the story of a system that stopped fitting reality and kept running anyway. The original model was a reasonable response to early ecommerce conditions. The conditions changed. The model did not. What looked workable under lower volume, lighter shipping cost, and softer expectations became structurally outdated when all three moved at once.
The useful lesson is not that someone should have seen this coming sooner. It is that the current pressure on returns is not a recent accident. It is the predictable result of an old loop running too long in a world it was not built for. Recognizing that is the first step toward designing returns for the conditions that actually exist now, instead of the ones that used to.
Frequently Asked Questions
When did ecommerce returns start becoming a structural problem rather than an operational one?
The shift was gradual rather than sudden. Through the 2010s, return volumes, SKU complexity, and customer expectations all rose, but the warehouse-first loop stayed unchanged. By the early 2020s, the gap between what the loop was designed to handle and what it was being asked to handle became large enough to appear in finance and board-level discussions, not just operations reviews.
Why did the warehouse become the default endpoint for returns in the first place?
Because it was already there. Warehouses had the labor, the dock space, the inventory systems, and the inspection capacity to receive goods coming back into the network. Sending returns to a DC was the lowest-friction path through infrastructure retailers already owned. Once that path got wired into RMS platforms, carrier contracts, and 3PL agreements, it became the architecture rather than a choice.
Were free returns a mistake from the beginning?
No. Free returns were a rational response to early ecommerce conditions. They reduced friction at a moment when trust, not cost, was the binding constraint on online growth, and 76% of consumers say free returns still influence their shopping decisions. The policy did not fail because it was wrong. It failed because the volume, shipping cost, and expectation environment it operated in changed while the policy stayed the same.
Why hasn’t better returns software fixed the problem?
Because returns software optimizes the steps inside the warehouse-first loop rather than changing the loop itself. An intuitive returns portal can still improve customer satisfaction by making processing returns easier with a return label, automated email alerts, and visibility when a package arrives. Better portals, smarter policy automation, and richer analytics improve the customer experience and the data layer, but they leave inbound shipping, intake labor, repackaging, restocking, and markdown exposure intact. A structurally outdated loop does not get fixed by sharpening its edges.
What does it mean to say returns are “structurally outdated”?
It means the same logic running at modern scale produces worse economics regardless of execution quality. A poorly executed system can be improved by executing better. A structurally outdated system cannot, because the architecture itself is the source of the loss. That is why incremental tooling and consolidation have not bent the cost curve in any durable way.
Is the current pressure on returns mostly a policy issue or mostly a historical one?
Mostly historical, with policy expressing it. Return fees, tighter windows, regulatory scrutiny, and board attention are all downstream consequences of a loop that stopped fitting reality. The policy still needs to be easy to find and understand for both you and the customer, and 84% of shoppers prefer box-free label-free returns with instant credit when requesting refunds. The policy moves are responses to the pressure, not the source of it, even as customers expect less friction from the process. Treating today’s pressure as a recent policy story misses the longer arc that produced it.
Written By:
Manish Chowdhary
Manish Chowdhary is the founder and CEO of Cahoot, the most comprehensive post-purchase suite for ecommerce brands. A serial entrepreneur and industry thought leader, Manish has decades of experience building technologies that simplify ecommerce logistics—from order fulfillment to returns. His insights help brands stay ahead of market shifts and operational challenges.
Turn Returns Into New Revenue
Related Articles
What is DHL eCommerce and Why It’s Important for Online Sellers
DHL eCommerce provides shipping solutions for online businesses worldwide.
Seller Fulfilled Prime for Oversized Items: The FBA vs. SFP Math Sellers Need to Run
Seller Fulfilled Prime can work for oversized and bulky items, but it is not automatically cheaper than FBA.
How Businesses Ship So Cheap: The Reality Behind Commercial Shipping Rates
When small ecommerce merchants compare their shipping costs to what large brands appear to pay, the gap feels insurmountable.