
The Economics of Peer-to-Peer Returns

Last updated on April 13, 2026

In this article
 21 minutes
- Market Structure
- What the Traditional Returns Model Actually Costs
- The Peer-to-Peer Returns Cost Structure
- The 1,000 Return Scenario
- Why Partial Adoption Still Moves the Needle
- Working Capital and Inventory Velocity
- Sustainability as a Secondary Economic Multiplier
- Fraud Exposure and the Margin It Protects
- What This Means for the Returns P&L
- Frequently Asked Questions
Traditional returns management has one fundamental flaw: it optimizes a process that should not exist in its current form. For decades, retailers and ecommerce businesses have struggled with the challenges of returns, highlighting the persistent nature of these issues. Peer-to-peer returns economics work differently because P2P eliminates entire cost layers rather than attempting to process them more efficiently, and on a per-return basis, that distinction is worth roughly $22 for every $100 in merchandise. P2P platforms like Uber and Airbnb serve as alternatives to traditional services such as taxis and hotels, positioning themselves as viable options within the broader economy. A peer-to-peer (P2P) economy enables individuals to transact directly in a decentralized system based on personal ownership of production. The modern state of emerging P2P economies is significant and disruptive enough for regulators and companies to have woken up to it.
The peer-to-peer economy operates through a network that connects buyers and sellers, facilitating the direct exchange of goods and services. These networks enable individuals to bypass traditional intermediaries, transforming how services and products are delivered. A P2P economy can exist within a capitalist economy, co-existing with traditional capitalist firms.
This article’s focus is a financial comparison. It uses the cost structures established in Part IV of the Returns Bible to show exactly where the savings come from, why they compound across volume, and why partial adoption still changes the math in a meaningful way. The analysis highlights how each transaction in a P2P system is a direct, tech-enabled exchange, offering more autonomy but also greater risk than traditional capitalism. In many cases, P2P and traditional systems assess creditworthiness or manage risk in the same way before leveraging advanced algorithms for further improvements.
Market Structure
The peer-to-peer (P2P) economy is reshaping the landscape of commerce by creating a decentralized market structure where individuals transact directly with one another, bypassing many of the traditional intermediaries. This shift is evident across a range of industries, from peer to peer lending platforms that connect borrowers and investors, to P2P marketplaces that facilitate the resale of returned goods. In these systems, the market is largely determined by the collective actions of buyers, sellers, and investors, rather than by centralized institutions.
In the realm of peer to peer lending, for example, interest rates are set based on the perceived risk and demand, often ranging from 7% to 26% for short-term loans. This creates an attractive alternative for investors seeking higher returns compared to conventional savings or investment products. However, this same structure introduces significant challenges, such as the risk of losing money due to borrower defaults or fraudulent returns. To manage these risks, P2P lending platforms rely on credit assessment tools like FICO scores to determine borrower eligibility and set appropriate interest rates. Some platforms also implement restocking fees or penalties for borrowers who fail to meet their obligations, helping to offset the costs associated with the return process and protect investor funds.
The P2P market structure also plays a pivotal role in the retail industry, particularly when it comes to product returns. Instead of routing returned goods back through costly and time-consuming traditional channels, P2P marketplaces enable customers to sell returned products directly to other buyers. This not only increases the resale value of returned goods but also reduces the negative impact of returns on retailers’ profits. By creating a more efficient and transparent system, P2P returns help businesses recover value that would otherwise be lost to markdowns, restocking, and logistics.
For consumers, the peer to peer economy offers greater access and control over both purchases and investments. Buyers can find better deals on returned or pre-owned items, while investors can diversify their portfolios with alternative assets like P2P loans. At the same time, the system encourages the reuse and resale of goods, supporting the principles of the circular economy and reducing overall waste.
Despite these benefits, the P2P market structure is not without its risks. Fraudulent returns, defaulting borrowers, and the uncertainty of resale value all pose ongoing challenges. The effectiveness of the system depends on robust risk management, transparent processes, and the ability of platforms to quickly identify and address issues as they arise. Retailers, in particular, may face hurdles in adapting to this new model, as it requires rethinking established business practices and investing in new technology and processes.
Ultimately, the impact of the peer to peer economy on market structure will be shaped by a variety of factors, including adoption rates, regulatory frameworks, and the willingness of businesses and consumers to embrace new ways of transacting. As more industries explore P2P solutions, the potential for creating more efficient, sustainable, and consumer-friendly markets continues to grow—offering both opportunities and challenges for everyone involved.
What the Traditional Returns Model Actually Costs
For decades, retailers have struggled with the persistent challenges of returns, especially in the retail and ecommerce industries. Before comparing models, the baseline needs to be clear. Most retailers do not track the fully loaded cost of a single return. They look at average shipping costs, maybe warehouse labor, and leave it there. That partial view is how returns become a slow margin leak that never gets prioritized until it is already significant.
The traditional return process often involves shipping items back to the store or warehouse, which leads to increased costs and delays. Retailers often face significant losses due to high return rates, which can range from 20% to 40% in certain categories like apparel. Additionally, many retailers require products to be returned in their original packaging, along with manuals and accessories, to qualify for a refund or exchange.
The full cost stack on a traditional $100 return breaks down as follows:
- Shipping: ~$16 (two legs, one outbound and one inbound return)
- Labor and processing: ~$7 (intake, inspection, repackaging, restocking, systems updates)
- Markdowns: ~$10 (value lost while the item sits in the reverse logistics pipeline)
- Fraud and shrinkage: ~$4 (wardrobing, item swapping, abuse across anonymous handoffs)
- CAC erosion: implicit but material
Total average loss: approximately $37 per $100 return.
That last line item, customer acquisition cost erosion, does not appear on most returns reports. When a customer buys and returns, the marketing spend that acquired them does not come back. That $50 acquisition cost becomes deadweight the moment the item ships back. The fully loaded picture is worse than the $37, but even that figure is the operational floor.
Why Averages Lie
The problem with tracking average cost per return is that averages flatten the distribution. Returns behave more like tail risk than steady expense, and the costs associated with returns are often uncertain due to unpredictable consumer behavior and fluctuating market conditions. A high-return SKU in apparel or footwear can generate losses that double the average. Seasonal goods returned after the selling window closes are worth a fraction of what they were two weeks earlier, and the valuation of these returned goods is often unclear, further complicating cost calculations. Items that enter the inspection queue during peak season sit for days, sometimes weeks, before anyone touches them.
The $37 figure is an average. The actual exposure across a SKU catalog is almost always worse on the high end and only occasionally better on the low end. When stacked across volume, the picture becomes harder to ignore.
What $37 Looks Like at Scale
Take 1,000 returns on $100 items. Under the traditional warehouse-centric model, approximately $37,000 is lost across that cohort once shipping, labor, markdowns, and fraud are fully accounted for. Over the past few years, these losses have increased, reflecting the growing challenges in managing returns efficiently. That number does not include the cost of capital tied up in slow-moving returned inventory, or the time it takes for items to re-enter sellable stock.
For a mid-market brand processing tens of thousands of returns annually, the math compounds quickly into six-figure annual margin erosion that rarely shows up as a single line item on the P&L, but is always there.
Make Returns Profitable, Yes!
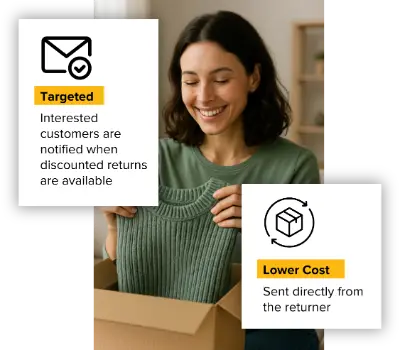
Cut shipping and processing costs by 70% with our patented peer-to-peer returns solution. 4x faster than traditional returns.
See How It WorksThe Peer-to-Peer Returns Cost Structure
Peer-to-peer returns do not make the warehouse-centric process faster or cheaper. They remove it from the equation for a significant portion of returns. That distinction is the entire argument. One major benefit of the peer-to-peer model is the cost savings and efficiency it brings to the returns process, along with faster processing and improved customer experience.
Peer-to-peer return models in e-commerce bypass traditional reverse logistics by enabling direct shipping from the original buyer to the next buyer. This approach also converts customers into part of a decentralized and flexible logistics network, making the system more adaptable and scalable.
When a return is eligible for P2P, the returning customer receives a label addressed not to a warehouse but to the next buyer who has already expressed demand for that SKU. The item moves forward, not backward. No distribution center. No inspection queue. No repackaging line. To maintain trust and reliability, the quality of goods is often verified through ratings, reviews, or even AI-powered quality screening, ensuring that items meet the expectations of the next buyer.
The cost structure changes completely:
- Shipping: ~$8 net (forward-only, one leg to the next buyer)
- Labor and processing: $0 (no warehouse intake, no receiving crew, no repackaging)
- Markdowns: ~$7 (intentional discount priced at listing, not erosion from pipeline delay)
- Fraud and shrinkage: materially reduced
Total average loss: approximately $15 per $100 return.
Where the Savings Actually Come From
This is the critical distinction between P2P and every other returns optimization approach on the market. Returns Management Systems (RMS) improve the portal experience, policy enforcement, and label generation. They do not change where the item goes. Carriers expand drop-off networks and consolidation hubs. They do not change how many times the item moves. Recommerce platforms add resale channels at the back end of the warehouse loop. They do not remove the warehouse from the equation.
P2P savings come from elimination, not incremental optimization.
Assume that in a typical P2P return model, eligible returns are matched directly with new buyers, and costs are distributed only between the sender and receiver, with no warehouse involvement. The inbound shipping leg disappears because the item never travels back. Warehouse labor disappears because there is no intake. Repackaging cost disappears because the item ships as-is from the returner. Markdown decay disappears because the item is not sitting in a queue while its resale window closes. Cost reduction in P2P return models can lead to shipping and processing savings of up to 70% by eliminating return legs to a warehouse. Cahoot’s Peer-to-Peer Returns model enables customers to ship returned items directly to the next buyer, bypassing the warehouse. You cannot optimize what should not exist. That is the operational logic underpinning the entire cost differential.
The Markdown Distinction
One number worth unpacking is the markdown figure. In the traditional model, $10 in markdowns represents reactive discounting. Items lose value while in the reverse logistics pipeline because time erodes resale viability. Seasonal demand fades. Consumer interest in a particular style shifts. By the time the item clears inspection and re-enters inventory, it often cannot sell at full price.
In P2P, the ~$7 markdown is intentional. The item is listed as “Like New” or “Open Box” at a slight discount, often 10 to 20 percent below original retail, on the same product detail page as the new item. That discount is a deliberate pricing decision that captures value immediately rather than surrendering value gradually. Buyers and sellers actively invest in the resale process, whether by maintaining product quality or optimizing listings, to maximize returns. The presence of a P2P market can improve consumer surplus by providing resale options for products that cannot be returned to retailers. Additionally, P2P markets can increase consumers’ willingness to pay for new products by alleviating valuation uncertainty, as buyers know they have a future resale option. The difference between a planned discount and an uncontrolled one is not just financial. It is also operational and reputational.
The 1,000 Return Scenario
The side-by-side comparison makes the economics concrete.
1,000 returns, $100 item value:
- Traditional model: ~$37,000 lost
- P2P model: ~$15,000 lost
- Difference: ~$22,000 preserved
Just as peer-to-peer lending platforms like Lending Club and Prosper allow individuals to lend money directly to others—bypassing traditional banks and using technology to match lenders with creditworthy borrowers—P2P returns route goods directly between consumers, bypassing costly warehouse and logistics steps. This direct transfer, similar to how lenders earn higher yields in P2P finance, results in higher yields for investors and potentially lower costs for borrowers in the P2P returns model.
That $22,000 swing comes from eliminating warehouse intake, removing the redundant return shipping leg, preventing markdown decay, and reducing fraud exposure. Not from better software. Not from faster processing. From routing the items differently so the costly steps never occur.
For a mid-market brand doing 20,000 returns per year on average item values in that range, the conceptual extrapolation is straightforward. The savings are not linear because P2P eligibility varies by SKU, but even partial adoption at the rates discussed below changes the annual P&L in ways that show up clearly.
Why Partial Adoption Still Moves the Needle
A common objection to P2P economics is that not every return qualifies. That objection is correct, and it does not diminish the argument.
Across most ecommerce operations, between 30 and 60 percent of returns are viable P2P candidates. These are items with stable resale value, durable packaging, clear condition standards, and active downstream demand at the time of return. Apparel, footwear, and accessories fit well. Small durable home goods fit reasonably well. Fragile items, regulated products, and defective merchandise stay in traditional flows.
The key insight is that the cost curve bends early. The first 30 to 60 percent of returns eligible for P2P represent a disproportionate share of recoverable value. These are the items that would have sold quickly on the resale market if they had gotten there faster, and the items where markdown risk is highest when they do not. Capturing those returns before they enter the warehouse loop is where most of the economic gain lives.
Retailers do not need 100 percent P2P adoption to change their returns economics. They need to identify the cohort of recoverable returns and reroute them. Everything else can continue through existing reverse logistics infrastructure. Warehouses remain necessary for damaged goods, regulated categories, and edge cases. They just stop being the default endpoint for everything.
The presence of a P2P market increases consumers’ willingness to pay for new products, as buyers are more confident they can resell or return items through peer networks. When P2P options are available, consumers are often willing to pay more, knowing that payment and returns can be handled directly between peers, which can improve trust and efficiency in the transaction process.
Working Capital and Inventory Velocity
The financial case for P2P is not limited to per-return cost reduction. There is a second-order effect that matters to finance teams and operators equally: what happens to capital when returns resolve faster.
In the traditional model, time-to-recovery is measured in weeks. An item enters the return flow, travels back to the distribution center, waits in the intake queue, goes through inspection and repackaging, re-enters inventory, and eventually sells. During that entire window, the capital tied to that item is not working. It is sitting in a reverse logistics pipeline, depreciating.
In P2P, time-to-recovery shrinks from weeks to days. The item moves directly to the next buyer. The refund issues on confirmed delivery. The inventory never leaves active circulation in any meaningful sense. P2P systems establish faster capital recovery by enabling direct transfers and minimizing idle inventory time. Capital that was previously trapped in a slow reverse logistics loop returns to working status faster. Additionally, decentralized return paths in P2P models enhance supply chain resilience during peak seasons or shipping disruptions, ensuring smoother operations when traditional channels are strained.
For a mid-market brand carrying significant return volume, that acceleration matters more than the per-return savings alone. Faster refunds reduce customer service contacts and improve net promoter scores. Faster inventory velocity reduces carrying costs and storage pressure. Faster resale captures demand before it shifts. These outcomes are connected, and they all trace back to the same routing change.
Convert Returns Into New Sales and Profits
Our peer-to-peer returns system instantly resells returned items—no warehouse processing, and get paid before you refund.
I'm Interested in Peer-to-Peer ReturnsSustainability as a Secondary Economic Multiplier
The environmental case for P2P is often treated as a separate argument. Operationally, it is the same argument stated differently.
Each P2P return eliminates one inbound shipping leg. Across volume, that reduction translates to fewer truck miles, less packaging, and a measurable decline in Scope 3 emissions attributable to reverse logistics. On one hand, the P2P process streamlines returns with minimal effort, making it both efficient and sustainable. P2P return models significantly lower the carbon footprint by cutting down shipping distances and reducing packaging waste. For brands under pressure to report on supply chain emissions under frameworks like the EU’s Corporate Sustainability Reporting Directive (CSRD) or in anticipation of U.S. regulatory movement, that reduction is not rhetorical. It is reportable.
The economic framing matters here. Sustainability improvement is a byproduct of cost elimination. When the return shipping leg disappears because the item routes forward, the emission disappears with it. No offset purchase required. No separate sustainability program to fund. The carbon reduction falls out of the operational change automatically.
For finance teams evaluating the total cost and risk picture of traditional returns, Scope 3 exposure is becoming a line item. P2P reduces it at the source.
Fraud Exposure and the Margin It Protects
Return fraud reached $101 billion in 2023 and is projected to approach $125 billion by 2025. That number does not land evenly across retail. It concentrates in systems where returns pass through multiple anonymous handoffs, where verification is delayed, and where the gap between shipment and confirmation creates opportunity.
Traditional returns create those conditions by design. Items move from customer to carrier to warehouse intake to inspection, multiple steps where condition, identity, and contents can be misrepresented. Wardrobing thrives when warehouses process too much volume to detect subtle use. Item swapping works when identical SKUs move through intake in bulk. Empty box scams persist when proof of condition lags the refund.
P2P changes the exposure profile by reducing the number of handoffs. When an item ships directly from one customer to the next, there is no anonymous warehouse queue in between. Refunds are tied to confirmed delivery, not to the return label scan at drop-off. The returner knows the item is going to another person, not into an institutional processing system. That social accountability shifts behavior.
Fewer touchpoints mean fewer attack surfaces. That is not a complete fraud solution. Guardrails, photo verification, AI risk scoring—similar to how a FICO score is used to assess borrower creditworthiness in lending—and refund gating on confirmed delivery are still necessary. Platforms also utilize AI and data analytics for real-time smart matching of return requests with existing orders, minimizing transit time. But the structural advantage of P2P is that it reduces the inherent fraud surface rather than adding detection layers on top of a system that creates the opportunity in the first place. Protected margin from reduced fraud is real margin.
Traditional Returns Are Ending
Ecommerce built a returns system for a smaller internet. Today it’s collapsing under scale. Warehouses can’t absorb the volume, costs keep rising, and retailers are quietly tightening policies. This article explains why the old model is failing and what replaces it.
Read the Returns BibleWhat This Means for the Returns P&L
The economics of peer-to-peer returns add up across four dimensions simultaneously:
- Direct cost reduction: Shipping, labor, and markdown costs fall because the cost layers are eliminated.
- Faster capital recovery: Working capital circulates faster when returns resolve in days, not weeks.
- Reduced Scope 3 liability: Fewer shipments and less packaging reduce environmental exposure that is increasingly reportable.
- Lower fraud surface: Fewer anonymous handoffs reduce the structural conditions that enable return abuse.
The economics of peer-to-peer (P2P) returns in financial systems are driven by the elimination of traditional bank intermediaries, which allows investors to benefit from improved returns and reduced costs.
None of these require the full reversal of existing infrastructure. They require routing a meaningful portion of eligible returns differently. The 30 to 60 percent of returns that are strong P2P candidates are where the financial case concentrates. The remaining returns continue through warehouses, which become specialized handlers for the cases that genuinely require them rather than default endpoints for everything.
The $37 loss per $100 return under traditional models is not a fixed cost of doing business. It is the cost of a routing assumption that was built for a different era of commerce. The $15 loss under P2P is what happens when that assumption is replaced by one that fits how ecommerce actually operates now.
Frequently Asked Questions
What is the average cost of a traditional ecommerce return as a percentage of item value?
Based on industry analysis, the average fully loaded cost of a traditional return runs approximately $37 per $100 item, or roughly 17 to 30 percent of the original sale price depending on the category. This includes inbound and outbound shipping, warehouse labor, inspection, repackaging, markdown losses, and fraud and shrinkage. Customer acquisition cost erosion adds further untracked losses on top of those operational figures.
How does peer-to-peer returns reduce cost compared to traditional reverse logistics?
Peer-to-peer returns reduce cost by eliminating entire cost categories rather than making existing steps more efficient. In a P2P system, the return transaction occurs directly between consumers, allowing the item to be shipped from one consumer to another without passing through the retailer’s warehouse. This direct transaction can reduce logistics costs significantly by bypassing the retailer’s warehouse entirely. The P2P cost structure averages approximately $15 per $100 return versus $37 under traditional models. If a P2P market exists, the retailer may still hold some inventory of returned products.
Do retailers need to route all returns peer-to-peer to see financial benefits?
No. Between 30 and 60 percent of returns are typically viable P2P candidates, and this cohort is where the majority of recoverable value is concentrated. The cost curve bends significantly at that level of adoption. Damaged goods, regulated categories, and fragile items continue through traditional reverse logistics. Warehouses remain necessary for exception handling but stop serving as the default endpoint for recoverable inventory.
What types of products are best suited for peer-to-peer returns economics?
High-fit categories include apparel, footwear, and accessories, where resale demand is relatively predictable and packaging is durable enough for a second shipment. Medium-fit categories include small durable home goods and non-fragile consumer items. Low-fit categories include glassware, regulated products like cosmetics and medical devices, custom or made-to-order goods, and items where resale demand has effectively expired due to seasonality.
How does peer-to-peer returns affect working capital for ecommerce brands?
P2P accelerates the time-to-recovery cycle from weeks to days. When returned items route directly to the next buyer rather than through a warehouse intake process, the capital tied to that inventory returns to active use faster. Refunds issue on confirmed delivery rather than waiting for warehouse processing, which reduces customer service load and improves cash flow predictability. For brands carrying significant return volume, this velocity difference compounds meaningfully across an annual cycle.
Does peer-to-peer returns reduce return fraud exposure?
P2P reduces fraud exposure by shrinking the number of anonymous handoffs where abuse typically occurs. Because refunds are tied to confirmed delivery to the next buyer, and because items do not pass through an institutional warehouse queue, the structural conditions for wardrobing, item swapping, and empty box scams are reduced. This does not eliminate the need for guardrails like photo verification or AI risk scoring, but it changes the baseline exposure compared to a system that creates fraud opportunity at every additional touchpoint.
How does the sustainability case for P2P connect to financial outcomes?
The sustainability improvement is a byproduct of cost elimination, not a separate program. When an inbound return shipping leg is removed because the item routes forward, the associated emissions disappear automatically. For brands subject to Scope 3 emissions reporting under frameworks like the CSRD, or anticipating similar U.S. regulatory requirements, that reduction carries financial relevance. It reduces reportable liability without requiring additional investment in offsets or sustainability-specific initiatives.
Written By:

Manish Chowdhary
Manish Chowdhary is the founder and CEO of Cahoot, the most comprehensive post-purchase suite for ecommerce brands. A serial entrepreneur and industry thought leader, Manish has decades of experience building technologies that simplify ecommerce logistics—from order fulfillment to returns. His insights help brands stay ahead of market shifts and operational challenges.

Turn Returns Into New Revenue
Related Articles
Why 100% P2P Adoption Is the Wrong Goal
Peer-to-peer returns do not work by replacing your entire returns operation overnight, and the brands evaluating them should stop measuring them that way.
Why Returns Need to Go Forward, Not Back
The future of ecommerce returns will not be decided by better software or bigger warehouses.
Amazon Discover Unmet Demand: What Sellers Should Know
Amazon has added a Discover Unmet Demand view inside the Amazon Product Opportunity Explorer that surfaces search clusters where shoppers are clicking but converting below the expe...