The Hidden Economics of a $100 Return

Last updated on April 01, 2026
In this article
 19 minutes
- Why Per-Return Math Lies
- The Real Cost Stack: What Actually Happens to That $100
- The $59.99 Apparel Item: Three Scenarios
- The Myth vs. Reality of a $100 Return
- Capital Timing Distortion: The Problem Nobody Talks About
- Compounding at Scale: The Architecture of Margin Erosion
- What Accurate Return Cost Accounting Actually Requires
- Frequently Asked Questions
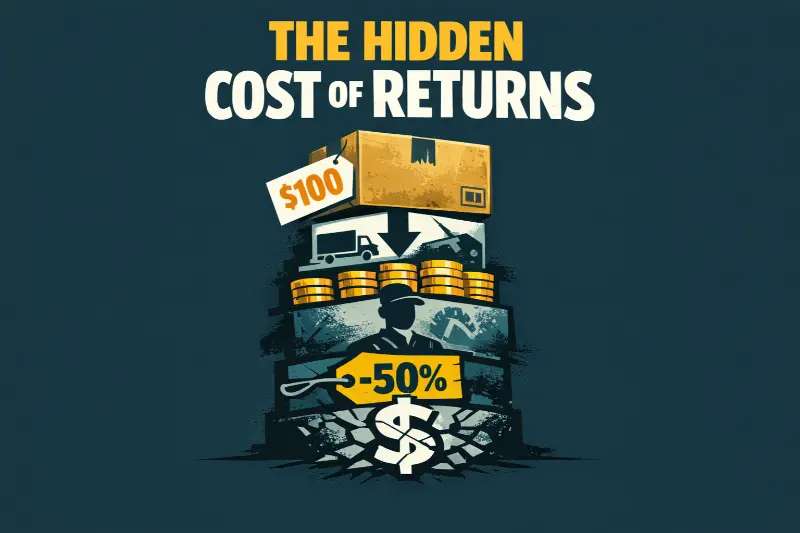
The cost of returns is one of the most systematically underestimated figures in ecommerce finance. Most retailers quote a per-return processing fee and move on, but that number is not a cost. It is a floor. What actually happens when a customer sends something back is a cascading sequence of cost exposures that compound across shipping, labor, inventory timing, markdown pressure, fraud leakage, and lost acquisition spend. A $100 return is not a line item. It is a multi-stage margin compression event, and most operators are only counting the first stage.
A major driver behind the increase in returns is the rise of online shopping, which has changed consumer behavior and led to higher return rates, a trend explored in depth in analyses of the rise of e-commerce return rates.
This article is not about blaming returns. It is about accurately reading what they cost, because the gap between perceived cost and actual cost is where margin quietly disappears. According to the National Retail Federation, returns in 2024 are expected to amount to 17% of all merchandise sales, totaling $890 billion in returned goods.
The holiday season is a peak period for returns, amplifying cost challenges for retailers.
Why Per-Return Math Lies
Ask most operations teams what a return costs, and they will give you a number: average shipping, average labor, maybe a restocking note. That figure is usually somewhere between $10 and $20, which feels manageable relative to a $60 or $100 sale.
The problem is not that the number is wrong. It is that averages are the wrong tool for measuring this kind of loss.
The returns process is a complex workflow that companies must manage and optimize, involving logistics, warehousing, labor, and cost reduction. Returns do not behave like a steady expense. They behave more like tail risk. A small percentage of returns — items that cannot be resold, items that arrive damaged, items that were fraudulently initiated — carry dramatically higher cost than the average. When you average those outcomes with a large volume of low-friction cases, the catastrophic ones disappear into the math, and the true impact of ecommerce return rate on profit margins is obscured.
The other failure of average-based cost tracking is that it treats a return as a single event with a single cost. A return is not a single event. It is a sequence of exposures that begins the moment the original order was placed, continues through the return shipping leg, warehouse processing, and inventory holding period, and does not fully resolve until the item is either restocked, discounted into resale, or written off. At each stage, value erodes. The average cost metric captures almost none of that erosion accurately.
What per-return averages actually measure is the most visible costs — usually the inbound label. What they miss is the structural loss: the outbound freight already spent, the capital tied up in limbo inventory, the markdown required to move a product that missed its selling window, and the customer acquisition cost that evaporated with the refund.
Many retailers and companies are shifting their approach to the returns process, including charging fees to offset rising costs. Many retailers are now charging returned item fees to cover the costs of processing returns, and retailers point to rising shipping and processing costs as a reason for charging return fees.
Retailers that manage returns by average cost are, in effect, making strategic decisions based on incomplete data. The result is a chronic underestimation of true return exposure — and a persistent inability to explain why gross margin keeps disappointing.
Make Returns Profitable, Yes!
Cut shipping and processing costs by 70% with our patented peer-to-peer returns solution. 4x faster than traditional returns.
See How It WorksThe Real Cost Stack: What Actually Happens to That $100
When a return is initiated, cost does not start at the inbound label. It started when the order shipped. Understanding the full cost of returns means accounting for every layer in the sequence.
The returns experience directly affects both customers and consumers, influencing their satisfaction, loyalty, and future purchasing decisions. Retailers who optimize their returns process can improve customer satisfaction and encourage repeat business by building an exceptional returns program that drives loyalty.
Beyond financial costs, returns have a significant environmental impact. In 2023, returns created 8.4 billion pounds of landfill waste, underscoring the environmental cost of managing returns and helping explain why many retailers are questioning whether free returns are sustainable or coming to an end. Retailers are increasingly focusing on sustainable practices and implementing sustainability initiatives to reduce the carbon footprint associated with returns, including programs that support eco-friendly returns in eCommerce.
Outbound Freight: Already Gone
The original shipment cost is spent and unrecoverable. When a return is initiated, that outbound shipping label does not disappear from the cost ledger — it simply shifts from “cost of fulfillment” to “cost of a transaction that generated no net revenue.” For most ecommerce operations, outbound freight runs $7 to $9 per leg. On a returned order, that spend is a pure loss.
Reverse Shipping: The Second Leg
Inbound return labels add another $7 to $9. Combined with the original outbound leg, you are already looking at $14 to $18 in two-way freight before a single person has touched the item in the warehouse. This dual freight exposure is one of the most consistently undercounted costs in returns analysis, because most teams only track the return label they issue — not the outbound label they already paid.
Intake Labor: The Hidden Labor Cost
Once the item arrives at a distribution center, the clock starts on warehouse labor. Intake requires receiving, inspection, condition grading, SKU verification, repackaging or rebagging, and system updates. Across multiple industry analyses, this labor runs $10 to $15 per unit when fully loaded — meaning after accounting for benefits, overhead, and supervisor time, whether the brand is handling returns in-house or using third-party solutions like Happy Returns reverse logistics.
That labor cost assumes the item is in acceptable condition. Items that require additional processing, partial repair, or disposition routing cost meaningfully more. The $10 to $15 range is the floor, not the ceiling.
Inspection, Sorting, and Repackaging
Separate from basic intake, inspection involves a human judgment call on every item: is this resellable at full price, resellable at a discount, or unsellable? Verifying that returned items are in perfect condition is crucial to maximize resale value and prevent unnecessary refunds. High-quality product visuals and detailed product information can also reduce returns caused by unmet expectations. Repackaging — replacing polybags, applying new stickers, re-boxing — adds materials cost on top of labor. For apparel, this might be minor. For boxed goods or electronics, it is materially more expensive.
Restocking Delay and Markdown Risk
Time is the silent cost multiplier in returns. A returned item that takes two to three weeks to flow back through the warehouse and reappear in available inventory has lost time it cannot recover. In seasonal categories, that delay can mean the item misses its selling window entirely. In non-seasonal categories, inventory that sits drives holding cost and reduces working capital efficiency.
When inventory does reenter the active catalog after a delay, it often does so at a discount. Either the brand has aged the SKU down in price, or the item is routed to a secondary channel at a fraction of full retail. That markdown represents the difference between recovery and loss.
Fraud Leakage
Fraud is not an exceptional event in high-volume returns operations. It is a predictable, recurring percentage of the return stream. Return fraud — wardrobing, item swapping, empty-box claims — adds a direct financial loss that is invisible in average cost calculations because it is typically measured separately, if at all, and behaviors like wardrobing and how to minimize it deserve dedicated attention from loss prevention teams. According to NRF and Appriss Retail data, return fraud reached $101 billion in 2023. That is not a rounding error. It is structural leakage that compounds on top of every other cost in this stack, making returns fraud and refund fraud a silent profit killer in many programs.
The Fully Loaded Average
When these layers are assembled, industry analysis puts the average total cost per return at approximately $40.75. That figure — drawn from analysis of more than one million returns by ReturnLogic and corroborated by studies from Alexander Jarvis and ReverseLogix — includes shipping, handling, repackaging, and secondary costs. ReverseLogix further estimates that returns cost 17 to 30 percent of an item’s original sale price when fully accounted for.
On a $100 item, that is a $17 to $30 loss before any consideration of customer acquisition spend or capital timing effects.
The $59.99 Apparel Item: Three Scenarios
Abstract ranges are useful. Concrete examples are more useful. The following worked example, derived directly from Part I of the Returns Bible analysis, illustrates what cost exposure actually looks like at the SKU level.
The item: A hooded sweatshirt, medium, retailing at $59.99. Shipped from Ohio to Georgia. Item cost (landed): $22.32. Outbound shipping label: $9.58. Outbound shipping supplies: $1.22. Outbound labor: $2.99.
Fashion, clothing, and footwear have return rates frequently exceeding 20% to 30%, primarily due to fit and sizing issues, including customers ordering the wrong size, which makes crafting the perfect e-commerce returns program especially critical in these categories.
Scenario A: No Return
Total margin on a clean sale: approximately $17.88. This is the reference point — what the transaction is worth when no return occurs.
Scenario B: Returned and Unsellable
The customer initiates a return. The item comes back damaged, worn, or otherwise unresellable. The brand issues a full refund of $59.99, pays the inbound return label ($9.58), absorbs inbound labor and processing ($2.99), and retains the item with zero resale value.
The fully loaded loss on this transaction: approximately $54.68.
To be precise: what started as a transaction with $17.88 of margin becomes a transaction with a $54.68 loss. The swing between Scenario A and Scenario B is over $72. That is not a shipping problem. That is a structural margin destruction event.
Scenario C: Returned and Resold at a 30% Discount
The item comes back in resellable condition. The team repackages it, relists it as open box at $41.99 (30% off), ships it again with a second outbound label and labor cost, and the item eventually sells.
The loss on this transaction: approximately $23.53.
This is the best-case return outcome — and it still results in a $23.53 loss on what was originally a $17.88 margin sale. Even functional recovery produces a net-negative outcome once all the cost layers are included.
These three scenarios illustrate what the cost of returns actually looks like in practice. The average masks the range. The range is what matters.
Convert Returns Into New Sales and Profits
Our peer-to-peer returns system instantly resells returned items—no warehouse processing, and get paid before you refund.
I'm Interested in Peer-to-Peer ReturnsThe Myth vs. Reality of a $100 Return
The myth is straightforward: a $100 return costs whatever the return label costs, plus a few dollars of warehouse handling. Call it $10 to $15. That is the number most operators use. It is the number that makes returns feel manageable.
The reality is different.
A $100 return includes:
- Lost gross margin on the original sale. The margin from the initial transaction does not survive a return. It is refunded. The cost of goods, however, remains spent.
- Dual freight. Two shipping legs, each costing $7 to $9. Combined, $14 to $18 before the item is touched.
- Intake and processing labor. $10 to $15, fully loaded, for receiving, inspection, grading, repackaging, and system updates.
- Markdown or liquidation exposure. Items that reenter the catalog at a discount, or that route to secondary channels, recover a fraction of original value — not full value.
- Fraud leakage. A predictable percentage of returns are fraudulent or abusive, adding direct losses that do not appear in standard per-return cost calculations.
- Customer acquisition cost. This is the silent amplifier that most cost calculations omit entirely.
On a $100 sale, if the customer acquisition cost is $50 — a reasonable figure for mid-market apparel, where CAC commonly runs 7 to 12 percent of revenue and blended customer economics push higher — that spend is unrecoverable on a returned order. It was spent to acquire a customer who generated no net revenue. The item was sold, shipped, returned, and refunded. The $50 in paid media or influencer spend that drove the purchase is simply gone.
When CAC is factored in, a $100 sale that results in a return can produce a net loss in the $80 to $90 range. The math is not hypothetical. It is the operational reality for any brand running paid acquisition at scale and tracking return rates with honest accounting.
Capital Timing Distortion: The Problem Nobody Talks About
There is a timing dimension to the cost of returns that does not appear on most returns dashboards, but that CFOs and operations leaders feel acutely.
When a return is initiated, the refund is typically issued quickly. Most return portals issue refunds on initiation or on confirmed shipment — often within 24 to 72 hours. The customer’s cash is back in their account.
The inventory, however, is not back in the catalog. It is somewhere in the reverse logistics pipeline — in transit, at an inbound dock, in an inspection queue, awaiting repackaging, or pending relisting decisions. That process takes days. In busy periods, it takes weeks.
During that window, the brand has done the following: spent the cost of goods, spent two shipping legs, paid the refund, and received nothing in return — not cash, not inventory, not a sellable asset. The working capital tied to that transaction is frozen in a physical item that is not yet available for resale.
This capital timing distortion compounds across return volume. A brand processing 500 returns a week, each tying up $60 to $100 in cost basis for two to three weeks before resolution, is carrying a substantial and often invisible working capital drag. The cash conversion cycle worsens with every return that enters the pipeline. Finance teams that look only at returns as an operating expense — not as a working capital event — are missing a significant portion of the true cost.
Returns are not just operational friction. They are a capital allocation problem.
Compounding at Scale: The Architecture of Margin Erosion
Individual return economics are concerning. At volume, they become structural.
The reason the cost of returns has become an existential issue for many brands is not that any single return is catastrophic. It is that return rate multiplied by volume multiplied by layered cost per unit produces a compounding effect that overwhelms operational improvements.
Consider what a 1 percentage point increase in return rate means for a mid-market brand doing $20 million in annual revenue. At a 15% return rate, that is $3 million in returned merchandise per year. At 16%, it is $3.2 million. The incremental $200,000 in returned goods, processed at a fully loaded cost of $40.75 per unit on a $100 average order value, generates approximately $81,500 in additional direct costs — before markdown exposure, CAC erosion, or capital timing effects.
That is not a returns management problem. That is an architecture problem.
The warehouse-centric returns model accumulates cost at every step because it was never designed for the volume or velocity of modern ecommerce. Returns were originally episodic. They are now industrial. The cost stack described above was always present — it was simply invisible at low volumes. At current volumes, it is the difference between a profitable unit economics model and one that cannot sustain growth.
As Part I of the Returns Bible establishes, U.S. retail returns reached $890 billion in 2024, the highest level on record. Online returns alone reached $247 billion in 2023. These are not rounding errors. They are signals that the compounding math has overtaken the model.
Small changes in return rate create exponential margin pressure not because the math is exotic, but because the cost layers are multiple and sequential. A brand that thinks it is managing returns well because its processing fee is competitive may be losing 20 to 30 percent of sale price on every returned item and attributing the margin shortfall to channel costs, platform fees, or inventory write-downs instead.
The problem is not episodic. It is architectural. And it compounds.
Traditional Returns Are Ending
Ecommerce built a returns system for a smaller internet. Today it’s collapsing under scale. Warehouses can’t absorb the volume, costs keep rising, and retailers are quietly tightening policies. This article explains why the old model is failing and what replaces it.
Read the Returns BibleWhat Accurate Return Cost Accounting Actually Requires
Retailers who want to understand the true cost of returns need to move beyond average processing cost and build a fully loaded return P&L. That means accounting for:
- Outbound freight (spent at time of original fulfillment)
- Inbound return freight (per-leg cost, not blended)
- Intake and inspection labor (per-unit, fully loaded)
- Repackaging materials and labor
- Inventory holding cost during recovery delay
- Markdown or liquidation haircut at time of resale
- Fraud and shrinkage rate applied to return volume
- CAC attributable to returned orders
- Capital cost of refund float during inventory recovery
Each of these inputs exists in the operational data of most mid-market and enterprise retailers. The challenge is that they live in different systems — the WMS, the carrier invoices, the marketing platform, the financial model — and nobody has assembled them into a single return cost view.
That assembly is the starting point. Without it, every decision about return policy, return fees, return volume thresholds, and return channel investment is being made on incomplete data. The cost of returns is not a shipping fee. It is a multi-layer margin event. Treating it as anything less is a strategic error that compounds with every return that enters the pipeline.
Frequently Asked Questions
What is the true average cost of processing a single ecommerce return?
Industry analysis puts the fully loaded average at approximately $40.75 per return, accounting for shipping, labor, inspection, repackaging, and secondary costs. This figure is substantially higher than the per-label cost most operators track, because it includes intake labor, repackaging, and markdown exposure that are typically measured separately or not at all.
Why does the average per-return cost mislead retailers?
Averages flatten the distribution of return outcomes. A large volume of low-friction, resellable returns makes the average look manageable, while masking the tail of high-cost cases — damaged items, fraudulent returns, seasonal goods that miss resale windows — where the actual loss per unit is dramatically higher. Managing by average cost means systematically underestimating exposure on the worst-performing returns.
Does the outbound shipping cost factor into the real cost of a return?
Yes. When an order is returned, the original outbound freight is unrecoverable. It was spent to deliver a product the customer sent back, generating no net revenue. Most return cost calculations start with the inbound return label, which means they are ignoring the first shipping leg entirely. The true freight exposure on a returned order is two legs, not one.
How does customer acquisition cost affect return economics?
Customer acquisition cost is a silent amplifier of return losses. When a customer returns an order, the marketing spend that drove that transaction — paid search, social ads, influencer campaigns — generates no revenue. The brand spent to acquire a customer who returned the product and received a full refund. On a $100 order where CAC is $50, that cost is simply absorbed with no offsetting revenue. At scale, this dynamic turns an individually manageable return into a significant drag on return on ad spend.
What does the $59.99 apparel return example show about return economics?
The $59.99 apparel scenario illustrates how margin collapses across three outcomes. On a clean sale, the item generates approximately $17.88 in margin. If the item is returned and unsellable, the transaction results in approximately $54.68 in losses — a swing of over $72. If the item is returned and resold at a 30% discount, the loss is approximately $23.53. Even the best-case return outcome produces a net loss on a transaction that otherwise generated nearly $18 in margin. The example demonstrates that returns are not a shipping inconvenience — they are a contribution margin destruction event.
Why is capital timing an underappreciated part of return cost?
Most return cost analysis focuses on operating expenses — freight, labor, markdowns. What it misses is the timing of cash flows. Refunds are typically issued within 24 to 72 hours of return initiation. Inventory recovery — the process of receiving, inspecting, repackaging, and relisting a returned item — takes days to weeks. During that window, the brand has spent the cost of goods and issued the refund, but has no sellable asset in exchange. This working capital drag compounds across return volume and worsens the cash conversion cycle in ways that do not appear in standard return cost reporting.
At what point do return rates create structural margin problems?
Return rate creates structural pressure when its compounding effect exceeds what operational efficiency can offset. For most mid-market ecommerce brands, a 1 percentage point increase in return rate on $20 million in revenue generates $200,000 in incremental returned merchandise, which at a fully loaded return cost of $40.75 per unit on a $100 average order value produces approximately $81,500 in additional direct costs — before CAC erosion, markdown exposure, or capital timing effects. The problem is not any single return rate level. It is the architecture of costs that activates with each marginal point of increase.
How do return policies and free returns impact consumer behavior and retailer strategy?
A significant percentage of consumers consider free returns a key factor in their purchasing decisions, and return policies are increasingly shaping consumer shopping habits, especially among younger generations. Offering “free returns” means the business absorbs return shipping costs, which can be higher than outbound shipping costs. Retailers are using technology to create customized return policies that balance customer satisfaction with profit margins, raising important questions about the true cost and sustainability of free returns. Improving the returns experience is a key goal for many retailers as they seek to enhance customer loyalty.
Written By:

Manish Chowdhary
Manish Chowdhary is the founder and CEO of Cahoot, the most comprehensive post-purchase suite for ecommerce brands. A serial entrepreneur and industry thought leader, Manish has decades of experience building technologies that simplify ecommerce logistics—from order fulfillment to returns. His insights help brands stay ahead of market shifts and operational challenges.
Turn Returns Into New Revenue
Related Articles

What is DHL eCommerce and Why It’s Important for Online Sellers
DHL eCommerce provides shipping solutions for online businesses worldwide.

Seller Fulfilled Prime for Oversized Items: The FBA vs. SFP Math Sellers Need to Run
Seller Fulfilled Prime can work for oversized and bulky items, but it is not automatically cheaper than FBA.
How Businesses Ship So Cheap: The Reality Behind Commercial Shipping Rates
When small ecommerce merchants compare their shipping costs to what large brands appear to pay, the gap feels insurmountable.