HTS Code Explained: What It Is, Why It Matters, and How Ecommerce Brands Use It

In this article
 28 minutes
- What HTS codes are and how they work in U.S. importing
- How HTS codes differ from HS codes at a high level
- Why HTS classification directly affects duties, taxes, and clearance speed
- Common HTS code mistakes ecommerce brands make
- Operational consequences of incorrect HTS codes
- How ecommerce brands should approach HTS classification responsibly
- How to find the correct HTS code for your products
- The long-term margin impact of classification accuracy
- Frequently Asked Questions
HTS codes (Harmonized Tariff Schedule codes) are standardized numerical classifications that identify imported products for U.S. Customs and Border Protection, determining the duties, taxes, and regulations that apply to each shipment. For ecommerce brands importing inventory from overseas manufacturers, HTS classification directly affects landed costs, clearance speed, and compliance risk in ways that compound across thousands of shipments. A single misclassified product category can trigger duty rate differences of 5-25% due to varying customs duty rates determined by the HTS code, translate to thousands in unexpected costs annually, and create audit exposure that persists for five years after each entry. In the long run, proper HTS code management is essential to avoid compounding costs and compliance risks.
The operational reality is that most ecommerce founders encounter HTS codes only when their customs broker or freight forwarder requests them for the first time. Customs brokerage services play a crucial role in helping importers navigate the complexities of HTS code classification and customs processes. The temptation is to treat classification as a checkbox exercise, selecting whichever code seems close enough or accepting whatever the broker suggests without verification. This approach works until it doesn’t. Customs reclassifications, informed compliance letters, or audits reveal the accumulated cost of incorrect classification years after the pattern began, when correcting the issue requires paying retroactive duties plus penalties on hundreds of past shipments.
When calculating landed costs and assessing compliance risk, the commercial invoice is the key document used to declare the value of imported goods, which is essential for calculating customs duty rates. During audits and compliance reviews, it is important to note that the final determination of duty rates and classification is made by U.S. Customs and Border Protection, not the importer.
What HTS codes are and how they work in U.S. importing
The Harmonized Tariff Schedule (HTS) is the U.S. classification system for imported goods, maintained by the U.S. International Trade Commission, which is the official publisher of the Harmonized Tariff Schedule, and used by U.S. Customs and Border Protection to determine applicable tariff rates, quotas, and statistical tracking for merchandise imported into the United States. The HTS extends the international Harmonized System (HS) maintained by the World Customs Organization, which provides the foundation for classifying traded products globally across most world trade, serving as the global system for classifying goods in international trade.
HTS codes use a 10-digit structure where meaning builds hierarchically, with each number contributing to increasing classification detail. The first six digits align with the international HS code used by most countries worldwide, enabling consistent classification across borders. Digits seven and eight represent U.S.-specific statistical categories that provide more granular product detail for U.S. trade data tracking. Digits nine and ten identify additional statistical details used by the Census Bureau for trade reporting. The full 10-digit code is often referred to as the Schedule B number or ‘b number’ for statistical purposes. This structure means an HTS code like 6109.10.0012 represents a specific product classification: Chapter 61 (Articles of apparel and clothing accessories, knitted or crocheted), heading 6109 (T-shirts, singlets and other vests, knitted or crocheted), subheading 6109.10 (Of cotton), and U.S.-specific detail down to 6109.10.0012 (Men’s or boys’ T-shirts, all white, short hemmed sleeves).
The classification process follows a legal framework established in the General Rules of Interpretation (GRI), which provide the methodology for determining correct classification when products could potentially fit multiple categories. The rules establish hierarchical priority, starting with heading-level classification based on the article’s essential character, then proceeding through increasingly specific subheadings. This structured approach means classification is not arbitrary or opinion-based, but follows defined legal standards that customs authorities worldwide apply consistently. For example, if a product description or image is ambiguous, incorrect classification could lead customs authorities to believe the product is live animals, resulting in delays or penalties.
HTS codes serve multiple functions beyond simply identifying products. They determine duty rates applicable to specific goods, control quota and trade agreement eligibility, trigger compliance requirements like permits or certifications, enable statistical tracking of U.S. imports and exports, and establish preferential treatment under free trade agreements. A single code change can shift a product from duty-free to 15% duty, require FDA registration that wasn’t previously necessary, or make a product subject to quotas that limit importation.
Slash Your Fulfillment Costs by Up to 30%
Cut shipping expenses by 30% and boost profit with Cahoot's AI-optimized fulfillment services and modern tech —no overheads and no humans required!
I'm Interested in Saving Time and MoneyHow HTS codes differ from HS codes at a high level
The relationship between HS codes and HTS codes creates confusion because the terms are often used interchangeably despite technical differences. The Harmonized System (HS) is the global system for product classification—a standardized system of names and numbers to classify traded products, developed and maintained by the World Customs Organization. The system covers approximately 5,000 commodity groups identified by six-digit codes arranged in a legal and logical structure supported by well-defined rules.
HS codes represent the first six digits that remain consistent internationally. A cotton T-shirt classified as 6109.10 under the HS system maintains that same six-digit classification whether imported into the United States, Canada, European Union, or Japan. This international harmonization enables global trade statistics comparison and simplifies cross-border commerce by providing a common classification language.
HTS codes extend the six-digit HS foundation with additional country-specific digits. In the United States, the HTS code consists of 10 digits, compared to the 6-digit HS code. Other countries may add different numbers of digits based on their statistical and regulatory needs. This means an HS code is universal for the first six digits, but the complete HTS code is specific to the destination country. The practical implication is that suppliers providing HS codes from their country may give accurate six-digit classifications, but U.S. importers must extend those to the full 10-digit HTS code required for U.S. customs clearance.
The distinction matters operationally because many ecommerce brands source from manufacturers who provide product HS codes based on their origin country’s system. A Chinese manufacturer might provide a six-digit HS code that’s accurate for Chinese export classification but insufficient for U.S. import purposes. The brand must extend the classification to the full 10-digit U.S. HTS code, and the additional four digits can significantly affect duty rates and compliance requirements. Relying solely on supplier-provided HS codes without verifying the complete U.S. HTS classification creates the gap where errors emerge.
Why HTS classification directly affects duties, taxes, and clearance speed
The financial impact of HTS classification stems from duty rates that vary dramatically by product type. Normal Trade Relations (NTR) duty rates under the U.S. HTS range from zero percent (duty-free) to over 35% for certain sensitive products. The majority of consumer goods fall in the 3-15% range, but variations within seemingly similar product categories can be substantial. A knitted cotton T-shirt might face 16.5% duty under HTS 6109.10.0012, while a woven cotton T-shirt classified under 6205.20.2015 faces 19.7% duty. The fabric construction (knitted versus woven) drives a 3.2 percentage point difference that multiplies across every shipment.
Additional duties beyond standard tariff rates can apply based on HTS classification. Section 301 tariffs targeting Chinese imports added 7.5-25% additional duties on thousands of HTS codes starting in 2018-2019, with specific exclusions for certain products. Antidumping and countervailing duties apply to specific product-country combinations identified by HTS code. Trade agreement preferential rates under USMCA, various bilateral agreements, or Generalized System of Preferences programs require specific HTS codes to qualify for reduced or duty-free treatment. Missing a preferential rate opportunity because of incorrect classification means paying standard duties on products eligible for zero-duty treatment.
Clearance speed suffers when HTS codes trigger additional scrutiny or requirements. Certain HTS codes require FDA prior notice, EPA registration, CPSC compliance certification, or USDA permits before customs release. Products misclassified under codes that don’t require these permits will be detained at the border when customs identifies the discrepancy, creating unexpected delays while correct documentation is obtained. Even when permits aren’t required, unusual or inconsistent HTS code usage can trigger examinations that delay release while customs physically inspects shipments.
The examination rate increases when classification patterns appear inconsistent or suspicious. Customs uses risk assessment algorithms that flag shipments where declared value seems inconsistent with typical values for the claimed HTS code, where HTS codes change frequently for the same supplier and product, or where classification doesn’t align with product descriptions. The commercial invoice is the primary document customs uses to verify the declared value of imported goods for duty calculation, so any discrepancies between the commercial invoice and the HTS code can trigger additional scrutiny. These flags trigger holds and examinations that add 3-10 days to clearance timelines, particularly problematic for time-sensitive inventory or products with upcoming promotional launches.
Statistical reporting accuracy depends on correct HTS classification. The Census Bureau uses HTS codes to track U.S. trade flows, and aggregate trade data drives policy decisions, quota administration, and market analysis. While individual brands may not care about national trade statistics, the same statistical detail that enables government tracking also enables competitors, market researchers, and business intelligence firms to monitor import volumes by specific product categories. Inconsistent or incorrect HTS usage can obscure a brand’s own import tracking, making it difficult to analyze seasonal patterns, supplier performance, or category trends.
Common HTS code mistakes ecommerce brands make
The most frequent classification error is using overly broad or vague HTS codes that don’t reflect actual product specifications. New importers often default to general “catch-all” classifications like 6307.90.9889 (Other made up textile articles) for textile products that should classify under more specific headings. While these general classifications may seem safer because they’re broad, they often carry higher duty rates than the correct, more specific code. The catch-all classification also fails to capture product detail needed for trade agreement qualification or quota tracking.
Inconsistent classification of identical products across multiple shipments creates audit exposure. When the same product from the same manufacturer classifies under different HTS codes in different entry documents, customs algorithms flag the inconsistency as potential misclassification or valuation manipulation. A brand importing ceramic mugs that uses HTS 6912.00.4810 for one shipment, 6912.00.4820 for another, and 6912.00.5000 for a third has created a pattern that invites scrutiny even if one of those codes is technically correct. Consistency matters as much as accuracy.
Relying entirely on supplier-provided codes without verification transfers classification responsibility to parties who lack accountability for U.S. customs compliance. Chinese suppliers frequently provide six-digit HS codes accurate for Chinese export purposes but incorrect or incomplete for U.S. import classification. Freight forwarders and customs brokers often accept whatever classification the shipper provides, particularly for smaller clients, because they’re not legally liable for misclassification (the importer of record bears that liability). Brands that blindly accept supplier or forwarder codes without independent verification own the consequences when customs later identifies errors. Importantly, the final determination of the correct HTS code and duty rate is made by U.S. Customs and Border Protection (CBP), not the importer or supplier.
Failing to update HTS codes when products change creates drift between actual merchandise and declared classification. A brand may have correctly classified a product when first importing in 2022, but subsequent design changes to materials, construction, or functionality may require different classification under HTS rules. Continuing to use the original code after product evolution creates misclassification even though the original determination was correct. This happens frequently with apparel when brands shift from woven to knitted fabrics, or with electronics when components change.
Ignoring Section 301 exclusions and modifications costs brands thousands in unnecessary tariffs. The Section 301 tariff regime targeting Chinese imports has undergone hundreds of modifications, exclusions, and reinstatements since 2018. Specific HTS codes have moved in and out of additional duty coverage, and exclusion processes have allowed certain products to avoid additional duties even when the HTS code is generally covered. Brands that don’t actively monitor Section 301 developments may pay 25% additional duties on products eligible for exclusions, or may be surprised by reinstatement of tariffs they believed were removed.
Misunderstanding the difference between material composition and product function causes classification errors. HTS classification sometimes depends on primary material (plastic versus metal, cotton versus synthetic fiber), but other times depends on functional purpose (kitchen utensil versus decorative item, toy versus functional tool). Classifying solely based on material without considering function, or vice versa, leads to incorrect determinations. A plastic food storage container and a plastic decorative bowl may be made of identical material but classify under completely different HTS chapters based on intended use.
Looking for a New 3PL? Start with this Free RFP Template
Cut weeks off your selection process. Avoid pitfalls. Get the only 3PL RFP checklist built for ecommerce brands, absolutely free.
Get My Free 3PL RFPOperational consequences of incorrect HTS codes
The immediate financial consequence of misclassification is paying the wrong duty rate, either overpaying when using codes with higher rates than applicable or underpaying when using lower-rate codes that don’t accurately describe the product. Overpayment creates lost margin that accumulates silently across every shipment. A brand importing $500,000 annually in products correctly classifiable at 5% duty but using codes at 12% duty pays $35,000 in unnecessary tariffs annually. This margin erosion persists until someone identifies and corrects the classification, and reclaiming overpaid duties requires filing formal protests within specific timeframes.
Underpayment triggers more severe consequences. When customs identifies that a product should classify under a higher duty rate than claimed, they issue a notice of redelivery or notice of action requiring payment of the duty shortage. If the pattern suggests negligence or intentional misclassification, penalties can equal the unpaid duties or even reach multiples of the shortage in cases of gross negligence or fraud. The statute of limitations for customs claims is five years, meaning a brand could face retroactive duty bills covering years of shipments.
Customs examinations disrupt supply chains and create unexpected costs. When shipments are selected for physical inspection due to classification concerns, the merchandise is removed from the container, examined, photographed, and reloaded. This process adds 3-10 days to clearance, incurs examination fees typically $150-400 per container, and creates demurrage charges if the examination delay causes the container to exceed free time at the port. During these inspections, customs will review the commercial invoice to verify the product value and classification, as the commercial invoice provides the essential figure needed to estimate duties based on applicable tariff rates. For brands operating on tight inventory timelines or JIT replenishment models, these delays can trigger stockouts with cascading customer satisfaction consequences.
Informed compliance letters from CBP notify importers that their classification practices are incorrect and must change. While not formal penalties, these letters create official records of non-compliance that increase scrutiny on future shipments and can elevate to formal enforcement if the brand doesn’t correct the issues. The correction often requires reclassifying months or years of prior entries and paying duty differentials retroactively.
Seizures occur in extreme cases where misclassification appears intentional or where products are prohibited or restricted under the claimed HTS code but not under the correct code. Footwear classified under codes claiming textile uppers when actually made of leather can be seized for false classification if customs suspects intentional duty avoidance. The seizure process requires formal petitions to reclaim merchandise and often results in civil penalties plus duty payments before release.
Binding ruling requests become necessary when HTS classification is unclear. Importers can request formal rulings from CBP that establish the correct HTS code for specific products. While binding rulings provide certainty and protection from future challenges, the ruling process takes 30-60 days on average and requires detailed product descriptions, samples, and technical specifications. Brands that should have obtained rulings before starting imports often discover the need only after problems emerge, creating the awkward situation of having imported under incorrect classification for months while awaiting the ruling that establishes the correct code.
Trade agreement benefits can be permanently lost. Many free trade agreements require products to be classified correctly under specific HTS codes to qualify for preferential duty treatment. If a brand has been incorrectly classifying products that would otherwise qualify for USMCA duty-free treatment, they’ve paid duties unnecessarily on every shipment. Worse, if they’ve been claiming preferential treatment under an incorrect HTS code, they may owe duties retroactively plus penalties for improper claims, even though the product would have qualified under the correct classification.
How ecommerce brands should approach HTS classification responsibly
The starting point for responsible HTS classification is accepting that classification is the importer’s legal responsibility, not the supplier’s, forwarder’s, or broker’s. U.S. law establishes the importer of record as responsible for declaring correct classification, value, and origin. While brands can and should leverage expertise from customs brokers and consultants, the ultimate accountability remains with the brand. This means investing time to understand classification for your specific product categories rather than outsourcing the entire function without oversight.
For brands importing small product catalogs (under 50 SKUs), direct research using the online Harmonized Tariff Schedule is feasible. The U.S. International Trade Commission publishes the complete HTS at usitc.gov with search functionality that allows keyword searching by product name or browsing by chapter. The HTS dataset is available to the public under a specific license, such as ‘us-pd’, ensuring open access for research and compliance purposes. The search engine provides starting points, but correct classification requires reading chapter notes, section notes, and heading text to confirm the code accurately describes the product. This research takes 30-60 minutes per product category but provides foundational understanding that prevents errors.
Requesting binding rulings from CBP for products where classification is ambiguous provides legal certainty. The ruling process requires submitting detailed product descriptions, material compositions, manufacturing methods, intended use, and often physical samples or technical drawings. CBP issues a written ruling that establishes the correct HTS code and binds the agency to honor that determination for identical products. Binding rulings remain valid until revoked or modified and provide complete protection from duty challenges on products matching the ruling description. The investment in obtaining rulings (typically legal costs of $1,000-3,000 per product) pays for itself quickly when dealing with high-volume or high-value imports.
Working with experienced customs brokers who specialize in your product category provides practical guidance. Not all customs brokers maintain the same level of classification expertise, particularly for niche products. Engaging a reputable customs brokerage with a proven track record can be invaluable for navigating complex classification issues and ensuring compliance. Brokers handling thousands of entries across dozens of industries may default to general classifications for unfamiliar products. Seeking brokers who regularly handle your product type (footwear, electronics, supplements, textiles) ensures they understand the nuances of classification rules specific to your category. Ask prospective brokers about their classification process, whether they carry errors and omissions insurance, and whether they obtain binding rulings for ambiguous products.
Establishing internal documentation of classification decisions creates defensible positions during audits. When determining HTS codes, document the reasoning: what chapter notes were considered, why specific subheadings were selected, what General Rules of Interpretation were applied, and what material composition or functionality drove the determination. This documentation demonstrates reasonable care and good faith compliance if customs later challenges the classification. Without documentation, brands appear to have arbitrarily selected codes without analysis.
Conducting periodic classification reviews as products evolve or tariff rules change prevents drift from correct codes. Schedule annual reviews where each imported product’s HTS code is verified against current tariff schedules, recent customs rulings, and actual product specifications. This review catches situations where product design changes have made original classifications obsolete, where new binding rulings have clarified previously ambiguous classifications, or where Section 301 modifications have changed applicable rates.
Monitoring customs rulings and Federal Register notices relevant to your product categories keeps classification current. CBP publishes new binding rulings weekly and proposed changes to HTS classifications annually. Industry-specific customs attorneys, trade associations, or compliance services can monitor these developments and alert brands to changes affecting their imports. This proactive monitoring prevents the scenario where a brand continues using codes that customs has specifically ruled incorrect in published decisions.
Using classification software or trade compliance platforms makes sense for brands with large, complex catalogs. Enterprise resource planning systems like NetSuite, SAP, or specialized trade compliance platforms like Amber Road (now E2open) or Descartes maintain HTS code databases with built-in logic for classification rules. These tools don’t eliminate the need for human judgment but provide frameworks that reduce errors and ensure consistency across product lines. The cost (typically thousands to tens of thousands annually) justifies itself for brands importing hundreds of SKUs where manual classification becomes unmanageable.
Building relationships with customs lawyers for complex situations provides specialized expertise. When dealing with products that blend multiple materials or functions, when products might qualify for specialized duty reduction programs, or when facing binding ruling challenges or penalty assessments, customs attorneys provide technical expertise that customs brokers typically don’t maintain. The hourly rates ($300-600) seem expensive until compared to the cost of misclassification across thousands of shipments or the penalties from improper handling of compliance issues.
For the most up-to-date information on HTS codes, regulations, and official rulings, visit the official U.S. Customs and Border Protection or USITC websites. For recent updates on USPS Hazmat shipping requirements, consult this guide.
Scale Faster with the World’s First Peer-to-Peer Fulfillment Network
Tap into a nationwide network of high-performance partner warehouses — expand capacity, cut shipping costs, and reach customers 1–2 days faster.
Explore Fulfillment NetworkHow to find the correct HTS code for your products
Finding the correct HTS code for your products is a vital step in ensuring smooth, compliant international trade and avoiding costly mistakes. The Harmonized Tariff Schedule (HTS) is the official system used by U.S. Customs and Border Protection to classify all merchandise imported into the United States, and it’s built on the global Harmonized System (HS) maintained by the World Customs Organization. Using the correct HTS code determines the applicable tariff rates, customs duties, and regulatory requirements for your shipment—making accuracy essential for every ecommerce brand.
To start, identify your product’s HS code, which forms the first six digits of the HTS code and is recognized worldwide for classifying traded products. This standardized numerical method is the backbone of most world trade, ensuring that products are described and categorized consistently across borders. Once you have the HS code, you’ll need to determine the full 10-digit HTS code required for U.S. imports, which includes additional statistical categories and country-specific details.
The U.S. International Trade Commission (USITC) offers a robust online search engine at usitc.gov, where you can search for the correct HTS code by product name, description, or keyword. This tool allows you to browse the tariff schedule, review applicable codes, and compare descriptions to find the best match for your merchandise. For example, searching “coffee beans” will present different codes depending on whether the beans are raw, roasted, or decaffeinated—each with its own applicable tariff rates and customs duty requirements.
When using the USITC search engine, pay close attention to the product descriptions and any notes or rules that may affect classification. The international harmonized system is detailed, and small differences in product characteristics—such as material, use, or processing—can change the correct HTS code and, consequently, the duty rates and regulations that apply.
For more complex products or when in doubt, consulting a licensed customs broker is highly recommended. Customs brokers are experts in classifying traded products and can help you navigate the nuances of the tariff schedule, ensuring you find the correct HTS code and comply with all applicable regulations. They can also advise on customs duties, additional tariffs, and any special requirements for your shipment, such as licenses or permits.
In addition to the USITC, the Census Bureau’s website provides valuable resources, including a searchable database of HTS codes and their statistical categories. If you need further clarification, you can contact the USITC or Customs and Border Protection directly for guidance. These agencies can help you interpret the tariff schedule, understand the rules for classifying your merchandise, and provide official resources for determining the correct code.
Remember, the accuracy of your HTS code affects not only the duty you pay but also your compliance with U.S. import regulations. Incorrect codes can lead to shipment delays, fines, or even seizure by border protection authorities. Always verify the code with your manufacturer or supplier, but don’t rely solely on their information—especially if they provide only the first six digits or use codes from another country’s system.
In summary, finding the correct HTS code is a critical part of your import process. Use the USITC’s online search engine, consult with a knowledgeable customs broker, and leverage official resources from the Census Bureau and CBP to ensure your products are classified accurately. This diligence will help you avoid costly errors, streamline your shipments, and keep your ecommerce business compliant in the fast-moving world of international trade.
The long-term margin impact of classification accuracy
The cumulative financial impact of HTS classification accuracy compounds across the business lifetime. A brand importing $2 million annually who uses HTS codes averaging 8% duty when correct classification would result in 5% duty pays $60,000 annually in unnecessary tariffs. Over five years, this margin erosion reaches $300,000 plus opportunity cost of capital that could have funded growth, marketing, or inventory. In the long run, accurate HTS code management is essential for sustained business success and compliance. The loss is particularly painful because it’s invisible in standard financial reporting unless someone specifically analyzes landed cost variance by HTS code.
The compliance risk exposure persists for five years after each entry. Customs maintains the statutory authority to review and demand additional duties for entries filed up to five years prior. This means errors made in year one of imports can trigger retroactive bills in year five, long after the brand has forgotten the specific shipments or grown comfortable with existing classification practices. The surprise nature of these assessments can create cash flow crises for brands unprepared for five-figure duty bills covering years of accumulated errors.
The competitive disadvantage from incorrect classification can be decisive in price-sensitive markets. When competing brands classify identical products correctly at lower duty rates, they achieve better landed costs and can either price more competitively or maintain higher margins. A brand paying 12% duty on products that competitors correctly classify at 6% faces a 6-percentage-point landed cost disadvantage that multiplies through every sale. In ecommerce where 50-100 basis points can separate profitable products from losers, this duty differential can make entire product lines unviable.
The strategic limitation from poor classification prevents taking advantage of trade agreement benefits or duty reduction programs. Products that might qualify for USMCA preferential treatment (duty-free) if correctly classified and documented yield no benefits when misclassified. Brands miss opportunities to source from agreement-partner countries or restructure supply chains to qualify for preferential programs because they don’t understand which HTS codes enable these benefits. The strategic flexibility that comes from understanding classification rules creates options that poorly-managed brands never realize exist.
Frequently Asked Questions
What is an HTS code and why does it matter for ecommerce imports?
An HTS code (Harmonized Tariff Schedule code) is a standardized 10-digit numerical classification that identifies imported products for U.S. Customs and Border Protection, determining the duties, taxes, and regulations that apply to each shipment. For ecommerce brands importing inventory from overseas manufacturers, HTS classification directly affects landed costs (duty rates range from 0-35%), clearance speed (certain codes require permits or trigger examinations), and compliance risk (incorrect classification can result in fines and penalties). A single misclassified product category can trigger duty rate differences of 5-25%, translating to thousands in unexpected costs annually, with audit exposure persisting for five years after each entry.
How is an HTS code structured and what do the digits mean?
HTS codes use a 10-digit hierarchical structure where meaning builds from general to specific. The HTS code consists of 10 digits, and each number provides increasing detail about the product. The first six digits align with the international HS code used globally for classifying traded products, enabling consistent classification across countries. Digits seven and eight represent U.S.-specific statistical categories providing more granular product detail. Digits nine and ten identify additional statistical details used by the Census Bureau for trade reporting. The full 10-digit HTS code is sometimes referred to as the Schedule B number or ‘b number’. For example, HTS 6109.10.0012 represents: Chapter 61 (knitted/crocheted apparel), heading 6109 (T-shirts), subheading 6109.10 (of cotton), and U.S.-specific detail identifying men’s/boys’ white T-shirts with short sleeves. This structure means small changes in digits can significantly affect applicable duty rates and compliance requirements.
What’s the difference between HTS codes and HS codes?
HS codes (Harmonized System codes) are the six-digit international foundation maintained by the World Customs Organization that classify traded products consistently across most world trade. The Harmonized System serves as the global system for classifying and describing goods in global trade and customs procedures. HTS codes (Harmonized Tariff Schedule codes) extend the six-digit HS foundation with four additional country-specific digits for U.S. imports (total 10 digits). The first six digits remain consistent internationally (a cotton T-shirt is 6109.10 worldwide), but the complete 10-digit HTS code is U.S.-specific. This means suppliers may provide accurate six-digit HS codes from their country, but U.S. importers must extend classification to the full 10-digit HTS code required for customs clearance, and those additional four digits can significantly affect duty rates and compliance requirements.
What are the consequences of using incorrect HTS codes?
Incorrect HTS classification creates multiple consequences: immediate financial impact from paying wrong duty rates (overpaying loses margin, underpaying triggers penalty exposure), customs examinations that add 3-10 days to clearance plus $150-400 in fees per container, informed compliance letters requiring retroactive corrections and duty payments, potential seizures in cases of suspected intentional misclassification, and five-year audit exposure where customs can demand additional duties on past shipments. The final determination of duty rates and classification is made by U.S. Customs and Border Protection (CBP), not the importer, and CBP has the authority to make this official ruling on customs matters. A brand importing $500,000 annually using codes at 12% duty instead of correct 5% classification pays $35,000 in unnecessary tariffs annually. Systematic underpayment can trigger penalties equaling or exceeding the unpaid duties, and the statute of limitations runs five years from entry date.
How should ecommerce brands determine correct HTS codes for their products?
Brands should approach HTS classification as their legal responsibility (not the supplier’s or broker’s) through several steps: research using the online Harmonized Tariff Schedule at usitc.gov for small catalogs (under 50 SKUs), noting that the HTS dataset is available under a public license such as ‘us-pd’; read chapter notes and section notes to confirm codes accurately describe products; request binding rulings from CBP for ambiguous products (providing detailed descriptions, samples, technical specs for written determinations that provide legal certainty); work with experienced customs brokers specializing in your product category who understand classification nuances; document classification reasoning internally (chapter notes considered, subheading selection, material composition) to demonstrate reasonable care during audits; conduct annual classification reviews as products evolve or tariff rules change; and monitor customs rulings and Federal Register notices for developments affecting your product categories.
For authoritative guidance on HTS codes, duty rates, and rulings, visit the official USITC or CBP websites.
Can incorrect HTS codes affect free trade agreement benefits?
Yes, incorrect HTS classification can eliminate or invalidate free trade agreement preferential treatment. Many agreements (USMCA, bilateral agreements, Generalized System of Preferences) require products to classify under specific HTS codes to qualify for reduced or duty-free treatment. Products misclassified under codes that don’t align with agreement eligibility lose preferential benefits, meaning brands pay standard duties on imports that could qualify for zero-duty treatment if correctly classified. Worse, claiming preferential treatment under incorrect HTS codes can trigger retroactive duty bills plus penalties for improper claims, even if products would have qualified under correct classification. The strategic limitation prevents brands from restructuring supply chains to take advantage of trade agreement opportunities they don’t realize exist.
Written By:

Indy Pereira
Indy Pereira helps ecommerce brands optimize their shipping and fulfillment with Cahoot’s technology. With a background in both sales and people operations, she bridges customer needs with strategic solutions that drive growth. Indy works closely with merchants every day and brings real-world insight into what makes logistics efficient and scalable.
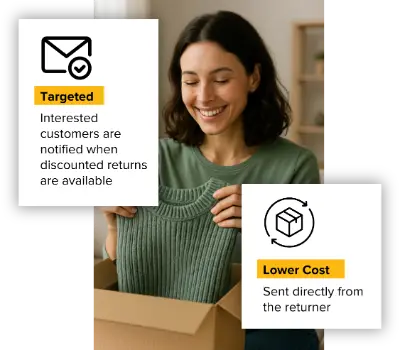
Turn Returns Into New Revenue
Related Articles
Seller Fulfilled Prime Works — But Only With the Right Operating Model
Seller Fulfilled Prime is attractive for very rational reasons.
SLA Meaning in Logistics: What Service Level Agreements Actually Guarantee (and What They Don’t)
The gap between what 3PL providers promise in SLA marketing (“99.
Inventory Turnover Ratio: What It Is, How to Calculate It, and How Ecommerce Brands Improve It
Inventory turnover ratio (also called stock turnover) measures how many times a company sells and replaces its inventory during an accounting period.
Shipping Labels Explained: What They Include, How They Work, and Common Mistakes
In this article
22 minutes
- What shipping labels are and why they matter legally
- Essential components every shipping label must contain
- How carrier sorting systems process label data
- Printing shipping labels: methods and tips for accuracy
- Buying and managing shipping labels efficiently
- Label customization and templates for branding and compliance
- Environmental considerations for shipping labels
- Common shipping label mistakes that cost merchants money
- How outbound labels differ from return labels
- Best practices for preventing label-related issues
- Frequently Asked Questions
Shipping labels are the operational backbone of ecommerce fulfillment, a small piece of paper that determines whether packages reach customers successfully or trigger costly failures. For Shopify brands processing thousands of orders, label errors translate directly into surcharges of $13-$331 per package, delivery delays affecting 70% of customer retention, and annual losses that can reach six figures. In the e-commerce sector, bulk shipping is common and operational efficiency is crucial to save time and reduce costs. Efficiently creating a shipping label—and related documents like the packing slip—is essential for e-commerce businesses to streamline fulfillment. This guide provides the comprehensive technical knowledge and operational best practices needed to optimize label management across the entire shipping lifecycle.
Most businesses can print shipping labels using regular office printers, but thermal printers are recommended for high-volume shipping to improve efficiency and save time.
The stakes are significant: 22% of delivery failures stem from address issues, carrier surcharges now account for 20-40% of parcel delivery spend, and the average cost to rectify a single shipping error runs $35-$70. Understanding how labels function, from barcode symbology to carrier sorting operations, empowers brands to prevent these costly mistakes before packages leave the warehouse.
What shipping labels are and why they matter legally
A shipping label is far more than a destination sticker. It’s a legally binding document that establishes the contractual relationship between shipper and carrier. When you create a label, you’re entering an agreement that obligates you to provide accurate shipping data (addresses, weight, dimensions) while the carrier commits to transporting the package according to the selected service level.
Shipping labels can be generated through carrier websites or third-party software, including services like Pirate Ship or Stamps.com. You can create shipping labels online or manually through your carrier’s online services, but using shipping software solutions can streamline the process.
The FTC’s Mail, Internet, or Telephone Order Merchandise Rule (16 CFR Part 435) governs the legal framework for ecommerce shipping. Sellers must have a reasonable basis to ship within the stated timeframe or within 30 days if no time is specified. Violations carry civil penalties exceeding $40,000 per occurrence, and recent enforcement has included settlements of $9.3 million. This rule applies regardless of whether you use third-party fulfillment. Merchants remain legally responsible for shipping compliance.
Shipping labels create a documented chain of custody through their tracking numbers. Each scan generates a timestamped location record, establishing an audit trail from pickup through delivery. This chain includes GPS tracking at pickup, identity verification at each transfer point, and proof of delivery with timestamps and signatures. For disputes and chargebacks, this documentation becomes critical evidence. Real-time tracking can prevent up to 60% of shipping-related chargebacks.
Labels encode the specific service agreement between shipper and carrier. The service type identifier embedded in USPS Intelligent Mail barcodes indicates mail class and requested services. UPS labels must include the proprietary MaxiCode, postal barcode, current routing code, service icon, and 1Z tracking number. FedEx requires distinct label layouts for Ground versus Express shipments. These elements aren’t optional decorations. They’re contractual terms the carrier uses to determine handling obligations.
Essential components every shipping label must contain
The industry standard 4×6 inch label packs remarkably dense information that enables automated sorting across carrier networks. A standard shipping label size is typically 4″ x 6″ for most carriers, but different carriers may have different size requirements. It is important to print shipping labels at their actual size to ensure barcode readability and compliance with carrier requirements. Understanding each element helps prevent the errors that trigger surcharges and delays.
USPS Publication 28 establishes the foundation for domestic address formatting across all carriers. The required three-line format includes recipient name, street address with secondary unit designator (APT, STE, UNIT), and city/state/ZIP. All uppercase letters are preferred for machine readability, and punctuation should be avoided except for the hyphen in ZIP+4 codes. Directionals like N, S, E, W are critical. Missing directionals frequently misdirect mail to the wrong delivery area.
The ZIP+4 code adds four digits specifying the sector and segment for more precise routing, while the 11-digit Delivery Point Code identifies the exact delivery location. A fully populated 11-digit routing code pushes packages deeper into automation earlier, shaving 1-2 days off average delivery times. Major carriers require delivery addresses in minimum 10-point font and return addresses in minimum 8-point font, using sans-serif typefaces like Arial or Helvetica.
Modern shipping labels incorporate multiple barcode types, each serving specific purposes in the carrier network. The USPS Intelligent Mail Package Barcode (IMpb) uses GS1-128 symbology and encodes the unique Package Identification Code required for commercial pricing. The newer Intelligent Mail Matrix Barcode (IMmb) adds 2D capability for improved scanning on irregular packages and polybags.
UPS uses the MaxiCode, a 2D matrix barcode approximately one inch square containing 884 hexagonal modules around a central bullseye finder pattern. Mode 2 handles domestic shipments with numeric ZIP codes, while Mode 3 processes international shipments with alphanumeric postal codes. The encoded data includes postal code, country code (840 for US), service class, tracking number, SCAC code, and package details.
FedEx labels incorporate PDF417 stacked barcodes for address and recipient data, alongside Code 128 linear barcodes for tracking numbers. The Code 128/GS1-128 format is the most common linear barcode across carriers, encoding all 128 ASCII characters with a modulus 103 weighted checksum for verification.
Each carrier uses distinct tracking number formats that enable automated parsing and verification. USPS uses 20-22 digits starting with 94/93/92/95 for domestic tracking, or 13-character S10/UPU format (e.g., EA 000000009 US) for international. UPS uses 18 characters starting with “1Z” followed by 6 alphanumeric shipper account digits, 2-digit service code, 7-digit package identifier, and check digit. FedEx uses 12-22 digits, all numeric without prefix letters.
The UPS service level codes embedded in positions 9-10 indicate the shipping method: 01 for Next Day Air, 02 for 2nd Day Air, 03 for Ground, 12 for 3 Day Select, and so forth. The service level on a shipping label indicates delivery speed, such as Express, Ground, or Priority Mail. Carriers allow users to choose shipping speed and service level based on cost, such as USPS Ground Advantage or UPS Ground.
Shipping labels must meet the size and formatting requirements of major carriers like USPS, UPS, and FedEx to ensure compatibility and smooth processing.
Let AI Optimize Your Shipping and Boost Profits
Cahoot.ai software selects the best shipping option for every order—saving you time and money automatically. No Human Required.
See AI in ActionHow carrier sorting systems process label data
Understanding carrier operations reveals why label quality matters so much. FedEx’s Memphis SuperHub processes 56,000-72,000 packages per hour using six-sided scanning tunnels that capture barcode information from all angles. UPS Worldport in Louisville handles 416,000 packages per hour through 546 camera tunnels across 155 miles of conveyors. At these speeds, even small label defects create cascading delays.
When packages enter a sorting facility, they pass through tunnel-based barcode readers where multiple cameras capture images from all angles as items move on conveyors. The system extracts destination ZIP code and routing data, categorizes packages by size (standard boxes, “smalls,” irregulars), and directs items via conveyor systems to appropriate staging areas for outbound transport.
A unique shipping label must be created for each package; old labels cannot be reused to ensure accurate tracking and processing. Many businesses use a shipping API to automate the creation of shipping labels, track packages, and integrate with e-commerce systems for efficient sorting and routing.
The Intelligent Mail Barcode routing code hierarchy drives sorting decisions. The 5-digit ZIP determines basic geographic region, ZIP+4 specifies delivery area and block, and the full 11-digit code identifies the individual address. Packages enter the automated network at different depths based on routing code completeness. Those with only 5-digit ZIPs require more manual sorting intervention.
When barcodes can’t be scanned due to damage, wrinkles, glare, or poor print quality, packages divert to exception lanes for manual intervention. Workers rescan with handheld devices, manually enter ID numbers, print replacement labels, and re-induct packages into the sorting process. FedEx creates a “Shipment Exception: Barcode Label Unreadable and Replaced” status for these cases. Each unreadable package requires at least double the processing of automatically sorted items. If 5% of 40,000 packages per hour are rejected, that’s 2,000 packages requiring manual handling.
Tracking updates generate at defined touchpoints rather than continuously. Key events include pickup scan when carrier takes possession, arrival scan at sorting hub unload, departure scan when sorted and loaded for outbound transport, “out for delivery” when placed on delivery vehicle, and delivered when scanned at customer location.
Printing shipping labels: methods and tips for accuracy
Printing shipping labels accurately is essential for ensuring your packages reach their destinations without delays or complications. The method you choose to print shipping labels can impact both the quality of the label and the efficiency of your shipping process. Thermal printers are widely regarded as the gold standard for shipping labels, especially for businesses handling moderate to high shipping volumes. These printers use heat to create crisp, smudge-proof barcodes and text, eliminating the need for ink or toner and producing labels in seconds. For occasional shippers or those with low volume, inkjet or laser printers can suffice, but it’s important to ensure the label format matches carrier requirements and that the tracking number and barcode are clear and scannable.
To streamline the process and minimize errors, use shipping software or online platforms that allow you to create shipping labels with all necessary information pre-filled, including the shipping address, tracking number, and service type. Templates can help maintain consistency and compliance with carrier standards. When applying labels, affix them to a flat, unobstructed surface on the package and use clear tape to cover the label—this protects it from moisture and abrasion while ensuring the barcode remains readable. Avoid placing tape directly over the barcode if it causes glare, as this can interfere with scanning during delivery. By following these best practices, you can ensure your shipping labels work as intended and your packages move smoothly through the carrier’s process.
Buying and managing shipping labels efficiently
Managing the purchase and inventory of shipping labels is a key factor in controlling shipping costs and maintaining operational efficiency. For businesses shipping large volumes, buying shipping labels in bulk can significantly reduce the cost per label and help save money over time. Many shipping platforms and carriers offer volume discounts or access to discounted rates, making it more cost effective to buy shipping labels through these channels rather than at retail rates. Leveraging these savings is especially important for small businesses and ecommerce stores looking to maximize their margins.
To keep your shipping process running smoothly, implement a system to track label inventory and usage. This helps prevent running out of labels during peak shipping periods and allows you to reorder in advance. Shipping software with built-in label management features can automate much of this process, alerting you when supplies are low and even helping you compare rates across carriers to find the best deal for each shipment. By optimizing how you buy and manage shipping labels, you not only save money but also ensure your shipping operations remain uninterrupted and efficient.
ShipStation vs. Cahoot: 21x Faster, Real Results
Get the inside scoop on how a leading merchant switched from ShipStation to Cahoot—and what happened next. See it to believe it!
See the 21x DifferenceLabel customization and templates for branding and compliance
Customizing shipping labels is a powerful way to reinforce your brand and ensure compliance with carrier and regulatory requirements, especially for international shipments. By using custom templates, businesses can add their logo, brand colors, and tailored messaging to every label, creating a professional and cohesive customer experience from the moment the package arrives. Custom templates also allow you to include essential information specific to your business or industry, such as handling instructions or regulatory disclosures for hazardous materials.
When shipping with major carriers like USPS, UPS, or FedEx, it’s crucial that your custom labels adhere to their formatting and data requirements. This is particularly important for international shipments, where compliance with customs documentation and country-specific regulations is mandatory. Many shipping platforms offer customizable templates and compliance tools that make it easy to create shipping labels that meet both branding and regulatory needs. By leveraging these features, you can create shipping labels that not only look professional but also ensure smooth processing with your preferred carrier, whether you’re shipping domestically or internationally.
Environmental considerations for shipping labels
As sustainability becomes a growing priority for businesses and consumers alike, it’s important to consider the environmental impact of your shipping labels. Choosing eco-friendly options, such as labels made from recycled or biodegradable materials, can help reduce your company’s carbon footprint. Direct thermal labels are an excellent choice for environmentally conscious shippers, as they require no ink or toner—just heat—minimizing waste and simplifying the recycling process. These thermal labels are compatible with direct thermal printers, which are both efficient and cost effective for producing high volumes of shipping labels.
Proper disposal of used shipping labels is also essential. Encourage recycling of label backing materials and ensure that any labels containing sensitive information are disposed of securely. By integrating sustainable materials and responsible disposal practices into your shipping operations, you not only reduce environmental impact but also demonstrate your commitment to sustainability to your customers. Making thoughtful choices about the materials and processes you use for shipping labels can help your business operate more responsibly while still meeting all your shipping needs.
Common shipping label mistakes that cost merchants money
Label errors create both direct costs (surcharges, reshipping, postage) and indirect costs (customer service, lost customers). Postage is a key cost component of shipping labels, and purchasing postage at discounted rates through online or software solutions can help save money and avoid paying retail rates at the carrier’s office. The average ecommerce fulfillment error rate runs 1-3%. For a brand shipping 100,000 orders monthly, that translates to 1,000-3,000 errors and potential losses of $60,000-$150,000.
Address formatting errors affect 4.7% of shipping addresses entered at checkout, according to EasyPost data. These errors contribute to the 22% of delivery failures resulting from incorrect or incomplete addresses. Beyond failed deliveries, carriers charge substantial fees for corrections: FedEx charges $22.50 per address correction for Express and Ground shipments, while UPS charges $13.40 per correction (escalating to $91 for Ground with Freight Pricing).
Common address errors include missing apartment or suite numbers, incorrect directionals (N vs S), wrong ZIP codes, and outdated addresses for recipients who’ve moved. Missing secondary unit designators are particularly problematic for multi-unit buildings where packages may be returned or delivered to wrong addresses.
Dimensional weight pricing applies to all major carriers, and inaccuracies trigger billing adjustments. Both UPS and FedEx use a 139 divisor for daily rates (166 for retail), meaning packages are billed for the greater of actual weight or dimensional weight calculated as (Length × Width × Height) ÷ 139. To prevent extra charges, package weight should be measured accurately using a digital scale.
As of August 2025, both UPS and FedEx round every fractional inch UP before calculating dimensional weight. A box measured at 11.1 × 8.5 × 6.2 inches now rounds to 12 × 9 × 7 inches, potentially increasing billed weight by approximately 20%. USPS adds a $1.50 fee for missing or incorrect dimensions on packages exceeding one cubic foot.
Poor barcode quality creates immediate operational problems. Common causes include inadequate printhead maintenance, incorrect burn temperature making bars too thick or thin, creased or folded labels, tape covering barcodes causing glare, and wrong printer settings for DPI or margins. Carriers require specific ANSI barcode grades for reliable scanning, grade C minimum, with 70% recommended at A or B. Most thermal labels are waterproof, oil-proof, and scratch-resistant, which helps maintain barcode quality and label durability during transit.
Carriers apply substantial surcharges for packages exceeding standard parameters. UPS charges $25-$52.75 for additional handling on packages weighing over 50 pounds, with longest side exceeding 48 inches, or second-longest side over 30 inches. Large package surcharges reach $160-$235 per package for cubic volume exceeding 17,280 cubic inches. FedEx oversized surcharges range from $240-$331 per commercial package, with 18.5% increases in recent rate schedules.
Direct thermal labels do not require ink or ribbons and are ideal for short-term use like shipping and logistics, making them a cost-effective and efficient choice for most shipping label needs.
80% of customs delays result from incorrect or missing documentation according to DHL data. Common international errors include missing product descriptions, inaccurate declared values, incorrect HS/tariff codes, missing shipper or consignee details, wrong country of origin, and missing tax identifiers.
As of September 1, 2025, USPS requires six-digit HS codes on all international commercial shipments regardless of mail class, aligning with Universal Postal Union regulations. The EU requires HS codes for all items, with detailed descriptions, as part of ICS2 reform implemented March 2023. Brazil requires recipient Tax ID (CPF or CNPJ) on all labels. Missing information results in return or disposal.
Proper labeling and handling procedures are essential to ensure packages arrive in perfect condition and to avoid costly errors and delays.
How outbound labels differ from return labels
Return labels reverse the standard shipping flow and involve different payment structures, expiration policies, and increasingly popular paperless options through QR codes.
Prepaid return labels charge payment at label creation regardless of use. USPS and some integrations offer this model, which provides fixed costs and avoids certain carrier surcharges. However, merchants pay even for unused labels.
Scan-based (pay-on-use) labels only charge when the carrier scans the label into the system. FedEx and UPS offer this model through direct accounts, enabling merchants to include return labels in all outbound packages without upfront cost. The tradeoff includes potential additional fees and billing complexity. For brands that want to provide easy returns without paying for unused labels, scan-based typically makes more economic sense. 78% of consumers prefer prepaid return labels with cost deducted from refund.
USPS return labels remain valid for up to 365 days (one year) for scan-based returns, the longest validity among major carriers. Unused prepaid labels auto-refund after 28 days without tracking activity. UPS return labels generally don’t expire, though shipments can be voided online within 90 days, with no refunds possible after 180 days. FedEx printed labels typically remain valid for about two weeks, while email labels can last up to two years before printing.
QR code returns work through a streamlined process: customers initiate returns via portal, receive a QR code via email instead of a PDF label, bring the package and code to designated drop-off locations (FedEx Office, UPS Store, Walgreens, participating Post Offices), where staff scans the code from the customer’s phone and prints the label on-site. 67% of shoppers now prefer package-free, label-free returns.
Cut Costs with the Smartest Shipping On the Market
Guranteed Savings on EVERY shipment with Cahoot's AI-powered rate shopping and humanless label generation. Even for your complex orders.
Cut Costs TodayBest practices for preventing label-related issues
Operational excellence in label management requires investment in appropriate technology, rigorous processes, and integration with shipping software that catches errors before labels print. Choosing the right shipping label technology and process depends on the specific needs of your business, such as shipping volume, label durability, and carrier preferences.
For brands shipping 50+ packages monthly, thermal printers are essential. Using a thermal label printer is recommended for frequent shipping as it simplifies the process and saves costs. Direct thermal printing requires no ink, toner, or ribbon. Heat-sensitive labels turn black where heated, producing high-contrast, smudge-proof, water-resistant barcodes in 1-2 seconds per label. Thermal transfer printing uses ribbon for even longer-lasting labels suitable for outdoor or cold storage applications.
The cost differential is substantial: inkjet printing for 600 labels monthly runs approximately $500-600 per year in consumables versus $50-100 for thermal (label rolls only). Popular thermal printer brands include Rollo, MUNBYN, Zebra, and Dymo 4XL. The break-even point typically occurs within two years at moderate shipping volumes.
You can print shipping labels at home if you have the right printing tools and equipment. Place labels on the largest flat surface, preferably the top of packages, centered and parallel to the longest side. Avoid seams, edges, corners, closures, and areas that could bend or tear during handling. Labels must lie flat without wrinkles, bubbles, or folded edges. Any distortion can prevent barcode scanning.
Always remove or completely cover previous barcodes and addresses on reused boxes. Multiple labels on the same package should all go on the same side without overlapping. USPS specifically requires labels placed parallel to the longest side, secured with 2-inch clear packing tape.
CASS-certified (Coding Accuracy Support System) address validation represents the gold standard for preventing address errors. These services match addresses against USPS databases, standardize formatting, add missing components, and verify deliverability. Leading services include Smarty (SmartyStreets) with 250 free lookups monthly, Melissa Data with 38+ years of experience and NCOA change-of-address processing, and EasyPost with validation integrated into shipping APIs.
Key features to implement include real-time API validation at checkout, batch processing for database cleanup, autocomplete for shipping forms, and NCOA processing to catch moved recipients. Address validation typically catches the 4.7% of checkout addresses with errors before they become $22.50 correction fees.
Custom shipping labels can enhance branding and improve operational efficiency for businesses.
Frequently Asked Questions
What is a shipping label and what makes it legally binding?
A shipping label is a legally binding document that establishes the contractual relationship between shipper and carrier. When you create a label, you enter an agreement obligating you to provide accurate shipping data (addresses, weight, dimensions) while the carrier commits to transporting the package according to the selected service level. The label creates a documented chain of custody through tracking numbers, with each scan generating a timestamped location record from pickup through delivery. The FTC’s Mail Order Rule (16 CFR Part 435) governs ecommerce shipping, requiring sellers to ship within stated timeframes or 30 days if unspecified, with violations carrying civil penalties exceeding $40,000 per occurrence.
What are the essential components that must be on every shipping label?
Every shipping label must contain properly formatted sender and recipient addresses (name, street with unit designator, city/state/ZIP in uppercase), multiple barcode types (USPS Intelligent Mail Package Barcode using GS1-128, UPS MaxiCode, or FedEx PDF417), carrier-specific tracking numbers (USPS 20-22 digits starting with 94/93/92/95, UPS 18 characters starting with “1Z”, FedEx 12-22 numeric digits), service level indicators, package weight and dimensions, and routing codes. The standard 4×6 inch label uses minimum 10-point font for delivery addresses and 8-point for return addresses in sans-serif typefaces like Arial or Helvetica.
How do carriers use shipping label data to sort and route packages?
Carriers process packages through automated sorting facilities using tunnel-based barcode readers with multiple cameras capturing images from all angles as items move on conveyors at speeds of 56,000-72,000 packages per hour. The system extracts destination ZIP code and routing data from barcodes, categorizes packages by size, and directs items via conveyor systems to appropriate staging areas. The USPS Intelligent Mail Barcode routing code hierarchy drives sorting: 5-digit ZIP determines geographic region, ZIP+4 specifies delivery area and block, and full 11-digit code identifies the individual address. Packages with complete 11-digit routing codes enter automation earlier, shaving 1-2 days off delivery times.
What are the most common shipping label mistakes and what do they cost?
The most costly label mistakes include address formatting errors (affecting 4.7% of checkout addresses, causing 22% of delivery failures, costing $13.40-$22.50 per correction), dimensional weight discrepancies (triggering $1.50-$331 surcharges, with August 2025 rounding changes increasing billed weight by approximately 20%), barcode print quality failures (causing packages to divert to exception lanes requiring double the processing time), additional handling surcharges ($25-$235 for oversized packages), and missing international customs documentation (causing 80% of customs delays). The average ecommerce error rate of 1-3% translates to $60,000-$150,000 in annual losses for brands shipping 100,000 orders monthly.
How do return shipping labels differ from outbound labels?
Return labels reverse the shipping flow and use different payment structures. Prepaid return labels charge at creation regardless of use (providing fixed costs but charging for unused labels), while scan-based labels only charge when scanned into the carrier system (FedEx/UPS offer this, enabling merchants to include labels in packages without upfront cost). Expiration varies significantly: USPS return labels valid 365 days for scan-based (longest among carriers), UPS labels generally don’t expire (voidable within 90 days), FedEx printed labels valid about two weeks. QR code returns eliminate printer requirements: customers receive QR codes via email, bring packages to drop-off locations where staff scans codes and prints labels on-site. 67% of shoppers now prefer package-free, label-free returns.
What technology and processes prevent shipping label errors?
Preventing label errors requires thermal printers for brands shipping 50+ monthly (producing smudge-proof, water-resistant barcodes in 1-2 seconds, costing $50-100 annually versus $500-600 for inkjet), CASS-certified address validation (catching 4.7% of checkout errors before they become $22.50 correction fees through real-time API validation, batch processing, and NCOA change-of-address checking), proper label placement (largest flat surface, centered, parallel to longest side, avoiding seams/edges/corners), and shipping software integration (eliminating manual data entry through automated label generation, real-time address validation, rate shopping, carrier compliance formatting, and batch processing). High-volume operations should implement quality checkpoints at picking, packing, label generation, and pre-ship inspection stages.
Written By:
Indy Pereira
Indy Pereira helps ecommerce brands optimize their shipping and fulfillment with Cahoot’s technology. With a background in both sales and people operations, she bridges customer needs with strategic solutions that drive growth. Indy works closely with merchants every day and brings real-world insight into what makes logistics efficient and scalable.
Turn Returns Into New Revenue
Related Articles
Seller Fulfilled Prime Works — But Only With the Right Operating Model
Seller Fulfilled Prime is attractive for very rational reasons.
SLA Meaning in Logistics: What Service Level Agreements Actually Guarantee (and What They Don’t)
The gap between what 3PL providers promise in SLA marketing (“99.

HTS Code Explained: What It Is, Why It Matters, and How Ecommerce Brands Use It
HTS codes (Harmonized Tariff Schedule codes) are standardized numerical classifications that identify imported products for U.
USPS Click-N-Ship Explained: How It Works, Costs, and When Sellers Should Use It
In this article
18 minutes
- What Click-N-Ship actually does and how it evolved
- The step-by-step workflow for creating labels
- Available services span domestic and international shipping
- How Click-N-Ship compares with shipping software for ecommerce sellers
- The pricing reality has changed significantly
- The hidden cost equation goes beyond postage rates
- When Click-N-Ship genuinely makes sense for sellers
- Where Click-N-Ship breaks down for growing brands
- A decision framework for choosing shipping tools
- Frequently Asked Questions
USPS Click-N-Ship is the postal service’s free online label-printing tool, and for most Shopify sellers shipping more than 50 packages monthly, it’s already time to move beyond it. While Click-N-Ship underwent a significant upgrade in July 2024 that added commercial pricing and batch capabilities, the platform still lacks the ecommerce integrations, automation, and multi-carrier options that growing brands require. Click-N-Ship is a great option for small businesses, craft sellers, and frequent shippers who want to enjoy convenient online shipping, discounted pricing, and free shipping supplies. The strategic question isn’t whether Click-N-Ship works, it’s whether the time spent on manual workflows costs more than free alternatives like Pirate Ship or paid platforms like ShipStation that deliver the same discounts with far greater efficiency.
This matters because shipping costs typically consume 8-15% of ecommerce revenue, and the gap between retail and commercial USPS rates ranges from 15-40% depending on service and package size. A seller shipping 200 packages monthly at retail rates instead of commercial rates loses roughly $400-800/month in unnecessary postage, before accounting for the labor cost of manual data entry. The tools you choose shape your margins, customers’ satisfaction, customer experience, and operational scalability, including strategies for making free shipping profitable.
What Click-N-Ship actually does and how it evolved
USPS Click-N-Ship allows anyone to create prepaid shipping labels from home with a free USPS.com account, avoiding post office lines entirely. Users must create a free USPS.com account to start using Click-N-Ship. Users enter package details, select services, purchase shipping labels and additional services such as insurance or signature confirmation, pay online, and print the shipping label on standard paper or thermal printers. The service has existed since before 2004, when the Postal Service marketed it as “bringing the Post Office to your desktop.”
The platform underwent its most significant transformation on July 14, 2024, when USPS launched Enhanced Click-N-Ship (CNSv2). This upgrade added commercial pricing for all users (previously restricted to business accounts) along with batch label creation, file upload capabilities, expanded payment options including Apple Pay and Click-to-Pay, and the ability to manage up to 1,000 addresses in an online address book. In February 2025, USPS discontinued the legacy version entirely, migrating all users to the enhanced platform.
These improvements matter, but context is essential: Click-N-Ship generated 32 million labels and nearly $385 million in sales in 2024, demonstrating its scale while highlighting that the average label value was approximately $12, consistent with occasional shippers sending Priority Mail packages rather than high-volume ecommerce operations.
The step-by-step workflow for creating labels
Creating a Click-N-Ship label involves entering your return address, recipient address (with USPS validation), package dimensions and weight, then selecting from available services. The system displays pricing, allows adding extras like insurance or signature confirmation, and processes payment through one of seven accepted methods: credit/debit cards, PayPal, Apple Pay, Click-to-Pay, or USPS Enterprise Payment System for businesses. You can print shipping labels until 11:59 PM CST of the designated shipping date, ensuring you are ready to ship on your preferred schedule. Users are only charged when they complete the purchase or print the label.
Labels generate as 8.5” x 11” PDFs that can be trimmed and taped to packages, or sellers can convert them for 4×6 thermal printing. For those without printers, USPS offers Label Broker (free in-store printing with a QR code) and Label Delivery Service (a $1.65 fee to receive a printed label by mail). After affixing the label, customers can ship a package by dropping it in a USPS collection box or bringing it to a post office for drop off. USPS Click-N-Ship includes delivery confirmation numbers to track the date and time of delivery.
Free package pickup scheduling through USPS.com allows you to schedule pickups up to three months ahead, with carriers collecting parcels during normal mail delivery, a genuine advantage for home-based sellers. If you’re looking to understand more about processes like pick and pack fulfillment, which are essential for efficient shipping operations, you can find more information online. Once you are ready with your labeled package, you can easily drop it off or schedule a pickup for added convenience.
The Enhanced version added a Label Manager for organizing unpurchased labels with bulk editing, a 12-month Shipping History for reprinting and tracking, and a “Ship Again” feature for repeat shipments. These improvements bring Click-N-Ship closer to third-party software functionality, though meaningful gaps remain.
Let AI Optimize Your Shipping and Boost Profits
Cahoot.ai software selects the best shipping option for every order—saving you time and money automatically. No Human Required.
See AI in ActionAvailable services span domestic and international shipping
Click-N-Ship supports Priority Mail Express (1-3 day delivery with money-back guarantee), Priority Mail (2-3 business days with flat rate options), USPS Ground Advantage (2-5 business days), and Parcel Select for larger packages. International options include Priority Mail Express International, Priority Mail International, and First-Class Package International Service to approximately 180 countries.
When preparing your shipment, you can easily create and print a shipping label through USPS Click-N-Ship. Self-adhesive shipping labels are compatible with Click-N-Ship and can be printed easily at home or at the post office. Shipping labels for USPS Click-N-Ship can be printed on standard 8.5″ x 11″ sheets, with two labels per sheet. The adhesive on self-adhesive shipping labels is strong and designed not to fall off in transit, reducing the risk of lost or delayed items. Using self-adhesive labels can also save time and money compared to using regular paper and tape. Properly affixed and clearly addressed shipping labels are essential, as items with unclear addresses or poorly attached labels are often lost or delayed in the mailing process. For written communication or addressing packages, including a clear letter with the correct recipient information helps ensure proper identification and tracking.
Extra services available through Click-N-Ship include insurance up to $5,000 (Priority Mail and Ground Advantage include $100 free coverage), Signature Confirmation, Adult Signature Required, USPS Tracking Plus (10-year tracking history), and delivery instructions. These cover most standard ecommerce shipping needs adequately.
However, several services remain unavailable. Media Mail (critical for book sellers) cannot be purchased through Click-N-Ship and requires post office visits or third-party platforms like Pirate Ship. Certified Mail, Registered Mail, Library Mail, and Bound Printed Matter also require alternative purchasing methods. Notably, Global Express Guaranteed (GXG) was removed from Click-N-Ship in July 2024, forcing international premium shippers to use stamps or permit imprints at the post office.
How Click-N-Ship compares with shipping software for ecommerce sellers
The fundamental distinction between Click-N-Ship and third-party shipping platforms isn’t pricing (Enhanced Click-N-Ship now offers commercial rates comparable to most alternatives). The differences lie in integration, automation, multi-carrier support, and scalability.
Click-N-Ship is perfect for individual sellers, small eBay shops, or Etsy stores who need a straightforward way to print USPS labels without complex integrations. However, it has no native integration with Shopify, WooCommerce, Amazon, eBay, or Etsy. Every order requires manual address entry or file upload. Shipping software platforms connect directly to stores, automatically importing orders, populating shipping details, syncing tracking numbers back to marketplaces, and triggering customer notifications. ShipStation alone offers 300+ integrations spanning ecommerce platforms, marketplaces, ERPs, and accounting systems.
Batch processing illustrates the efficiency gap. Click-N-Ship now supports multi-label creation and file uploads, but the system maxes at 10 domestic labels per credit card transaction and lacks sophisticated bulk editing. ShipStation processes 500 labels simultaneously with automated carrier selection, weight assignment based on SKU, and rules-based service selection. Pirate Ship offers unlimited batch shipping with spreadsheet imports. Cahoot offers multi-carrier shipping software with fully automatic label generation and lowest cost labels for all your orders.
Automation rules represent perhaps the starkest contrast. ShipStation users create if-this-then-that logic: orders over 5 pounds automatically assign to UPS Ground, products containing “fragile” SKUs automatically add insurance, international shipments auto-generate customs documentation. Click-N-Ship offers none of this. Every decision requires human input.
Multi-carrier access matters because USPS isn’t always optimal. For packages over 10 pounds, UPS Ground frequently beats USPS pricing, particularly for longer zones. FedEx may offer better regional coverage or faster options for specific destinations. Click-N-Ship is USPS-only by design. Platforms like ShipStation compare rates across 100+ carriers in real-time, while Pirate Ship offers USPS and UPS comparison. Rate shopping at checkout ensures sellers never overpay on individual shipments.
The pricing reality has changed significantly
The 2024 Enhanced Click-N-Ship update shifted the pricing equation substantially. Users now receive commercial rates automatically, the same tier previously requiring approved postage vendors. For Priority Mail, this means approximately 18-24% off retail rates. Ground Advantage savings range from 15-33% depending on weight and zone.
However, Pirate Ship and select platforms access an even deeper discount tier: USPS Connect eCommerce, introduced in 2022. This tier sits below standard commercial pricing and delivers additional savings of 5-15% on Ground Advantage and Priority Mail. Pirate Ship passes these rates through with zero markup and no monthly fees, making it objectively cheaper than Click-N-Ship for the same services.
Concrete price comparisons illustrate the stakes. A Priority Mail Small Flat Rate Box costs approximately $10.40 retail at the post office, $8.50 with commercial pricing through Click-N-Ship, and potentially lower through Connect eCommerce via Pirate Ship. For Ground Advantage packages under 1 pound, savings range from $2.14-$5.52 compared to retail. Priority Mail Cubic (available only through commercial accounts, not at post office counters) offers up to 40% savings on small, heavy packages, a service Click-N-Ship supports but many sellers don’t realize exists.
For frequent shippers or small businesses printing a lot of shipping labels, these savings add up quickly. Buying and printing labels in a lot not only streamlines the process but also maximizes cost efficiency, especially when handling bulk shipments.
Platform costs vary considerably. Click-N-Ship and Pirate Ship charge $0 monthly with $0 per-label fees. Shippo’s starter tier charges $0.05 per label. ShipStation ranges from $9.99/month (50 shipments) to $399.99/month (unlimited), with per-shipment costs dropping to approximately $0.08 at higher tiers.
The hidden cost equation goes beyond postage rates
Manual workflow costs matter more than subscription fees for growing sellers. Professional data entry benchmarks suggest 2-5 minutes per label for manual Click-N-Ship entry including address typing, rate checking, and printing. Shipping software with auto-imported orders reduces this to 15-30 seconds per label, a 15x efficiency gain by ShipStation’s measurement.
At 100 packages monthly, manual entry consumes approximately 5-8 hours of labor. At minimum wage equivalent of $15/hour, that’s $75-120 in time cost alone, before accounting for the cognitive load of context-switching between order management systems and USPS. Paid platforms eliminate this friction while delivering equal or better rates.
Human error compounds the cost. Manual data entry carries a 1-4% error rate industry-wide. At 1,000 annual shipments, even 1% errors means 10 misrouted packages requiring reshipping, customer service time, and potential refunds. Industry estimates place correction costs at $50-150 per error, translating to $500-1,500 in annual error costs for a modest-volume seller making the common mistake of manual entry at scale. If errors or shipping issues occur, USPS staff can assist by helping resolve claims, tracking lost packages, and providing guidance to ensure problems are addressed quickly.
If a package is misdelivered, contact the local Postmaster as soon as possible to verify delivery details and initiate a search. If the package cannot be located and is insured, a claim can be filed. However, if a package is delivered to the correct address but is missing, it is likely stolen and an insurance claim may not be honored. Some Postmasters will assist in approving claims, but their approval may be overturned by upper management.
ShipStation vs. Cahoot: 21x Faster, Real Results
Get the inside scoop on how a leading merchant switched from ShipStation to Cahoot—and what happened next. See it to believe it!
See the 21x DifferenceWhen Click-N-Ship genuinely makes sense for sellers
Click-N-Ship remains appropriate for specific profiles. Sellers shipping 1-10 packages weekly (under 50 monthly) without ecommerce platform integration needs find reasonable value in the tool’s zero-cost simplicity. The free package pickup scheduling provides genuine convenience for home-based businesses avoiding post office trips, while those who prefer can easily drop off packages at their local post office for added flexibility. Sellers already using USPS exclusively with predictable Priority Mail shipments face minimal friction.
International shipping for occasional sellers represents another valid use case. Click-N-Ship handles customs documentation reasonably well for Priority Mail International to 180 countries, and small-volume international shippers may not need the sophisticated landed-cost calculators that platforms like Easyship provide.
The “Ship Again” feature creates value for repeat shipments. Sellers regularly sending to the same addresses can replicate past labels quickly. The 12-month shipping history with reprint and refund request capabilities provides adequate record-keeping for low-volume operations.
One-off scenarios outside normal ecommerce operations also fit Click-N-Ship well: sending samples to influencers, shipping returns to suppliers, or handling ad-hoc B2B shipments that don’t flow through standard order management.
Where Click-N-Ship breaks down for growing brands
Several volume thresholds trigger the case for migration. At 50+ packages monthly, the manual entry time cost begins exceeding any conceivable software subscription fee. At 200+ monthly, sellers without automation are losing meaningful competitive ground on fulfillment speed and customer experience. At 500+ monthly, operating without shipping software represents clear operational negligence.
Integration limitations create hard constraints. Sellers on Shopify, WooCommerce, or marketplaces cannot sync orders automatically, requiring copy-paste workflows or file exports that introduce delay and error risk. Tracking numbers must be manually entered back into selling platforms, creating customer service gaps when buyers check order status. Multi-channel sellers face exponentially worse friction managing orders across platforms without unified shipping software.
Rate comparison absence means sellers lack visibility into whether USPS actually represents the best option for each shipment. For packages over 10 pounds or traveling across multiple zones, UPS Ground frequently undercuts USPS pricing, but Click-N-Ship users have no way to know without separately checking carrier websites.
Service gaps matter for specific verticals. Book sellers needing Media Mail cannot use Click-N-Ship at all. Sellers requiring proof of mailing through Certified Mail must visit post offices. The removal of Global Express Guaranteed eliminated the fastest international option for time-sensitive cross-border shipments.
The batch processing ceiling of 10 labels per transaction creates bottlenecks during peak periods. Black Friday sellers manually creating hundreds of labels face hours of repetitive work that software handles in minutes.
When it comes to lost or misdelivered packages, resolving the issue can be unpredictable—sometimes, finding a resolution depends on luck. Even with customer service efforts, the outcome may not always be certain.
Cut Costs with the Smartest Shipping On the Market
Guranteed Savings on EVERY shipment with Cahoot's AI-powered rate shopping and humanless label generation. Even for your complex orders.
Cut Costs TodayA decision framework for choosing shipping tools
The decision matrix hinges on three variables: monthly volume, platform complexity, and carrier diversification needs.
For sellers shipping under 50 packages monthly with single-platform operations using USPS exclusively, Click-N-Ship or Pirate Ship (free, same commercial rates) both work, though Pirate Ship’s Connect eCommerce pricing makes it marginally cheaper while adding basic Shopify/Etsy integration.
At 50-200 packages monthly, free platforms with integrations become essential. Pirate Ship, Shippo’s free tier, or ShippingEasy’s free option for under 50 orders monthly provide commercial rates plus order sync without subscription costs. Shopify’s built-in shipping also warrants consideration here, offering up to 88% carrier discounts within the platform sellers already use.
Crossing 200 packages monthly generally justifies paid software. ShipStation Starter at $29.99/month for 500 shipments costs approximately $0.06 per package, a fraction of the time savings from automation. The ROI becomes obvious: if automation saves 1 minute per label, 200 labels monthly saves 3+ hours, worth far more than $30 at any reasonable labor cost.
At 500+ monthly volume, advanced features like inventory management, multi-warehouse support, branded tracking pages, and API access drive software selection beyond basic shipping needs. ShipStation, Shippo Pro, or direct negotiations with carriers become appropriate.
Frequently Asked Questions
What is USPS Click-N-Ship and how does it work?
USPS Click-N-Ship is a free online tool that allows anyone with a USPS.com account to create prepaid shipping labels from home without visiting the post office. You enter your return address, recipient address, package dimensions and weight, select a service (Priority Mail, Ground Advantage, etc.), and purchase your shipping label online. During the purchase process, you can also buy additional services such as insurance and signature confirmation. All labels created with Click-N-Ship include delivery confirmation numbers for tracking. The Enhanced version launched in July 2024 added commercial pricing for all users (18-24% off retail rates), batch label creation, and 12-month shipping history. Labels print as 8.5” x 11” PDFs or can be converted for 4×6 thermal printing.
What USPS services are available through Click-N-Ship?
Click-N-Ship supports Priority Mail Express (1-3 day), Priority Mail (2-3 day), USPS Ground Advantage (2-5 day), and international services to 180 countries including Priority Mail International and First-Class Package International. Extra services include insurance up to $5,000, Signature Confirmation, and delivery instructions. However, Media Mail, Certified Mail, Registered Mail, Library Mail, and Bound Printed Matter are NOT available through Click-N-Ship and require post office visits or third-party platforms like Pirate Ship.
How does Click-N-Ship compare to shipping software like Pirate Ship or ShipStation?
The fundamental distinction between Click-N-Ship and third-party shipping platforms isn’t pricing (Enhanced Click-N-Ship now offers commercial rates comparable to most alternatives). The differences lie in integration, automation, multi-carrier support, and scalability.
Click-N-Ship is perfect for individual sellers, small eBay shops, or Etsy stores who need a straightforward way to print USPS labels without complex integrations. However, it has no native integration with Shopify, WooCommerce, Amazon, eBay, or Etsy. Every order requires manual address entry or file upload. Shipping software platforms connect directly to stores, automatically importing orders, populating shipping details, syncing tracking numbers back to marketplaces, and triggering customer notifications. ShipStation alone offers 300+ integrations spanning ecommerce platforms, marketplaces, ERPs, and accounting systems.
Batch processing illustrates the efficiency gap. Click-N-Ship now supports multi-label creation and file uploads, but the system maxes at 10 domestic labels per credit card transaction and lacks sophisticated bulk editing. ShipStation processes 500 labels simultaneously with automated carrier selection, weight assignment based on SKU, and rules-based service selection. Pirate Ship offers unlimited batch shipping with spreadsheet imports. Cahoot offers multi-carrier shipping software with fully automatic label generation and lowest cost labels for all your orders.
Automation rules represent perhaps the starkest contrast. ShipStation users create if-this-then-that logic: orders over 5 pounds automatically assign to UPS Ground, products containing “fragile” SKUs automatically add insurance, international shipments auto-generate customs documentation. Click-N-Ship offers none of this. Every decision requires human input.
Multi-carrier access matters because USPS isn’t always optimal. For packages over 10 pounds, UPS Ground frequently beats USPS pricing, particularly for longer zones. FedEx may offer better regional coverage or faster options for specific destinations. Click-N-Ship is USPS-only by design. Platforms like ShipStation compare rates across 100+ carriers in real-time, while Pirate Ship offers USPS and UPS comparison. Rate shopping at checkout ensures sellers never overpay on individual shipments.
At what volume should I upgrade from Click-N-Ship to shipping software?
The migration threshold is 50 packages monthly. Below 50 monthly, Click-N-Ship or free alternatives like Pirate Ship work adequately. At 50-200 monthly, free platforms with integrations (Pirate Ship, Shippo free tier, Shopify Shipping) become essential to avoid manual entry costs that exceed any subscription fee. Manual entry takes 2-5 minutes per label versus 15-30 seconds with automation. At 100 packages monthly, manual workflows consume 5-8 hours of labor costing $75-120, making free integrated alternatives obvious. At 200+ monthly, paid platforms like ShipStation ($29.99+/month) deliver automation ROI that far exceeds subscription costs.
Does Click-N-Ship offer commercial pricing or just retail rates?
As of the July 2024 Enhanced Click-N-Ship upgrade, all users receive commercial pricing automatically (the same tier previously requiring approved postage vendors). This provides approximately 18-24% off retail Priority Mail rates and 15-33% off Ground Advantage depending on weight and zone. However, platforms like Pirate Ship access an even deeper USPS Connect eCommerce tier that saves an additional 5-15% on the same services. A Priority Mail Small Flat Rate Box costs approximately $10.40 retail, $8.50 commercial through Click-N-Ship, and potentially lower through Connect eCommerce via Pirate Ship.
What are the main limitations of Click-N-Ship for ecommerce sellers?
Click-N-Ship’s critical limitations include zero ecommerce platform integration (no Shopify, WooCommerce, Amazon, eBay, or Etsy sync), USPS-only service (no UPS or FedEx rate comparison for packages where other carriers would be cheaper), 10-label batch processing maximum (versus 500+ in ShipStation), no automation rules (every decision requires manual input), unavailable services like Media Mail for book sellers, and 1-4% manual data entry error rates creating $50-150 correction costs per mistake. At 200+ monthly packages, these limitations compound into thousands in unnecessary labor and postage costs annually.
Written By:
Indy Pereira
Indy Pereira helps ecommerce brands optimize their shipping and fulfillment with Cahoot’s technology. With a background in both sales and people operations, she bridges customer needs with strategic solutions that drive growth. Indy works closely with merchants every day and brings real-world insight into what makes logistics efficient and scalable.
Turn Returns Into New Revenue
Related Articles
Seller Fulfilled Prime Works — But Only With the Right Operating Model
Seller Fulfilled Prime is attractive for very rational reasons.
SLA Meaning in Logistics: What Service Level Agreements Actually Guarantee (and What They Don’t)
The gap between what 3PL providers promise in SLA marketing (“99.
HTS Code Explained: What It Is, Why It Matters, and How Ecommerce Brands Use It
HTS codes (Harmonized Tariff Schedule codes) are standardized numerical classifications that identify imported products for U.
USPS Tracking Explained: What Each Status Means and How Sellers Should Respond
In this article
17 minutes
- Introduction to Flat Rate Shipping
- How USPS Flat Rate pricing actually works
- USPS Flat Rate Envelopes
- Commercial pricing unlocks significant savings
- When Flat Rate boxes save money: the density advantage
- Large Box Shipping with Flat Rate
- Five scenarios where Flat Rate costs more than alternatives
- Top Loading Flat Rate Boxes
- The practical decision framework for every shipment
- Shopify integration and operational setup
- Inventory management and packaging strategy
- Common Flat Rate mistakes that erode ecommerce margins
- Frequently Asked Questions
The “if it fits, it ships” model offers compelling economics for heavy items traveling cross-country, but costs Shopify brands up to 175% more than alternatives for lightweight, short-distance shipments. Understanding when Flat Rate pricing actually saves money versus when it drains margins requires analyzing weight thresholds, zone distances, and increasingly competitive alternatives like Priority Mail Cubic. For mid-market ecommerce brands shipping 500+ orders monthly, this decision framework can save $2-8 per package, translating to thousands in annual savings.
Introduction to Flat Rate Shipping
Flat rate shipping is a game-changer for businesses and individuals looking to simplify their shipping process and control costs. With USPS Priority Mail Flat Rate, you pay one flat rate to send packages anywhere in the United States, regardless of the package’s weight (up to 70 lbs) or the distance it needs to travel. This means you don’t have to spend time weighing packages or calculating shipping costs based on zones—just choose the right flat rate box or envelope, pack your items, and you’re ready to ship.
For businesses, this predictability is invaluable. Priority Mail Flat Rate shipping includes fast delivery, tracking, and built-in insurance, making it a cost effective solution for sending packages with peace of mind. Whether you’re shipping across town or across the country, the price stays the same, helping you manage your shipping budget and avoid unexpected costs. USPS Priority Mail Flat Rate is especially attractive for those who want to send packages quickly and reliably, with the added benefit of simplified pricing and easy access to USPS services.
How USPS Flat Rate pricing actually works
USPS Priority Mail Flat Rate charges a single fixed price regardless of weight (up to 70 lbs) or destination zone within the United States. The price depends solely on the packaging type, not distance, not weight. A 2-pound package from New York to New Jersey costs the same as a 50-pound package from Miami to Alaska. USPS Flat Rate pricing allows you to ship packages to any domestic address at a fixed price, regardless of weight (up to 70 lbs) or distance. The expected delivery time for USPS Flat Rate shipping is typically 1-3 business days, and both USPS Flat Rate and standard Priority Mail are delivered in 1-3 business days. USPS Flat Rate boxes offer delivery within 1-3 days and include free tracking.
This zone-independence creates the core value proposition: Flat Rate eliminates the distance penalty that typically makes cross-country shipping prohibitively expensive. Standard Priority Mail calculates cost using weight plus zone (distance), with Zone 8 shipments costing 40-60% more than local Zone 1-2 deliveries. Flat Rate bypasses this calculation entirely. Flat Rate pricing uses one price—the same price—regardless of weight or distance, so you do not need to weigh packages or calculate postage based on weight and distance. USPS Flat Rate shipping is a cost-effective pricing model within Priority Mail, emphasizing the fixed rate structure, the availability of free flat rate boxes, and its suitability for heavy shipments over long distances.
The available Flat Rate options include Flat Rate Envelope (12.5” × 9.5”), Legal Flat Rate Envelope (15” × 9.5”), Padded Flat Rate Envelope (12.5” × 9.5”), Small Flat Rate Box (8-11/16” × 5-7/16” × 1-3/4”), Medium Flat Rate Box in two configurations (top-loading at 11.25” × 8.75” × 6” and side-loading at 14-1/8” × 12” × 3-1/2”), and Large Flat Rate Box (12.25” × 12” × 6”). Note the use of ’12 x’ and ‘x 12’ in box dimensions, such as 14-1/8” × 12” × 3-1/2” and 12.25” × 12” × 6”. All boxes support up to 70 lbs maximum weight. USPS Flat Rate packaging includes standardized boxes and envelopes—referred to as rate boxes and envelopes—that let you ship at one flat rate, simplifying the shipping process. These boxes and envelopes are free and can be ordered online or picked up at most Post Office locations. You can order USPS Flat Rate boxes online from the USPS store or pick them up at any post office location. USPS Flat Rate boxes and envelopes are free and can be picked up at most Post Office locations or ordered online from the USPS store.
Pricing as of 2026 shows significant differences between retail and commercial rates. Flat Rate Envelopes cost $11.95 retail versus $10.30 commercial. Small Flat Rate Boxes cost $12.65 retail versus $11.20 commercial. Medium Flat Rate Boxes cost $22.95 retail versus $19.60 commercial. Large Flat Rate Boxes cost $31.50 retail versus $28.70 commercial. These commercial discounts of 10-15% compound rapidly at scale.
Flat Rate Envelopes are a simple mailing option for documents and small items, but they must not be used with other USPS services such as Media Mail. Priority Mail Express is an expedited shipping service with overnight to 2-day delivery, and it also offers flat rate envelope options.
Critical note: To use USPS Flat Rate pricing, you must use designated Flat Rate packaging; using non-designated packaging, such as your own box, can result in returned parcels or billing corrections. USPS provides these boxes free through usps.com or local Post Office locations.
Let AI Optimize Your Shipping and Boost Profits
Cahoot.ai software selects the best shipping option for every order—saving you time and money automatically. No Human Required.
See AI in ActionUSPS Flat Rate Envelopes
USPS Flat Rate Envelopes offer a simple, cost effective way to send documents, letters, and small items without worrying about weight or distance. With several envelope options—including the classic Flat Rate Envelope, the Legal Flat Rate Envelope for larger documents, and the Padded Flat Rate Envelope for added protection—customers can choose the best fit for their needs. Each envelope ships for one flat rate, making it easy to budget for shipping costs and avoid surprises at checkout.
These flat rate envelopes are perfect for sending important paperwork, contracts, or small products, and they’re available for purchase both online and at your local post office. The legal flat rate envelope is ideal for oversized documents, while the padded flat rate envelope provides extra cushioning for fragile or delicate items. No matter which option you choose, you’ll benefit from USPS’s reliable service, including tracking and fast delivery, all for a single price regardless of weight or destination. This makes USPS Flat Rate Envelopes a favorite among customers who value convenience, affordability, and peace of mind when shipping.
Commercial pricing unlocks significant savings
Ecommerce sellers should never pay retail rates. Commercial pricing typically saves 10-15% versus retail, with platforms like Pirate Ship offering “Connect eCommerce” rates that push savings even deeper, up to 26% below retail on Flat Rate products.
Access commercial rates through any of these methods: Shopify Shipping provides Commercial Base pricing automatically through Settings, Shipping and Delivery, Carrier accounts. Third-party platforms like Pirate Ship (free, no monthly fees), ShipStation ($9.99-229.99/month), or Shippo (free tier available) offer comparable or better rates with additional automation features.
For the Medium Flat Rate Box, commercial pricing drops the $22.95 retail price to $19.60, saving $3.35 per package. At 500 packages monthly, that’s $1,675 in monthly savings from a single rate optimization.
When Flat Rate boxes save money: the density advantage
Flat Rate excels when shipping heavy items in compact packages traveling long distances. The math becomes compelling for high-density products like auto parts, tools, books, or hardware where actual weight would trigger steep zone-based charges.
Small Flat Rate Box break-even analysis ($11.20 commercial) shows that packages under 2 lbs benefit only for Zones 5-9, while packages over 2 lbs beat standard Priority Mail to all zones. The sweet spot occurs at 3-5 lb items where standard Priority Mail would cost $15-25+ to distant zones.
Medium Flat Rate Box break-even analysis ($19.60 commercial) reveals that 2-3 lb packages benefit only for Zones 7-9, 5-6 lb packages benefit for Zones 5-9, and packages over 11 lbs beat standard Priority Mail to all zones.
Large Flat Rate Box break-even analysis ($28.70 commercial) demonstrates that 5-7 lb packages benefit only for Zones 6-9, 10-13 lb packages benefit for Zones 4-9, and packages over 18 lbs beat standard Priority Mail to all zones.
Concrete example: A 20 lb package from New York to California (Zone 8) costs approximately $63 via commercial Priority Mail weight-based pricing, versus $28.70 via Large Flat Rate, delivering a $34+ savings per package.
Large Box Shipping with Flat Rate
When you need to send large or heavy packages, USPS Priority Mail Flat Rate’s large flat rate box is a smart, cost effective solution. With the ability to ship up to 70 lbs for one flat rate, businesses and individuals can send packages across any distance in the U.S. without worrying about escalating shipping costs. The large flat rate box is perfect for shipping bulky items like electronics, office supplies, or multiple gifts, and it’s especially valuable for businesses looking to save on shipping heavy products.
You can easily order large flat rate boxes online or pick them up at your local post office, making it convenient to keep your shipping operation running smoothly. For customers and businesses alike, the large flat rate box offers predictable pricing, fast Priority Mail delivery, and included tracking and insurance. This means you can send packages with confidence, knowing you’re getting the best value for your shipping dollar—especially when sending heavy or oversized items long distances.
ShipStation vs. Cahoot: 21x Faster, Real Results
Get the inside scoop on how a leading merchant switched from ShipStation to Cahoot—and what happened next. See it to believe it!
See the 21x DifferenceFive scenarios where Flat Rate costs more than alternatives
Lightweight items to nearby zones destroy margins. A 2 lb package to Zone 1-2 costs approximately $9.85 via standard Priority Mail but $19.60 in a Medium Flat Rate Box, nearly double the price. For packages under 3 lbs traveling to Zones 1-4, standard weight-based Priority Mail almost always wins.
Priority Mail Cubic beats Medium and Large Flat Rate by 20-50% for small, heavy packages. This underutilized service calculates cost based on package dimensions (not weight) for packages under 20 lbs that fit within 0.5 cubic feet. A 10 lb item in a 6″ × 6″ × 6″ box (0.125 cubic feet) to Zone 6 costs approximately $10.98 via Cubic versus $19.60 in a Medium Flat Rate, a 44% savings.
USPS Ground Advantage dominates for non-urgent lightweight shipments. For packages under 3 lbs where 2-5 day delivery (versus Priority’s 2-3 days) is acceptable, Ground Advantage rates start around $6.80-$8.70 for 1 lb packages, significantly cheaper than the $11.20 Small Flat Rate minimum.
Items that don’t fit Flat Rate dimensions require custom boxes. If your product dimensions require padding or void fill to prevent movement in a Flat Rate box, you’re paying for wasted space. Standard Priority Mail with right-sized packaging often costs less.
Regional shipping makes zone-based rates competitive. Brands primarily serving customers within 600 miles (Zones 1-4) rarely benefit from Flat Rate’s zone-independence since local weight-based rates are already reasonable.
Top Loading Flat Rate Boxes
Top loading flat rate boxes from USPS Priority Mail Flat Rate are designed for easy packing and extra protection, making them ideal for shipping fragile or awkwardly shaped items. With a top-loading design, these boxes allow you to place items securely from above, reducing the risk of damage during transit. USPS offers several top loading flat rate boxes, including the Medium Flat Rate Box – Top Loading and the Large Flat Rate Box, both of which are available online or at your local post office.
These flat rate boxes combine the convenience of flat rate shipping with the added benefits of fast delivery, tracking, and insurance. They’re a cost effective choice for customers who want to send packages safely and efficiently, without worrying about weight or distance. Whether you’re shipping electronics, glassware, or other delicate items, top loading flat rate boxes provide the protection and peace of mind you need, all for one flat rate. With USPS Priority Mail, you can send packages confidently, knowing your items will arrive quickly and securely.
The practical decision framework for every shipment
Calculate whether to use Flat Rate or alternatives using this sequential logic.
Step 1: Check weight and dimensions. If package weighs under 20 lbs AND fits within 0.5 cubic feet (864 cubic inches), Priority Mail Cubic is likely cheapest. Calculate cubic feet: (L × W × H) ÷ 1,728.
Step 2: Determine destination zone. Use USPS zone calculator with origin and destination ZIP codes. Zones 1-4 favor weight-based pricing; Zones 5-9 favor Flat Rate for heavier items.
Step 3: Apply weight thresholds. For Zones 5-9: Small Flat Rate wins over 2 lbs; Medium Flat Rate wins over 6-8 lbs; Large Flat Rate wins over 10-13 lbs. For all zones: add approximately 5 lbs to each threshold.
Step 4: Consider delivery speed requirements. If customers can accept 2-5 day delivery instead of Priority’s 2-3 days, compare Ground Advantage rates, especially for items under 5 lbs.
Step 5: Use rate shopping tools. Pirate Ship’s free calculator shows Commercial and Cubic rates side-by-side. Shippo’s cubic tier calculator helps determine exact pricing. Never rely on intuition for shipments over $15.
Shopify integration and operational setup
Configure USPS Flat Rate packaging in Shopify through Settings, Shipping and Delivery, Packages, Add package, Carrier packaging, then select USPS options. Shopify offers 16 different Flat Rate packaging types that integrate with calculated shipping rates.
For commercial pricing access, Shopify Shipping provides automatic discounts up to 88% off USPS retail. Connect your USPS account through Settings, Shipping and Delivery, Carrier accounts. If you’re looking to enhance your operations even further, consider ecommerce order fulfillment services to enable fast, affordable shipping and offer free shipping to your Shopify customers. Advanced Shopify and Shopify Plus plans enable real-time carrier-calculated rates at checkout.
Recommended tech stack by volume: For 100-500 orders/month, use Pirate Ship (free) for label printing plus basic Shopify Shipping for checkout rates. For 500-2,000 orders/month, use ShipStation ($59-159/month) for automation rules, bulk printing, and multi-channel management. For 2,000+ orders/month, consider enterprise ShipStation, direct carrier negotiations, or 3PL partnerships.
Cut Costs with the Smartest Shipping On the Market
Guranteed Savings on EVERY shipment with Cahoot's AI-powered rate shopping and humanless label generation. Even for your complex orders.
Cut Costs TodayInventory management and packaging strategy
Stock these USPS supplies for optimal rate flexibility: Flat Rate Envelopes (all types), Small Flat Rate Boxes, plus non-Flat Rate Priority Mail boxes for Cubic pricing. The Priority Mail Shoe Box (7.5″ × 5.125″ × 14.375″) and Box 1095 (15.25″ × 12.375″ × 3″) work well for Cubic tiers without committing to Flat Rate pricing.
Order free supplies at store.usps.com. Boxes ship free via Ground Advantage in 2-5 business days. For faster delivery, pay for Priority Mail shipping on supply orders. Local Post Offices can fulfill orders of 1-5 boxes within 1-2 business days.
Avoid overstocking Medium and Large Flat Rate boxes. These are the most frequently misused options. Many brands default to these boxes when Cubic or weight-based alternatives would save $5-17 per shipment.
Common Flat Rate mistakes that erode ecommerce margins
Using Flat Rate for all Priority shipments represents a critical error. Medium and Large Flat Rate boxes cost up to 175% more than Priority Mail Cubic for many shipments. A 6″ × 6″ × 6″ package (0.125 cubic feet) weighing 8 lbs to Zone 6 costs $10.98 via Cubic versus $19.60 in Medium Flat Rate, an $8.62 penalty per package.
Inaccurate product weights in Shopify prevent rate calculators from optimizing shipping method selection. Verify “This is a physical product” is checked and weights are entered for every SKU.
Ignoring dimensional weight for non-Flat Rate shipments creates unexpected costs. Packages exceeding 1 cubic foot (1,728 cubic inches) get charged dimensional weight (L × W × H ÷ 166) rather than actual weight. A 12″ × 12″ × 12″ box has a dimensional weight of 10.4 lbs regardless of actual contents.
Paying retail rates leaves money on the table. Every ecommerce brand should access commercial pricing to reduce shipping costs. The 10-26% savings compound rapidly. Pirate Ship offers the deepest USPS discounts with zero monthly fees.
Not auditing shipping invoices misses refund opportunities. USPS offers refunds for guaranteed delivery failures. Brands shipping 500+ packages monthly should audit bills quarterly and claim eligible refunds through carrier or platform support.
Frequently Asked Questions
What are USPS Flat Rate Boxes and how does the pricing work?
USPS Flat Rate Boxes charge a single fixed price regardless of weight (up to 70 lbs) or destination zone within the United States. The price depends solely on the packaging type you choose. A 2-pound package from New York to New Jersey costs the same as a 50-pound package from Miami to Alaska using the same box type. Commercial pricing (available through Shopify Shipping or platforms like Pirate Ship) saves 10-26% versus retail rates. You must use official USPS-produced Flat Rate packaging and cannot substitute your own boxes of equivalent dimensions.
What are the available Flat Rate box sizes and their prices?
As of 2026, USPS offers several Flat Rate options: Flat Rate Envelope ($10.30 commercial), Small Flat Rate Box at 8-11/16″ × 5-7/16″ × 1-3/4″ ($11.20 commercial), Medium Flat Rate Box in two configurations at 11.25″ × 8.75″ × 6″ or 14-1/8″ × 12″ × 3-1/2″ ($19.60 commercial), and Large Flat Rate Box at 12.25″ × 12″ × 6″ ($28.70 commercial). All support up to 70 lbs maximum weight. USPS provides these boxes free through usps.com or local Post Office locations.
When do Flat Rate boxes actually save money versus standard Priority Mail?
Flat Rate boxes save money when shipping heavy items to distant zones. Small Flat Rate ($11.20) beats standard Priority Mail for packages over 2 lbs to all zones. Medium Flat Rate ($19.60) wins for packages over 11 lbs to all zones, or 5-6 lbs to Zones 5-9. Large Flat Rate ($28.70) wins for packages over 18 lbs to all zones. The sweet spot is high-density products (tools, books, auto parts) weighing 5-20+ lbs traveling to Zones 5-9 where weight-based rates would cost $25-63.
When do Flat Rate boxes cost MORE than alternatives?
Flat Rate boxes cost more for lightweight packages to nearby zones and when Priority Mail Cubic pricing applies. A 2 lb package to Zone 1-2 costs $9.85 via standard Priority Mail but $19.60 in Medium Flat Rate (double the cost). For packages under 20 lbs fitting within 0.5 cubic feet, Priority Mail Cubic often beats Flat Rate by 20-50%. For example, a 10 lb item in a 6″ × 6″ × 6″ box to Zone 6 costs $10.98 via Cubic versus $19.60 in Medium Flat Rate. Ground Advantage dominates for non-urgent shipments under 3 lbs at $6.80-$8.70.
How do I decide between Flat Rate and weight-based shipping for each order?
Use this framework: First, check if your package weighs under 20 lbs AND fits within 0.5 cubic feet (calculate: L × W × H ÷ 1,728). If yes, Priority Mail Cubic is likely cheapest. Second, determine destination zone using USPS zone calculator. Zones 1-4 favor weight-based pricing; Zones 5-9 favor Flat Rate for heavier items. Third, apply weight thresholds (Small Flat Rate wins over 2 lbs for distant zones; Medium wins over 6-8 lbs; Large wins over 10-13 lbs). Fourth, use rate shopping tools like Pirate Ship’s free calculator to compare actual costs rather than relying on intuition.
What are the most common Flat Rate mistakes ecommerce brands make?
The biggest mistake is using Medium or Large Flat Rate boxes for all Priority shipments when Cubic pricing would save 20-50%. A 6″ × 6″ × 6″ package weighing 8 lbs costs $10.98 via Cubic versus $19.60 in Medium Flat Rate, an $8.62 penalty per package. Other mistakes include paying retail rates instead of accessing 10-26% commercial discounts through Shopify Shipping or Pirate Ship, entering inaccurate product weights in Shopify preventing proper rate calculations, ignoring dimensional weight charges for packages over 1 cubic foot, and not auditing shipping invoices quarterly to claim eligible refunds for service failures.
Written By:
Indy Pereira
Indy Pereira helps ecommerce brands optimize their shipping and fulfillment with Cahoot’s technology. With a background in both sales and people operations, she bridges customer needs with strategic solutions that drive growth. Indy works closely with merchants every day and brings real-world insight into what makes logistics efficient and scalable.
Turn Returns Into New Revenue
Related Articles
Seller Fulfilled Prime Works — But Only With the Right Operating Model
Seller Fulfilled Prime is attractive for very rational reasons.
SLA Meaning in Logistics: What Service Level Agreements Actually Guarantee (and What They Don’t)
The gap between what 3PL providers promise in SLA marketing (“99.
HTS Code Explained: What It Is, Why It Matters, and How Ecommerce Brands Use It
HTS codes (Harmonized Tariff Schedule codes) are standardized numerical classifications that identify imported products for U.
USPS Tracking Explained: What Each Status Means and How Sellers Should Respond
In this article
21 minutes
- USPS tracking operates on scans, not GPS
- Package preparation and its impact on tracking accuracy
- What each tracking status actually means
- Why scans go missing and tracking stalls
- Service-level expectations and when to escalate
- The operational cost of tracking confusion
- Building a proactive communication system
- Setting expectations at checkout prevents problems
- Refund policies that balance risk and retention
- Training support teams to interpret USPS tracking
- Reducing WISMO through automation and self-service
- Frequently Asked Questions
USPS tracking messages are wrong 64% of the time, a startling finding from a 2023 USPS Office of Inspector General audit that examined 500 packages. For ecommerce brands, this tracking unreliability creates a cascade of operational challenges: confused customers flooding support queues, premature refunds eating into margins, and damaged brand trust. Understanding how USPS tracking actually works, and its limitations, is essential for any Shopify merchant shipping with the postal service.
This guide breaks down the technical realities of USPS tracking, decodes every status message, and provides actionable frameworks for reducing customer anxiety while protecting your bottom line. The stakes are real: WISMO (“where is my order”) inquiries account for 18% of all support tickets on average, and each human-handled response costs approximately $12.40.
USPS tracking operates on scans, not GPS
Many customers assume their package is being tracked in real-time like an Uber driver. It’s not. USPS tracking is a barcode scanning system that records events only when packages physically pass through scan points. Each scan represents a stage in the package’s journey, providing a snapshot of its progress from shipment to delivery. The tracking number generates estimated movements between scans, which explains why “In Transit to Next Facility” can display for days without representing actual movement.
Packages get scanned at specific checkpoints: acceptance (retail counter or carrier pickup), origin processing facility, Regional Processing and Distribution Centers (RPDCs), destination processing facility, arrival at local post office, out for delivery, and final delivery. At each facility, packages are processed, and this is recorded as a tracking status. USPS uses many package tracking status scans to inform customers about their package’s journey. Between these points, your package essentially goes dark. The system displays anticipated movement rather than confirmed location, a key detail the OIG found causes most tracking confusion. USPS tracking statuses and USPS tracking updates provide insight into the package’s journey and are updated at each scan, helping customers and businesses understand where their package is in the process.
Carriers use Mobile Delivery Devices (MDDs) with cellular connectivity to transmit scan data, but GPS is used primarily for verifying carrier location at delivery, not for tracking packages during transit. When no scans occur within 24 hours, USPS automatically generates placeholder messages like “In Transit to Next Facility” to indicate the package is presumably moving through the network.
For added convenience, USPS offers Informed Delivery, a digital service that allows users to preview incoming mail and manage packages from a single dashboard. Informed Delivery allows customers to see images of their incoming mail and track packages all in one place.
Package preparation and its impact on tracking accuracy
Proper package preparation is the foundation of reliable USPS tracking and successful delivery. Every step, from printing the shipping label to dropping off the package at your local post office, directly affects how accurately your package’s journey is recorded and updated in the USPS network.
Start by ensuring your USPS shipping label is clear, legible, and includes all required details: the recipient’s full address, your return address, accurate package weight, and the correct service selection—whether you’re using Priority Mail, Priority Mail Express, or another USPS option. Always use a valid USPS tracking number generated through the USPS website or a trusted shipping software provider. This not only enables you and your customers to track packages on the USPS tracking page or via the USPS mobile app, but also helps prevent issues like insufficient address or undeliverable mail.
Printing shipping labels directly from the USPS website or an approved platform reduces the risk of barcode errors or missing information, which are common causes of tracking stalls and delivery delays. A properly formatted label ensures your package is scanned at every key point in the USPS network, providing timely tracking updates and accurate delivery status notifications.
If a package goes missing or tracking shows no updates, you can quickly take action by submitting a Missing Mail Search request through the USPS website or by contacting your local post office for assistance. Having a correct tracking number and complete shipping label information makes it much easier for USPS to locate your package and resolve any issues.
Attention to detail at the preparation stage also minimizes the need for signature confirmation or address corrections, both of which can slow down delivery and require extra steps from the recipient. By following best practices for package preparation and leveraging USPS tools like the tracking page and mobile app, you help ensure your packages move smoothly through the system and reach their destination on time.
In short, investing a few extra minutes to verify your shipping label, tracking number, and address details pays off with fewer delivery problems, more accurate tracking updates, and a better experience for both senders and recipients. Whether you’re shipping with Priority Mail, Priority Mail Express, or any USPS service, proper preparation is the key to successful, stress-free shipping.
Let AI Optimize Your Shipping and Boost Profits
Cahoot.ai software selects the best shipping option for every order—saving you time and money automatically. No Human Required.
See AI in ActionWhat each tracking status actually means
Understanding the precise meaning behind each status helps support teams triage inquiries and set accurate customer expectations. Common USPS tracking statuses provide essential information about a USPS package’s journey, helping customers and support teams understand where the package is and what actions may be needed at each stage of the shipping process.
Pre-shipment and acceptance statuses mark the beginning of a package’s journey. “Shipping Label Created, USPS Awaiting Item” means a label exists but USPS has no physical possession (contact the shipper, not USPS). The USPS tracking number can be found on the USPS label, which is typically located on your shipping receipt, the package itself, or in your email notification. “Shipment Received, Package Acceptance Pending” indicates a pallet of packages arrived at a facility but individual scanning hasn’t begun. “USPS in Possession of Item” confirms actual acceptance and the start of processing. Crucially, packages can sit at “Label Created” for days even after physical drop-off if the seller didn’t get an acceptance scan. Always request acceptance scans to protect against INR (item not received) claims.
Transit statuses generate the most customer confusion. “In Transit” and “In Transit to Next Facility” are often placeholder messages indicating no scan has occurred in the past 24 hours. The OIG audit found 163 of 500 packages showed “Out for Delivery” when they were still sitting at the post office. The “Out for Delivery” status indicates that the package has been prepared for delivery and will be delivered that day. “Arrived at USPS Regional Facility” and “Departed USPS Regional Facility” indicate passage through the 60-65 RPDCs that form the backbone of the modernized USPS network. These scans are generally reliable but don’t reveal exactly when the package will reach its final destination.
Delivery and exception statuses require specific customer actions. “Out for Delivery” means the package is on a carrier’s vehicle, but not all deliveries happen via the regular mail carrier, so arrival times vary. The “Delivered” status means the package has been delivered with a recorded date, time, and delivery location. The delivery location is specified in the tracking details, showing where the USPS package was left. If a secure location is not available at the delivery address, USPS may not leave the package and will require alternative arrangements or a pickup at the post office. A “Delivery Attempt” status appears when the carrier tries to deliver the package but is unable to complete the delivery due to reasons such as no access, no authorized recipient, or other obstacles. In this case, customers should follow the instructions in the notice left by USPS to schedule redelivery or pick up the package at their local post office. “Notice Left (No Authorized Recipient Available)” requires a signature; importantly, USPS does not automatically reattempt delivery. Customers must schedule redelivery or pick up at the post office. “Available for Pickup” indicates a package cannot be delivered and redelivery cannot be scheduled; the customer must visit their local post office. USPS holds packages for 15 days before returning them to sender. The “Return to Sender” status means the package is being returned to the sender for various reasons, such as an incorrect address.
To confirm delivery, customers can use USPS tracking data to verify the status, date, time, and delivery location of their USPS package. If a package shows as “Delivered” but is not found, customers are advised to wait 24 hours before contacting USPS.
Why scans go missing and tracking stalls
The 64% inaccuracy rate from the OIG audit stems from multiple causes. Unreadable barcodes (whether damaged, poorly printed, or smudged) prevent scanning entirely. One Shopify seller reported losing $14,000 in inventory when a $20 printer ribbon created unreadable barcodes on 500 orders. Carrier non-compliance contributes significantly; workload pressures during peak periods lead to skipped scans, particularly on rural routes with long distances between stops.
Packages are processed at each USPS facility, and this processing is recorded as a tracking status, such as “Processed at USPS Facility” or “Processed Through Facility.” However, USPS’s programming logic compounds the problem. The system reports anticipated package movement rather than confirmed location, meaning tracking messages describe where the package should be rather than where it actually is. Additionally, 497 of 500 packages in the OIG audit displayed at least one intentionally nondescriptive facility name (like “Arrived at USPS Facility”) for security reasons, offering customers no meaningful geographic information.
Sometimes, a shipping partner—a third-party carrier or collaborator—handles the package before USPS takes over. This can affect scan accuracy and cause missing or delayed tracking updates, as the initial scans may not be recorded in the USPS system until the package is officially received.
The difference between a delayed package and delayed tracking is critical for customer communications. During the 2024 holiday season, one mid-market brand experienced 4,200+ WISMO tickets in a single day. The common thread was tracking numbers that hadn’t updated in 48 hours, even though most packages eventually arrived. Peak season 2024 data shows USPS handled 45% more packages per day than competitors while achieving only 90.4% on-time performance, compared to UPS at 96.5%.
Service-level expectations and when to escalate
Different USPS service levels have distinct delivery windows, which should inform both customer expectations and escalation timing.
Priority Mail Express offers 1-3 day delivery with a money-back guarantee, the only USPS product with this protection. Claims must be filed within 30 days of mailing. Priority Mail targets 2-3 business days with $100 included insurance, though no guaranteed refund for delays. USPS Ground Advantage, the service many Shopify brands use, promises 2-5 business days with $100 insurance, but weekend and holiday delivery is excluded. First-Class Mail ranges from 1-5 days depending on distance, with local delivery typically under 2 days and longer distances taking 3-5 days.
For escalation timing, USPS recommends waiting 7 business days after submitting an online help request before filing a Missing Mail Search Request. However, seller experience suggests earlier intervention often accelerates resolution. A practical framework: Days 1-2 without update is normal (tell customers to wait), Days 3-4 without update requires close monitoring if past estimated delivery, Days 5-7 without update warrants filing a USPS Help Request Form, Day 7+ means submitting a Missing Mail Search Request, and 2-3 weeks post-ship triggers filing an insurance claim if applicable.
If you need to update to a new delivery address or change delivery details, you should submit a service request through USPS. Some services, such as changing your address or extending a hold, may require you to pay additional fees. If you did not make a request for a package to be held at the Post Office, you should submit a service request to your local Post Office.
For “delivered but not received” situations, USPS captures GPS coordinates for every delivery scan. The post office can look up exact coordinates (within a 6-foot radius) where the package was scanned, which can confirm misdelivery to a neighbor or wrong address.
The operational cost of tracking confusion
Tracking-related support isn’t just an annoyance, it carries quantifiable costs that compound during peak periods.
Direct support costs hit the P&L immediately. Each human-handled WISMO ticket costs approximately $12.40 to resolve, compared to $0.18-$0.40 for automated responses. With shoppers checking tracking an average of 4.6 times per order and 69% of consumers citing real-time tracking as a top purchase factor, the support queue fills fast when tracking stalls. One DTC operator moving 10,000 units weekly described holiday tracking glitches as a “systemic failure threatening brand reputation.”
Premature refund costs multiply losses. eBay sellers report being pressured to refund before filing insurance claims, only to have both original and replacement shipments eventually arrive. Ground Advantage includes only $100 insurance; Priority Mail insurance through third-party labels often covers even less. Sellers who refund after 7 days of tracking silence frequently see the original package arrive days later. Now they’ve shipped twice and collected once.
Customer lifetime value erosion represents the largest hidden cost. 44% of US consumers stopped shopping with a company after one poor customer service experience. Conversely, repeat customers generate 300% more revenue than first-time buyers. In most cases, replacing a lost $30 item retains a customer worth hundreds in future orders, making patience the more profitable strategy when tracking stalls.
ShipStation vs. Cahoot: 21x Faster, Real Results
Get the inside scoop on how a leading merchant switched from ShipStation to Cahoot—and what happened next. See it to believe it!
See the 21x DifferenceBuilding a proactive communication system
The most effective strategy for reducing tracking-related support is reaching customers before they reach you. Proactive notifications can reduce WISMO tickets by 50-90% according to platform data from Malomo and WISMOlabs.
Trigger-based communications should fire at critical moments. Send shipment notifications immediately upon label creation. If no origin scan appears after 48 hours, proactively alert the customer that their package is en route but tracking may be delayed. When “In Transit, Arriving Late” appears, message within 30 minutes explaining the situation and providing a revised estimate. Industry experts call this “the 30-minute rule”: if there’s a delay, customers should hear from you before anxiety peaks.
Customers can sign up for email or text notifications to receive updates about their package’s status. USPS tracking updates and USPS tracking statuses are available through email, text, and the USPS Mobile App. The USPS Mobile App allows users to track packages and sign up for text and email alerts. USPS provides text tracking updates, allowing customers to receive the latest tracking information by sending a text message with their tracking number. USPS offers automatic tracking updates via email, which can be set up by entering the tracking number on the USPS Tracking page. Users can receive tracking updates via text message by sending their tracking number to 28777 (2USPS).
Branded tracking pages keep customers on your domain rather than redirecting to usps.com where they encounter confusing statuses without context. These pages let you frame tracking updates with your brand voice, explain what statuses mean, and even cross-sell related products while customers obsessively check delivery progress. Given that tracking pages often see more visits than brand homepages, this real estate matters.
SMS for time-sensitive updates achieves 98% open rates compared to 20-30% for email. Reserve SMS for “out for delivery” notifications, significant delays, and delivery exceptions. Don’t overuse this channel for routine transit updates.
Setting expectations at checkout prevents problems
The best WISMO ticket is the one never created. Clear expectation-setting at checkout and in order confirmation dramatically reduces confusion.
Display estimated delivery date ranges at checkout, not just shipping method names. “USPS Ground Advantage: Arrives January 31 – February 4” beats “Ground Shipping: $4.99.” Include processing time separately: “Orders placed by 2pm ET ship same day; otherwise ship next business day” so customers understand the full timeline. Remind customers to enter every detail of their address, including any such number (like suite, apartment, or unit numbers), to ensure successful delivery. Learn more about expedited shipping options to speed up delivery.
Your shipping policy page should explicitly acknowledge USPS tracking limitations: “Tracking may not update for 24-48 hours after shipment. ‘In Transit’ status is normal and indicates your package is moving through the postal network. USPS does not guarantee delivery dates except for Priority Mail Express.” Also, note that delivery issues can occur if the package is left in or near the mailbox, especially if the mailbox is too small for the item, and that secure delivery locations are important. For customers in a gated community, inform them that USPS may require an access code or special permission to complete delivery.
Order confirmation emails should set expectations that tracking will become active “once the carrier scans your package, typically within 24-48 hours of handoff.” Link directly to your branded tracking page, not the carrier’s site, and include customer service contact information prominently.
Refund policies that balance risk and retention
Refund timing should balance customer satisfaction against the reality that most “stuck” packages eventually arrive, but some companies offer instant refunds to enhance the returns experience.
For packages showing “Label created, never shipped” with no acceptance scan after 5 business days, reship or refund (something went wrong at fulfillment). For packages “In transit, no update” after 7-10 business days, file a USPS trace and offer the customer a choice of continuing to wait, getting a replacement shipped, or receiving a refund. For “Delivered, customer says not received,” ask the customer to check with neighbors, household members, and building management, then wait 48 hours before reshipping or refunding. Packages marked delivered often appear in mailrooms or were grabbed by family members.
The FTC Mail Order Rule requires shipping within the promised time or within 30 days if no promise was made. For delays exceeding 30 days, you must get explicit customer consent to continue waiting or issue a refund. Most USPS delays resolve well before this threshold, but awareness protects against compliance issues.
Consider signature confirmation for orders over $100 to protect against friendly fraud. 32% of fraud claims use “order not received” despite delivery confirmation. For orders $250+, signature confirmation is required for USPS insurance claims regardless.
Cut Costs with the Smartest Shipping On the Market
Guranteed Savings on EVERY shipment with Cahoot's AI-powered rate shopping and humanless label generation. Even for your complex orders.
Cut Costs TodayTraining support teams to interpret USPS tracking
Support agents need specific training on USPS tracking nuances rather than generic carrier knowledge.
Normal delays requiring patience include no scans for 24-48 hours during transit, “In Transit to Next Facility” placeholder messages, single “Arriving Late” notifications during weather events, and 3-5 days of “In Transit” status for cross-country shipments. These warrant reassurance, not escalation.
Red flags requiring action include packages stuck on “Label Created” beyond 72 hours without acceptance scan (check with fulfillment), no scans for 5+ business days during transit (file USPS trace), tracking showing the package at the same facility for 5+ days (escalate), “Returned to Sender” without attempted delivery (immediate customer contact), and packages bouncing between the same facilities repeatedly (misrouting issue). If a package shows as delivered but is missing, agents should advise customers to check with neighbors and local USPS offices, and initiate a missing mail search if necessary.
When verifying shipments or investigating delivery issues, remind agents that USPS tracking numbers can be found on shipping receipts, sales receipts, or the USPS tracking label. The receipt serves as proof of shipment and is essential for tracking and resolving delivery issues.
Create an escalation decision matrix document that agents can reference. Include specific scripts for common scenarios and empower agents to make refund/reship decisions within defined thresholds rather than requiring supervisor approval for every case.
Reducing WISMO through automation and self-service
A properly configured helpdesk dramatically reduces the cost of tracking inquiries.
Self-service order lookup in your chat widget lets customers check status without creating a ticket. Gorgias’s Self-Service Portal, for example, enabled ALOHAS to handle 56% of chat tickets without human interaction. Knowledge base articles explaining “Where is my order?” with embedded order lookup tools deflect tickets before they’re created.
Automated WISMO responses using intent detection can auto-reply to “shipping/status” inquiries with personalized tracking information pulled from Shopify order data, then auto-close the ticket. This handles the majority of routine “where’s my package” questions at $0.40 or less per inquiry.
Post-purchase platforms like Malomo, AfterShip, or Wonderment (now part of Loop) provide the infrastructure for branded tracking pages, Klaviyo/Attentive integration for automated notifications, stalled shipment alerts, and carrier analytics to identify patterns. For mid-market Shopify brands, these platforms typically cost $99-200/month and deliver ROI through ticket reduction alone. Learn more about Shopify order fulfillment options to further streamline your ecommerce operations.
Frequently Asked Questions
How does USPS tracking actually work?
USPS tracking is a barcode scanning system that records events only when packages physically pass through scan points, not GPS-based real-time tracking. Packages get scanned at specific checkpoints (acceptance, processing facilities, local post office, delivery), and the system displays anticipated movement between scans rather than confirmed location. When no scans occur within 24 hours, USPS automatically generates placeholder messages like “In Transit to Next Facility.” A 2023 USPS Office of Inspector General audit found tracking messages were inaccurate 64% of the time because the system reports where packages should be, not where they actually are.
What does “In Transit to Next Facility” mean and how long is normal?
“In Transit to Next Facility” is typically a placeholder message indicating no scan has occurred in the past 24 hours. It doesn’t necessarily mean the package is actively moving. This status can display for 3-5 days on cross-country shipments without indicating a problem. The message appears because USPS’s system generates anticipated movement rather than waiting for actual scan confirmations. If this status persists for 5+ business days without any scan updates, it’s worth filing a USPS Help Request Form to investigate potential delays or misrouting.
When should I escalate a USPS tracking issue versus telling customers to wait?
Use this framework: Days 1-2 without tracking updates is normal (reassure customers), Days 3-4 without updates requires monitoring if past estimated delivery date, Days 5-7 without updates warrants filing a USPS Help Request Form, Day 7+ means submitting a Missing Mail Search Request, and 2-3 weeks post-ship triggers filing an insurance claim if applicable. For “Label Created” status with no acceptance scan after 5 business days, the issue is likely at fulfillment, not with USPS. For “Delivered but not received” situations, ask customers to check with neighbors and wait 48 hours before reshipping, as packages often appear in mailrooms or with household members.
What does “USPS Awaiting Item” mean and what should I do?
“Shipping Label Created, USPS Awaiting Item” means a shipping label exists in the system but USPS has no physical possession of the package. This is a pre-shipment status. The package may still be at the seller’s warehouse, dropped off but not yet scanned at acceptance, or the label was created but the item was never actually shipped. If this status persists for 72+ hours, contact the seller (not USPS) to verify the package was actually handed off. Sellers should always request acceptance scans when dropping packages to protect against “item not received” claims.
How much do WISMO tickets cost and how can I reduce them?
Each human-handled “where is my order” ticket costs approximately $12.40 to resolve, compared to $0.18-$0.40 for automated responses. WISMO inquiries account for 18% of all ecommerce support tickets on average. You can reduce them by 50-90% through proactive notifications (shipment confirmations, delay alerts within 30 minutes of status changes), branded tracking pages that explain status meanings in your brand voice, self-service order lookup tools in chat widgets, automated responses using intent detection that pull tracking data from Shopify, and clear expectation-setting at checkout (delivery date ranges, processing times, tracking delay warnings). Learn more about order fulfillment costs and strategies to optimize your shipping expenses.
What is USPS’s refund policy for late or lost packages?
Only Priority Mail Express offers a money-back guarantee for late delivery (claims must be filed within 30 days). Priority Mail, Ground Advantage, and First-Class Mail have no guaranteed delivery dates and no refunds for delays. For lost packages, Ground Advantage and Priority Mail include $100 insurance, but you must file a claim. For orders over $250, signature confirmation is required to file insurance claims. The FTC Mail Order Rule requires shipping within the promised time or within 30 days if no promise was made. If delays exceed 30 days, you must get customer consent to continue waiting or issue a refund.
Written By:
Indy Pereira
Indy Pereira helps ecommerce brands optimize their shipping and fulfillment with Cahoot’s technology. With a background in both sales and people operations, she bridges customer needs with strategic solutions that drive growth. Indy works closely with merchants every day and brings real-world insight into what makes logistics efficient and scalable.
Turn Returns Into New Revenue
Related Articles
Seller Fulfilled Prime Works — But Only With the Right Operating Model
Seller Fulfilled Prime is attractive for very rational reasons.
SLA Meaning in Logistics: What Service Level Agreements Actually Guarantee (and What They Don’t)
The gap between what 3PL providers promise in SLA marketing (“99.
HTS Code Explained: What It Is, Why It Matters, and How Ecommerce Brands Use It
HTS codes (Harmonized Tariff Schedule codes) are standardized numerical classifications that identify imported products for U.
The End of Traditional Ecommerce Returns

In this article
36 minutes
- PART I — THE PROBLEM
- Why Returns Didn’t Just Break — They Were Never Built for This
- PART II — WHY TODAY’S SOLUTIONS FAIL
- How Better Tools, Bigger Networks, and More Scale Preserved the Wrong System
- PART III — THE SHIFT ALREADY UNDERWAY
- Why the Old Returns Model Is Breaking Before Peer-to-Peer Even Arrives
- PART IV — PEER-TO-PEER RETURNS
- The Structural Rewrite
- PART V — LIMITATIONS, REALITY, AND CREDIBILITY
- Where Peer-to-Peer Does Not Work
- PART VI — STRATEGY & EXECUTION
- The Executive Case for Change
- PART VII — CONCLUSION
PART I — THE PROBLEM
Why Returns Didn’t Just Break — They Were Never Built for This
Returns are ecommerce’s dirty secret: a billion-dollar bonfire that most brands prefer not to look at directly.
For years, returns were framed as a customer-friendly perk — a small, acceptable cost in exchange for higher conversion rates and buyer trust. Free returns reduced friction, calmed purchase anxiety, and helped normalize buying sight unseen. In the early days of ecommerce, that tradeoff worked. Returns existed, but they were episodic. Manageable. Contained.
What changed is not that returns suddenly became a problem.
What changed is that ecommerce outgrew the system that was quietly absorbing them.
Returns didn’t just increase. They escaped the design assumptions that once kept them under control.
Returns Were Never Designed for Ecommerce at Scale
The original returns model was built for a very different version of commerce.
Early ecommerce assumed lower order volumes, fewer SKUs, and limited product complexity. Apparel was not yet dominant. Size and fit issues existed, but they were not industrialized. Purchases were made by humans, at human speed, with human hesitation. Warehouses processed returns as exceptions, not as a parallel supply chain.
In that environment, free returns made economic sense. The occasional inbound shipment could be absorbed by warehouse labor. Returned inventory could be inspected, restocked, and resold without catastrophic value loss. Reverse logistics was a nuisance, not a structural threat.
That world no longer exists.
By the mid-2020s, ecommerce had transformed into something else entirely. SKU counts exploded. Shipping networks stretched nationwide and then global. Apparel, footwear, and home goods — the categories with the highest return rates — became core growth drivers. Consumer expectations hardened around instant refunds and no-questions-asked policies. At the same time, purchasing behavior accelerated. What used to be deliberation turned into experimentation. Bracketing — buying multiple sizes or variations with the intention of returning most of them — became normalized.
Returns stopped being incidental. They became structural.
The data makes this shift impossible to ignore. In 2018, total U.S. retail returns were estimated at $396 billion. In 2019, that figure dipped to $309 billion, with $27 billion attributed to fraud and abuse. Then COVID detonated the system. In 2020, returns jumped to $428 billion, representing more than 10% of all retail sales. In 2021, they surged 78% year over year to $761 billion. By 2022, returns reached $816 billion — 16.5% of retail sales. After a brief dip in 2023, returns climbed again in 2024 to a record $890 billion.
In less than four years, returns nearly doubled — without adjusting for inflation, ecommerce penetration, or SKU growth.
This is not volatility.
It is structural escalation.
Why Free Returns Worked — Briefly
Free returns didn’t fail because they were a bad idea.
They failed because the environment underneath them changed.
COVID accelerated ecommerce adoption by years. It normalized bracketing behavior and retrained consumers to expect instant resolution. Even as shoppers returned to physical stores, online return habits stuck. By mid-2025, ecommerce stabilized at roughly 16.3% of U.S. retail — matching pandemic peaks — yet return rates remained elevated.
That contradiction matters. Ecommerce growth plateaued. Returns did not.
The industry never recalibrated free returns for this new reality. Policies designed for edge cases quietly became default behavior. What once reduced friction began quietly manufacturing loss.
The Warehouse-Centric Return Loop
At the center of the modern returns crisis sits a single, outdated assumption:
every return must go back to a warehouse.
This assumption created the canonical reverse logistics loop that still dominates today. A customer initiates a return. The item ships back to a distribution center. Warehouse staff receive it, inspect it, repackage it, and decide its fate — restock, resale, liquidation, or destruction.
Two shipping legs are unavoidable.
Labor is unavoidable.
Delay is unavoidable.
Markdown risk is unavoidable.
Most brands manage this process through Returns Management Systems. These platforms have undeniably improved the front end of returns. Customers get branded portals, faster approvals, QR codes, and cleaner communication. Operations teams gain visibility through RMAs, disposition codes, and basic analytics.
But these systems sit on top of the same warehouse-centric loop.
Inbound shipping still happens. Inspection labor still happens. Repackaging still happens. Inventory still waits. Markdown exposure still accumulates. In practice, modern returns software often accelerates volume into the most expensive part of the system.
The tools got better.
The economics did not.
Any meaningful step-change in return economics requires changing routing — not just improving policy UX.
The Hidden Economics of Returns
Returns hurt not because they exist, but because their true cost is systematically underestimated.
Most retailers track an “average cost per return.” That number is misleading. Averages flatten volatility and hide tail risk. Returns behave less like a steady expense and more like a margin-destroying outlier that compounds at scale.
Across multiple industry analyses, the cost layers stack quickly. Shipping often costs $7–$9 per leg. Warehouse labor for intake, inspection, repackaging, and restocking commonly adds $10–$15 per unit. When all operational costs are included, the average cost per return lands around $40. In many categories, returns consume 17–30% of the item’s original sale price — before markdowns, fraud, or wasted acquisition spend are considered.
Consider a $59.99 apparel item. When it sells and is kept, it might generate roughly $18 in margin. When it is returned and deemed unsellable, the loss can exceed $50. Even when it is successfully resold at a discount, the transaction often still produces a $20-plus loss once shipping, labor, and markdowns are accounted for.
And logistics is only part of the damage.
Customer acquisition costs do not reverse when an item comes back. Seasonal inventory misses its resale window. Frequent returns correlate with lower lifetime value. When CAC is included, a $100 sale can quietly turn into an $80–$90 loss.
Returns don’t nibble at margins.
They eat them alive.
Sustainability Is Not Separate From Economics
The environmental cost of returns mirrors the financial one.
Every return doubles shipping emissions. Nearly half of apparel returns never reenter inventory. Items are liquidated, incinerated, or dumped. At the same time, regulatory pressure is rising — extended producer responsibility laws, landfill restrictions, and Scope 3 emissions disclosure requirements are no longer theoretical.
Economic loss and environmental cost are two sides of the same coin. The same inefficiencies that destroy margin also generate waste.
Fraud Thrives Where Systems Are Opaque
Return fraud is often framed as a customer behavior problem. In reality, it is a systems problem.
Between 2019 and 2023, return fraud ballooned from roughly $27 billion to more than $100 billion, with projections approaching $125 billion by 2025. The reason is structural. Warehouse-centric returns create opacity. Delayed verification, multiple handoffs, and pooled inventory make abuse difficult to detect in real time.
Wardrobing, item swapping, empty-box scams, and triangulation fraud all exploit the same weakness: distance between the return event and its verification. Traditional countermeasures — serial matching, receipt validation, AI risk scoring — add friction, but they do not close the loop. Fraud adapts faster than controls.
More volume plus more handoffs equals more opportunity.
Fraud is not an anomaly in the returns system.
It is an emergent property of it.
Where This Leaves the Industry
By 2025, returns have become all of the following at once:
A margin destroyer.
A fraud accelerator.
A sustainability liability.
A trust-eroding customer experience.
This crisis did not arrive overnight. It was built year by year, through well-intentioned decisions layered onto an outdated model. To understand why today’s solutions keep falling short — and why incremental fixes cannot solve a structural problem — we need to examine how the industry tried to patch returns instead of rewriting them.
That is where the story goes next.
Make Returns Profitable, Yes!
Cut shipping and processing costs by 70% with our patented peer-to-peer returns solution. 4x faster than traditional returns.
See How It WorksPART II — WHY TODAY’S SOLUTIONS FAIL
How Better Tools, Bigger Networks, and More Scale Preserved the Wrong System
Part I showed why returns broke: ecommerce outgrew a warehouse-centric model that was never designed for volume, speed, or modern consumer behavior.
Part II explains why the industry’s response — better software, more infrastructure, and massive consolidation — has failed to fix that breakage.
Not because these efforts were naive.
But because they optimized around the problem instead of removing it.
The common failure mode is simple:
most solutions make the warehouse loop more efficient, more visible, and more palatable — without questioning whether it should exist at all.
Returns Software Is a Band-Aid
Over the last decade, returns management matured into a serious software category. What began as ad hoc workflows became full-fledged platforms promising smoother customer experiences, clearer policies, and better analytics. On the surface, this looks like progress — and in many ways, it is.
Modern returns software excels at the front end. Customers get branded portals instead of email chains. Policies are enforced consistently. Exchanges are encouraged. Labels are generated automatically. Return reasons are captured and categorized. Communication improves.
But none of this changes where returned items go.
In almost every implementation, returns software still routes inventory back to the same endpoints: brand-owned warehouses, third-party logistics providers, centralized inspection hubs, or carrier-managed reverse networks. The most expensive parts of the process — inbound freight, inspection labor, repackaging, and resale delay — remain intact.
This is the critical disconnect. Visibility is not recovery. Knowing why an item was returned does not eliminate inbound shipping. Dashboards do not reduce labor. Better UX does not prevent markdown decay. Fraud analytics do not erase the cost of delayed verification.
In fact, better tooling often increases return velocity. When returns become easier, faster, and more frictionless, volume rises. The customer experience improves — but the cost curve does not bend. In many cases, it steepens.
Returns software did exactly what it was designed to do: polish the on-ramp to a broken system. It was never built to challenge the assumption that every return must re-enter a warehouse before it can move forward again.
The tools improved.
The economics did not.
Scale Is Not a Solution
When software failed to meaningfully reduce cost per return, the industry turned to its oldest lever: scale.
More warehouses.
More drop-off locations.
More carrier partnerships.
More volume.
The belief was intuitive. If outbound fulfillment benefits from economies of scale, returns should too. Larger networks should lower unit costs, speed processing, and improve recovery.
That belief turned out to be wrong.
Returns are fundamentally different from outbound logistics. They are physical, labor-intensive, and exception-heavy. They do not flow predictably. They arrive in bursts. They require inspection, judgment, and manual handling. As volume increases, congestion increases faster than efficiency.
At scale, fixed costs rise. Labor becomes harder to staff and train. Transit distances often grow, not shrink. Inventory pooling delays increase markdown risk. Fraud detection becomes harder as identical SKUs move through anonymous intake queues.
The cost curve flattens.
It does not bend.
Scale improves throughput. It does not remove waste.
Why Carrier-Led Returns Are Symbolic, Not Structural
The consolidation of drop-off networks illustrates this failure perfectly.
Happy Returns began as a convenience innovation: box-free, label-free returns that lowered friction for customers. In 2021, PayPal acquired the company. In 2023, PayPal sold it to UPS. By 2024 and 2025, Happy Returns was fully integrated into the UPS Store network.
The network expanded dramatically. Consumer convenience improved. Adoption surged.
And yet, the underlying economics barely changed.
Returned items still entered centralized networks. They still required handling, consolidation, and downstream routing back into warehouses or resale pipelines. The innovation improved the first mile, not the entire journey.
The fact that Happy Returns now partners with returns software platforms instead of competing directly with them is telling. Its value lies in physical access points, not systemic cost elimination.
FedEx’s launch of FedEx Easy Returns in 2025 confirmed the pattern. Carriers are racing to own return entry points, not to eliminate reverse logistics itself. The industry is consolidating control over the loop — not breaking it.
Why Cost Curves Don’t Bend With Size
There is a simple reason scale fails to solve returns: physics.
Returns require space.
They require labor.
They require transport.
They require time.
No amount of software, capital, or carrier leverage removes those constraints if the item still has to travel backward through the system. Even perfectly optimized warehouses cannot escape the fact that returned goods lose value the longer they sit idle.
Returns suffer from diseconomies of scale. As volume increases, complexity multiplies faster than efficiency. Fraud increases. Inspection accuracy declines. Inventory velocity slows precisely when speed matters most.
This is why the industry’s favorite escape hatch — “we’ll fix it when we’re bigger” — keeps failing.
This realization is uncomfortable.
It removes the promise that growth alone will make the problem go away.
Sustainability and Regulation Remove Optionality
For years, returns were treated as a purely economic problem. That framing no longer holds.
Returns are now a visible sustainability liability.
Every return doubles transportation emissions. Packaging waste multiplies. Roughly 44% of apparel returns never reenter inventory. Reverse logistics emissions are increasingly captured in ESG reporting under Scope 3.
Outside the U.S., regulation has already moved. France banned the destruction of unsold non-food goods in 2022, forcing retailers to build resale, donation, and recycling pathways. The EU has advanced landfill restrictions and circular economy mandates. The UK’s right-to-repair laws have shifted how electronics returns are handled.
These policies are not abstract ideals. They impose real operational cost and reporting requirements.
The U.S. is lagging — but not idle. California has explored EU-style anti-waste legislation. Draft SEC climate disclosure rules include Scope 3 emissions. The FTC has begun scrutinizing “free returns” language where the environmental reality contradicts the marketing promise.
The direction is clear. Returns are moving from optional optimization to mandatory accountability.
Doing nothing is no longer neutral.
What This Section Proves
Despite better software, more scale, more capital, and more analytics, the industry has not materially reduced:
Cost per return.
Fraud exposure.
Environmental impact.
Time to recovery.
The failure is not execution.
It is architecture.
Modern solutions orbit the same assumption: that returns must go backward before they can move forward again. As long as that assumption remains intact, improvements will be incremental at best — and overwhelmed by volume at worst.
To move forward, the industry needs more than better tools or bigger networks. It needs a structural rewrite.
That rewrite begins by questioning whether returns need to go back at all.
PART III — THE SHIFT ALREADY UNDERWAY
Why the Old Returns Model Is Breaking Before Peer-to-Peer Even Arrives
Up to this point, the argument has been diagnostic. Returns broke because ecommerce outgrew a warehouse-centric system. Software and scale failed because they optimized around that system instead of replacing it.
Part III moves from diagnosis to inevitability.
The traditional returns model is not waiting to be disrupted. It is already cracking under pressure. Not because of one bold innovation, but because tolerance for its failures is collapsing simultaneously across platforms, retailers, carriers, regulators, investors, and consumers.
What follows are not “news events.” They are signals. And signals matter more than announcements, because they reveal where the system is no longer stable.
The Market Is Repricing Returns in Public
For most of ecommerce history, returns were invisible. Customers initiated them quietly. Brands absorbed the cost quietly. Marketplaces treated them as background noise.
That era is ending.
In 2024 and 2025, Amazon quietly began surfacing return behavior directly to shoppers. Products with unusually high return rates now carry warnings such as “Frequently Returned Item” on product detail pages. Internally, sellers with elevated return rates face penalties and scrutiny.
This is a subtle but foundational shift. Returns are no longer a private operational problem; they are a public signal of product quality, fit, and trustworthiness. High return rates are being reframed as a failure upstream, not just a downstream inconvenience.
Once returns become visible, they become reputational. And once they become reputational, they cannot be ignored or quietly subsidized.
At the same time, major apparel retailers began doing something that would have been unthinkable just a few years earlier: charging for returns.
Zara introduced return fees in multiple markets starting in 2022, typically around four dollars per return. Critics predicted backlash. It largely didn’t happen. H&M, Anthropologie, J.Crew, and others followed. What was once considered customer-hostile became normalized almost overnight.
The lesson was not that consumers suddenly enjoy paying for returns. It was that expectations reset when the entire market moves together. Free returns stopped being treated as a moral right and began to be understood as a priced service.
This matters because expectation resets are sticky. Once customers adapt to paid returns in one place, resistance elsewhere weakens. The social contract changes.
Returns are no longer sacred.
Consumers Are Adjusting Faster Than Retailers Expected
For years, the industry assumed that tightening return policies would trigger mass churn. That assumption underestimated how adaptable consumers actually are.
Today’s shoppers routinely accept shorter return windows, conditional refunds, paid returns, and slower reimbursements — as long as those constraints are applied consistently and transparently. What once felt punitive now feels normal.
At the same time, consumers have become more comfortable with “open box” and “like new” goods. Marketplaces normalized resale. Price-sensitive shoppers actively seek discounted returns. Sustainability-conscious buyers prefer reuse over waste.
The result is a paradox: customers still demand convenience, but they no longer demand that convenience be free, invisible, or wasteful.
This is a critical shift. It creates space for new return flows that would have been rejected outright five years ago.
Boards and Investors Have Stopped Treating Returns as a Footnote
Internally, the pressure is just as intense.
Returns are no longer buried inside fulfillment line items. They are showing up in board conversations about margin durability, working capital drag, fraud exposure, and sustainability risk.
Executives are asking questions that were rarely articulated before:
Why do returns cost what they cost?
Which portion of this expense is actually controllable?
What happens if return volume continues to grow faster than revenue?
How exposed are we to regulatory or disclosure risk?
These questions matter because they signal a loss of patience. When boards stop accepting “that’s just the cost of ecommerce” as an answer, the burden shifts from operations to strategy.
Returns are no longer an operational nuisance. They are a governance issue.
Convert Returns Into New Sales and Profits
Our peer-to-peer returns system instantly resells returned items—no warehouse processing, and get paid before you refund.
I'm Interested in Peer-to-Peer ReturnsSustainability Has Turned Returns Into a Liability, Not a Tradeoff
The sustainability dimension accelerated everything.
Returns are a carbon multiplier. Every additional shipment, box, and handling step compounds emissions and waste. In categories like apparel, where nearly half of returned items never reenter inventory, the optics are especially poor.
Outside the U.S., regulation has already forced action. France’s anti-waste laws prohibit the destruction of unsold non-food goods. The EU has advanced landfill bans and circular economy mandates. The UK’s right-to-repair laws are reshaping electronics returns.
These policies did not emerge in a vacuum. They reflect a growing consensus that waste at scale is no longer acceptable, regardless of convenience.
In the U.S., formal regulation lags, but the signals are unmistakable. Scope 3 emissions are creeping into disclosure frameworks. States are experimenting with extended producer responsibility rules. “Free returns” claims are facing scrutiny when the environmental reality contradicts the marketing narrative.
The direction is one-way. Returns are becoming measurable, reportable, and eventually regulated.
The Warehouse Is the Wrong Endpoint — Permanently
Taken together, these pressures expose a deeper truth: the warehouse is no longer a viable default endpoint for returns.
Warehouses made sense when return volume was low, labor was cheap, consumer patience was high, and waste was invisible. None of those conditions exist today.
No amount of software can change the physics of two shipping legs. No amount of scale can eliminate inspection labor. No amount of consolidation can prevent time from destroying resale value.
Sending goods backward through the supply chain is structurally misaligned with how modern ecommerce operates: fast, distributed, demand-driven, and increasingly conscious of waste.
This is the point of no return.
The industry has tried every way to escape without challenging this assumption. Resale, drop-offs, BORIS, exchanges, AI prevention, insurance, consolidation — each addresses a symptom. None remove the underlying cause.
They buy time.
They do not change trajectory.
Why This Moment Is Different
What makes this moment different is not innovation. It is convergence.
Platforms are making returns visible and punitive.
Retailers are pricing returns explicitly.
Carriers are consolidating without lowering cost.
Regulators are framing returns as waste.
Consumers are recalibrating expectations.
Boards are demanding accountability.
When pressure comes from every direction at once, systems don’t adapt slowly. They break.
The industry is no longer asking how to optimize returns. It is beginning to ask a more dangerous question:
Why do returns have to work this way at all?
That question is the opening peer-to-peer steps into.
PART IV — PEER-TO-PEER RETURNS
The Structural Rewrite
Up to this point, every attempt to fix returns has shared one unexamined assumption: that returned goods must travel backward through the supply chain before they can move forward again.
Peer-to-peer returns begin by rejecting that assumption.
They do not optimize the existing system. They do not make warehouses faster or returns portals friendlier. They change the direction of the flow itself.
What Peer-to-Peer Returns Actually Are
At its core, peer-to-peer returns are not a new policy or a new customer experience. They are a routing decision.
In the traditional model, a return is a detour. An item leaves the forward supply chain, enters a warehouse for inspection and processing, and only later—if it survives—reenters the market. Time, labor, and value are lost in the gap.
Peer-to-peer returns eliminate that detour.
Instead of sending an eligible return back to a warehouse, the system forwards that item directly from the returning customer to the next buyer who wants it. The return does not boomerang. It continues moving forward.
Mechanically, the process looks familiar at the surface. A customer initiates a return through a branded portal, just as they would today. Eligibility is evaluated using criteria the retailer already understands: SKU type, condition thresholds, return reason, demand signals, and regulatory constraints.
What changes happens next.
If the item qualifies, a “like new” or “open box” version of that SKU is created and surfaced directly on the same product page as the new item, clearly labeled and modestly discounted. When another customer purchases it, the original returner is issued a shipping label addressed not to a warehouse, but to that next buyer.
Once the item is shipped and delivery is confirmed, refunds, inventory records, and financials update automatically. In some implementations, returners receive small incentives for proper preparation and condition compliance, aligning behavior with outcomes.
Nothing about ecommerce needs to be rebuilt for this to work. Checkout stays the same. Customer support stays the same. Carrier infrastructure stays the same.
Only the routing logic changes.
That distinction is critical. Peer-to-peer returns are not a new stack. They are a different assumption inside the existing stack.
What Peer-to-Peer Removes From the System
The power of peer-to-peer returns comes not from what they add, but from what they remove entirely.
In the warehouse-centric model, every return enters the most expensive environment in retail. It must be received, inspected, reprocessed, re-shelved, or disposed of. Even “good” returns sit in queues, waiting for labor, losing value with each passing day.
Peer-to-peer removes warehouse intake altogether for eligible items. There is no inbound dock. No receiving crew. No inspection backlog. Returned goods never enter the costliest part of the system.
It also removes redundant shipping. Traditional returns require at least two legs: outbound to the customer, inbound back to the warehouse, and often a third leg if the item is resold or liquidated. Peer-to-peer collapses this into a forward-only flow. The return ships once more, directly to demand.
Time disappears as a cost driver. In traditional flows, delay silently destroys value through markdowns and missed selling windows. In peer-to-peer, resale happens immediately. Discounts are intentional and transparent, not reactive and compounding.
Opacity disappears as well. Instead of separating the customer experience, the physical product, and the financial settlement into disconnected timelines, peer-to-peer ties them together. Refunds are faster. Tracking is clearer. Accountability improves.
These are not efficiency gains. They are stage eliminations.
What Peer-to-Peer Adds to the System
Removing stages creates room for new advantages.
Speed is the most obvious. Items move faster. Refunds arrive sooner. Inventory velocity increases. What once took weeks compresses into days.
Recovery becomes the default outcome rather than the exception. Because items are resold before value decays, fewer products fall into liquidation or destruction. More inventory stays productive.
Accountability tightens. Direct point-to-point shipping reduces anonymous handling and shrinks opportunities for fraud. Refunds tied to confirmed delivery make abuse harder to execute quietly.
Perhaps most importantly, incentives realign. In the traditional model, returners are detached from outcomes. The item disappears into “the system.” In peer-to-peer flows, customers understand that condition matters, because another person is receiving the item. This mirrors the behavioral shift seen in ride-sharing and resale platforms, where mutual accountability reduces abuse without heavy policing.
The system becomes more human, not more bureaucratic.
The Economics of Peer-to-Peer Returns
The economic case for peer-to-peer returns follows directly from the structural changes.
In a traditional return, roughly thirty to forty dollars of value are lost for every hundred dollars of returned merchandise once shipping, labor, markdowns, and shrinkage are fully accounted for. These losses are not anomalies; they are systemic.
Peer-to-peer returns remove entire cost layers. There is no warehouse labor. No intake processing. No repeated markdown cycles. Shipping is reduced to a forward leg rather than a round trip.
In practice, this cuts average return losses by more than half for eligible items. Even conservative scenarios show losses dropping from roughly thirty-seven dollars per hundred to closer to fifteen.
This matters because returns losses are not evenly distributed. A large share of total return cost is concentrated in recoverable items that are still perfectly sellable. Peer-to-peer does not need to handle every return to deliver disproportionate value.
In real operations, routing just thirty to sixty percent of returns peer-to-peer captures most of the economic upside. The cost curve bends early.
Warehouses still exist. They simply stop being the default destination for items that never needed to go there in the first place.
Sustainability Is a Consequence, Not a Feature
Peer-to-peer returns were not designed as a sustainability initiative. Sustainability is the byproduct of removing wasteful motion.
Traditional returns multiply emissions by doubling or tripling transportation and packaging. Peer-to-peer removes at least one shipment and one box from the loop.
Across millions of returns, this reduction is material. More importantly, it is measurable. Scope 3 emissions decline in ways that can be reported, not inferred. Waste decreases because more items stay in active use.
In a regulatory environment moving toward disclosure and accountability, this matters more than green marketing ever did.
Fraud Becomes Harder Because the System Is Simpler
Fraud thrives in complexity. Every handoff, delay, and anonymous queue creates an opening.
Peer-to-peer reduces those openings. Fewer touchpoints mean fewer opportunities for swaps, wardrobing, and empty-box scams. Refunds tied to delivery confirmation close timing gaps that fraudsters exploit.
This does not eliminate fraud entirely. No system does. But it shifts the balance. Fraud prevention becomes structural rather than reactive.
Peer-to-Peer Is Not Universal — and That’s the Point
Not every SKU belongs in a peer-to-peer flow. Fragile goods, regulated products, defective items, and certain seasonal edge cases will always require centralized handling.
This is not a weakness. It is the reason the model is credible.
Peer-to-peer returns are a hybrid strategy. They coexist with warehouses. They respect constraints. They focus on the portion of returns where the waste is obvious and the economics are broken.
That restraint is precisely what makes the model scalable.
Core Takeaway
Peer-to-peer returns work because they change where returns go, not how politely they are processed.
Traditional returns turn every return into a cost center.
Peer-to-peer turns a large share of them into margin protectors.
This is not optimization.
It is escape velocity.
PART V — LIMITATIONS, REALITY, AND CREDIBILITY
If peer-to-peer returns were presented as a universal solution, it would immediately fail the credibility test.
Retail logistics does not reward absolutes. Any model that claims to work for every product, every category, and every scenario is either naïve or dishonest. Peer-to-peer returns are neither. They are powerful precisely because they are constrained.
This section exists to draw those boundaries clearly.
Where Peer-to-Peer Does Not Work
Peer-to-peer returns succeed by removing unnecessary stages. But not all returns are unnecessary, and not all products can safely bypass centralized handling.
Some goods simply cannot tolerate a second shipment when packed by consumers. Fragile items—glassware, ceramics, delicate electronics—carry an unacceptable risk of damage if they are forwarded without professional repackaging. In these cases, controlled inspection and standardized outbound protection remain the safer option. Warehouses still earn their keep here.
Regulatory constraints create another hard boundary. Categories such as cosmetics, personal care, medical devices, and consumables face legal and compliance requirements that restrict resale or re-routing. Chain-of-custody matters. Inspection is non-negotiable. Until regulations evolve, peer-to-peer adoption in these verticals will remain limited, regardless of economic appeal.
Then there are damaged or defective items. Not every return is a recoverable asset. Products that arrive broken, incomplete, or non-functional must be verified, diagnosed, and routed into repair, replacement, or claims workflows. Peer-to-peer is not designed to handle failure cases. It is designed to recover value from inventory that is still viable.
Timing matters as well. End-of-season apparel, event-driven merchandise, and trend-sensitive SKUs lose relevance quickly. If downstream demand no longer exists, forwarding offers no advantage. In those scenarios, liquidation, recycling, or disposal may still be the least bad option.
These limits do not undermine the model. They define its operating envelope. A system that knows where to stop is far more trustworthy than one that claims to replace everything.
The Hybrid Reality
No serious retailer should aim for 100% peer-to-peer adoption. And none will achieve it.
In real operations, a meaningful share of returns will always require traditional handling. Items arrive damaged. Categories are restricted. Some returns occur too late in the selling cycle to be recoverable. Expecting otherwise is fantasy.
What matters is where the losses actually live.
Across most ecommerce businesses, the majority of return-related losses are concentrated in a subset of recoverable items: products that are intact, in-demand, and returned for non-defect reasons. These are the returns that bleed margin when routed through warehouses unnecessarily.
In practice, this often represents roughly sixty percent of returns. That is where peer-to-peer delivers its leverage. The remaining forty percent continue through traditional reverse logistics, handled by warehouses that now specialize in exceptions rather than serving as default endpoints.
This hybrid model outperforms both extremes. Pure warehouse-centric systems maximize cost. Pure peer-to-peer systems are operationally fragile. Hybrid models capture the upside without overreach.
Warehouses do not disappear. Their role changes.
Common Objections — and Why They Miss the Point
Most objections to peer-to-peer returns argue against the wrong thing. They assume replacement, when the actual goal is rerouting.
The first objection is customer acceptance. The concern is that shoppers will reject anything that deviates from familiar return flows. But customer behavior has already shifted. Paid returns are now common. “Open box” goods are normalized across major marketplaces. Sustainability awareness is rising. Acceptance hinges not on routing diagrams, but on outcomes: faster refunds, clear labeling, fair pricing, and transparency.
When those conditions are met, customers respond to benefits, not backend mechanics.
Another objection is friction. The assumption is that peer-to-peer adds steps. In reality, traditional returns already impose friction—repackaging, label printing, long refund delays—much of which is invisible only because customers have been conditioned to tolerate it. Peer-to-peer can reduce steps rather than add them, particularly when refunds are faster and outcomes are clearer.
Returns software is often cited as a reason peer-to-peer is unnecessary. This misunderstands the role of software. Returns management systems optimize requests, policies, and visibility. They do not change where inventory flows. Peer-to-peer does not compete with returns software. It complements it by altering the most expensive decision the software currently does not make.
Finally, there is the belief that scale will eventually fix returns. This has already been tested. More warehouses did not reduce per-return cost. Carrier consolidation did not eliminate labor. Volume amplified fraud and markdown risk rather than containing it. Scale improves throughput. It does not remove structural waste.
Peer-to-peer does not promise infinite scale. It changes direction.
Why This Chapter Matters
This section exists to prevent overclaiming. It enables pragmatic adoption. It arms operators, executives, and boards with clear answers to predictable pushback. Most importantly, it reinforces trust with skeptical readers.
Peer-to-peer returns are not universal—and they do not need to be.
They work because they target recoverable inventory, coexist with warehouses, and eliminate entire cost layers where doing so is both safe and rational.
The question is not whether peer-to-peer replaces everything.
It is whether retailers can afford to keep sending clearly recoverable returns back to places they never needed to go.
PART VI — STRATEGY & EXECUTION
What to Do Next — and Why Delay Is the Riskiest Option
By this point, three facts should be unambiguous.
First, returns are structurally broken.
Second, incremental fixes—better software, tighter policies, more scale—have failed to correct that breakage.
Third, peer-to-peer returns represent a credible structural alternative, not because they optimize the existing system, but because they change its direction.
This section answers the only question that matters now: what should leaders actually do?
The Executive Case for Change
Returns are no longer a back-office detail. They sit at the intersection of finance, operations, customer experience, and governance. That makes them a board-level issue, whether they are discussed explicitly or not.
From a finance perspective, returns represent silent margin erosion. They introduce downside risk that is rarely modeled properly, trap working capital in slow-moving inventory, and quietly erase customer acquisition spend. CFOs care less about return rates than about fully loaded cost per return, recovery rates, and predictability of cash flow. Peer-to-peer matters here because it removes entire cost categories rather than attempting to manage them more efficiently. The financial question is no longer whether returns are expensive. It is whether the organization is structurally equipped to make them cheaper.
Operations teams feel the pressure first. Warehouse-centric returns create inbound congestion, labor volatility, exception-heavy workflows, and seasonal bottlenecks that scale poorly precisely when demand spikes. For COOs, peer-to-peer is not about replacing infrastructure. It is about protecting core operations from being overwhelmed by exceptions. By shifting recoverable returns out of centralized intake, peer-to-peer reduces operational drag where it hurts most.
Marketing leaders see returns as part of the brand experience, not a logistics afterthought. Customers increasingly expect fast refunds, transparency, and credible sustainability narratives. Defending outdated returns policies is becoming harder as waste becomes visible and fees normalize across the market. Peer-to-peer supports faster refunds, clearer messaging, and discounted “Like New” options that align price sensitivity with sustainability. For CMOs, the risk is not changing returns. The risk is explaining why nothing has changed.
At the board level, returns intersect with margin durability, regulatory exposure, ESG commitments, and long-term competitiveness. Boards are beginning to ask why return costs are rising faster than revenue, which portions of those costs are actually controllable, and what happens if regulation moves faster than internal systems. Peer-to-peer does not answer every question. But it changes the direction of travel, which is ultimately what boards care about.
No More Return Waste
Help the planet and your profits—our award-winning returns tech reduces landfill waste and recycles value. Real savings, No greenwashing!
Learn About Sustainable ReturnsA Pragmatic Adoption Roadmap
The goal is not disruption for its own sake. The goal is measurable progress with controlled risk.
Any credible adoption begins with baseline measurement. Before changing routing, organizations must understand their current returns P&L. That means breaking down cost per return into shipping, labor, markdowns, fraud, and refund cycle time. It means understanding return rates by SKU and recovery rates of returned inventory. Without this baseline, improvements remain anecdotal and ROI cannot be defended. Measurement is not a finance exercise. It is the foundation of strategic decision-making.
The next step is defining SKU eligibility. Not all products should follow the same return path. High-fit peer-to-peer candidates typically share stable resale value, durable packaging, predictable demand, and lower regulatory constraints. Fragile, regulated, custom, or perishable goods remain in traditional flows. Clear eligibility rules prevent overreach and protect customer trust.
Successful programs start with pilots, not rollouts. A disciplined pilot focuses on a narrow SKU set, limited geography, or specific customer segment. Economics, customer experience, and fraud signals are tracked closely. The goal is evidence, not optimism. Executives expand confidently when pilots produce data rather than anecdotes.
Guardrails must evolve alongside adoption. Peer-to-peer shifts where risk can occur, not whether risk exists. Effective controls include condition proof at initiation, AI-assisted risk scoring for edge cases, refunds tied to confirmed delivery, and incentives for proper preparation. These safeguards should tighten as volume grows, not lag behind it.
Once validated, expansion becomes normalization. SKU coverage increases. Geographic scope widens. Peer-to-peer becomes a default routing decision for eligible items rather than a special program. At scale, it fades into the background as infrastructure, not initiative.
The Future of Returns
Returns will evolve with or without proactive action. The question is who shapes that evolution.
In a best-case scenario, peer-to-peer adoption becomes widespread. More than half of recoverable returns bypass warehouses. Return costs shrink materially. Scope 3 emissions decline measurably. Returns become a loyalty and margin lever rather than a tolerated tax.
In a middle-case scenario—arguably the most likely—hybrid models dominate. Thirty to forty percent of returns route peer-to-peer. Warehouses handle true exceptions. Meaningful savings are achieved without full reinvention. This outcome alone represents a major improvement over today’s status quo.
The worst-case scenario is not failure of peer-to-peer. It is delay. Regulation outpaces innovation. Return restrictions tighten before systems modernize. Costs rise faster than revenue. Brands face compliance risk and margin compression simultaneously. In this world, returns remain a liability—and late adopters pay the highest price.
Delay is not neutral. Every year locks in avoidable cost, increases regulatory exposure, normalizes inefficient behavior, and weakens competitive position. Structural problems do not self-correct.
Core Takeaway
Returns are shifting from a tolerated cost to a strategic capability.
The question facing retailers is no longer, “Can we afford to change how returns work?”
It is, “Can we afford not to?”
Peer-to-peer returns are not a trend. They are a structural response to a system that no longer fits modern commerce. The companies that act early will shape the standard. Those that wait will inherit it.
PART VII — CONCLUSION
Returns Don’t Need to Go Back. They Need to Go Forward.
For more than a decade, ecommerce treated returns as a necessary inconvenience—something to be absorbed, optimized around, or hidden behind policy language. Even as return volumes exploded, margins thinned, fraud accelerated, and sustainability pressure mounted, the underlying mindset stayed intact. Returns were framed as an execution problem.
This work shows that framing was wrong.
Returns did not break because retailers executed poorly. They broke because the system they were built on no longer fits how commerce actually operates.
The original design assumptions made sense in another era: lower volumes, slower decision-making, cheaper labor, invisible waste, and centralized infrastructure that could quietly absorb exceptions. Modern ecommerce operates under none of those conditions. Yet the industry responded by layering software on top of warehouses, expanding physical networks, consolidating carriers, tightening policies, and shifting risk onto customers. Each response bought time. None changed direction.
What actually changes outcomes is not better tooling or stricter rules. It is changing the routing logic itself.
Peer-to-peer returns matter because they challenge the most fundamental assumption in reverse logistics: that goods must travel backward before they can move forward again. By rerouting eligible returns directly to the next buyer, entire cost layers disappear. Inventory velocity improves. Fraud opportunities shrink. Waste declines. Sustainability becomes measurable instead of rhetorical.
This is not optimization. It is structural realignment.
The shift toward peer-to-peer returns is not happening in isolation. It is emerging at the intersection of forces that can no longer be ignored. Platforms are making returns visible and punitive. Retailers are normalizing return fees. Carriers are consolidating without reducing cost. Regulators are targeting waste and emissions. Consumers are recalibrating expectations. Boards are asking harder questions.
Taken together, these forces mean the old model is not merely inefficient—it is unstable. Stability will not return by doing more of the same.
Peer-to-peer returns are not a feature, a tool, or a policy tweak. They represent a different way of thinking about returns: as forward-moving transactions, as recoverable value flows, as moments of shared accountability, and as strategic infrastructure rather than operational cleanup. They coexist with warehouses. They respect constraints. They do not pretend to solve everything.
That restraint is their strength.
Every retailer now faces the same decision, whether explicitly or by default. Continue absorbing return losses and hope incremental fixes keep pace—or redesign returns as a system that reflects how commerce actually works today. Doing nothing is not neutral. It is a decision to let costs, fraud, and waste compound.
Returns are no longer a back-office problem. They are a test of whether ecommerce infrastructure can evolve without breaking under its own weight.
Peer-to-peer returns do not promise perfection. They offer something more valuable: a credible path out of a system that no longer works.
Returns don’t need to go back.
They need to go forward.
Written By:

Manish Chowdhary
Manish Chowdhary is the founder and CEO of Cahoot, the most comprehensive post-purchase suite for ecommerce brands. A serial entrepreneur and industry thought leader, Manish has decades of experience building technologies that simplify ecommerce logistics—from order fulfillment to returns. His insights help brands stay ahead of market shifts and operational challenges.
Turn Returns Into New Revenue
Related Articles
Seller Fulfilled Prime Works — But Only With the Right Operating Model
Seller Fulfilled Prime is attractive for very rational reasons.
SLA Meaning in Logistics: What Service Level Agreements Actually Guarantee (and What They Don’t)
The gap between what 3PL providers promise in SLA marketing (“99.
HTS Code Explained: What It Is, Why It Matters, and How Ecommerce Brands Use It
HTS codes (Harmonized Tariff Schedule codes) are standardized numerical classifications that identify imported products for U.
Fast Delivery Isn’t the Hard Part – Inventory Decisions Are
In this article
19 minutes
- Why Fast Fulfillment Strategy is Essential: Carrier Optimization Cannot Overcome Inventory Constraints
- The hidden economics of multi-warehouse fulfillment
- When expedited shipping becomes a symptom of structural failure
- Calculating true delivery cost beyond carrier rates
- Predictive logistics transforms inventory positioning
- Operational cascades from inventory misplacement
- Decision frameworks for inventory management and network design
- The importance of customer satisfaction in fulfillment strategy
- Creating a competitive advantage through inventory placement
- Practical implementation for operations leaders
- Peak season exposes inventory placement decisions
- Frequently Asked Questions
Fast delivery is no longer a differentiator in ecommerce, it is an expectation. Same-day and next-day promises are now table stakes, driven by regional carrier expansion, AI-assisted routing, and increasingly dense fulfillment networks. Industry discussions, including recent coverage in Inbound Logistics, have rightly reframed expedited shipping as a systems problem rather than a pricing one.
What those conversations often stop short of explaining is why so many brands still fail to execute fast fulfillment consistently. The issue is rarely the carrier. It is almost always the inventory decision that came before the order was ever placed.
Where you store inventory, not which carrier you choose, determines whether fast delivery is economically viable. Strategic inventory positioning achieves 71% faster delivery compared to single-location fulfillment, while brands trying to “buy speed” through expedited shipping often pay 3-5x ground rates to compensate for poor placement decisions. The math is unforgiving: a package traveling from Los Angeles to Boston cannot reach customers in two days via ground shipping regardless of carrier, but the same order fulfilled from a Pennsylvania warehouse arrives in Zone 2 transit times at a fraction of the cost.
Why Fast Fulfillment Strategy is Essential: Carrier Optimization Cannot Overcome Inventory Constraints
Shipping costs are fundamentally determined by distance-based pricing zones, not carrier selection. A 35-pound FedEx Ground package costs approximately $20.93 in Zone 2 (local) versus $25.74 in Zone 3, a 23% increase for just one zone jump. At Zones 6-8, costs can exceed the baseline by 80-120%. Carrier optimization provides 10-15% savings within a given zone; proper inventory placement can eliminate 2-3 zones entirely.
The coverage math illustrates this principle clearly. A single centrally-located warehouse (Kansas or Kentucky) reaches 60-70% of the US population within two-day ground shipping. Adding a second strategic location (Knoxville, Tennessee plus Salt Lake City, Utah, for example) extends that coverage to 96% of US addresses. A three-warehouse configuration (coasts plus central hub) reaches 98% or more. Commonwealth Inc. research suggests that same-day delivery requires 15-25 facilities across major markets, next-day needs 5-7, and two-day coverage requires just 3-5 strategically positioned locations.
Real time inventory tracking and accurate monitoring of inventory levels are essential for optimizing inventory placement and preventing stockouts or overstocking. Warehouse management systems (WMS) provide real-time visibility into stock levels across all warehouses and fulfillment centers, while an Order Management System (OMS) ensures a single source of truth by updating inventory levels instantly after every sale. This real-time visibility supports strategic decisions for a fast fulfillment strategy.
J&J Global Fulfilment’s CCO Claudine Mosseri observes that most businesses fundamentally misunderstand their actual customer distribution: “Most businesses have no idea how their customers are distributed across shipping zones. They think they serve customers ‘nationwide’ but when we analyze their actual ZIP codes, we often find the majority of orders going to just three or four zones. That changes everything about their optimal fulfillment strategy.”
Slash Your Fulfillment Costs by Up to 30%
Cut shipping expenses by 30% and boost profit with Cahoot's AI-optimized fulfillment services and modern tech —no overheads and no humans required!
I'm Interested in Saving Time and MoneyThe hidden economics of multi-warehouse fulfillment
The case for distributed inventory appears straightforward: ShipBob merchants report 13% overall shipping cost savings from distributed inventory, and cookware brand Our Place achieved $1.5 million in annual freight savings by expanding from two to four warehouses while cutting delivery times from 5-6 days to 2.5 days. These headline numbers, however, obscure substantial hidden costs that can reverse the economics for smaller operations.
Storage costs alone can increase dramatically when splitting inventory. A single warehouse storing 1,000 cubic feet at $0.75 per cubic foot costs $750 monthly. The same inventory split across two warehouses at 750 cubic feet each (with higher per-unit rates of $0.85) costs $1,275, representing 70% higher storage expense. Safety stock multiplication compounds this: a slow-moving item requiring one pallet in a single warehouse may need three pallets across three locations, tripling carrying charges for that SKU.
Additional hidden costs include inbound freight duplication (multiple container shipments instead of consolidated receiving), inventory transfer expenses when demand shifts require rebalancing, technology upgrades for multi-location warehouse management systems, and sales tax nexus obligations in each state where inventory resides. Implementing real time inventory tracking and real-time visibility in inventory management helps prevent overstocking or stockouts, optimizing capital invested in inventory and reducing hidden costs. Many 3PLs also charge minimum monthly fees per warehouse location, averaging $195-$337 as of 2024.
The break-even threshold is higher than commonly advertised. Red Stag Fulfillment estimates a minimum of $5 million GMV or 50-100+ daily orders before multi-warehouse economics become favorable. Below this volume, distributed fulfillment often creates “higher inventory costs, increased inbound shipping expenses, and reduced efficiency.”
When expedited shipping becomes a symptom of structural failure
Paying premium shipping rates to compensate for inventory placement failures represents a false economy that compounds over time. OnTrac research reveals that 88% of retailers still display vague delivery ranges like “4-6 business days” at checkout, while 84% of consumers used expedited shipping in the past six months. The disconnect suggests widespread reliance on speed premiums rather than network optimization.
The diagnostic signs of poor inventory placement are measurable: high percentage of Zone 6-8 shipments, frequent air shipping to maintain delivery promises, and stockouts requiring emergency expedited transfers between warehouses. One illustrative calculation: if 20% of orders require expedited shipping at an $8 per-order premium, annual costs reach $16,000 for a 10,000-order business. That may sound manageable until compared against the $30,000-$100,000+ annual overhead of operating a second warehouse that could eliminate much of that expedited volume.
The breaking point indicators include warehouse capacity at 80%+ for three or more consecutive months, delivery performance slipping despite team effort, expedited shipping consuming more than 15% of the shipping budget, and Zone 7-8 shipments representing over 30% of orders. At these thresholds, paying for speed rather than building infrastructure becomes unsustainable. Focusing solely on speed can result in sacrificing accuracy, leading to incorrect shipments that cause costly errors, returns, and customer dissatisfaction. Slow fulfillment also leads to customer dissatisfaction and lost sales, highlighting the need for quality control to ensure order accuracy while optimizing for speed.
Calculating true delivery cost beyond carrier rates
The complete cost formula extends far beyond published shipping rates: True Delivery Cost = Direct Shipping + Hidden Costs + Opportunity Costs + Infrastructure Costs. Direct costs include base carrier rates, fuel surcharges (20-30% of total), residential delivery surcharges, dimensional weight adjustments, and peak season surcharges that add 15-30% during holidays.
Hidden costs prove particularly consequential. Online returns average 20-30% versus 9% for in-store purchases, with returns processing adding 30% to initial delivery emissions. Fast shipping increases CO₂ emissions by up to 15%, while transportation costs jump 68% for expedited service. Shipping and returns account for 37% of total greenhouse gas emissions in online shopping, an increasingly material concern for brands and investors.
Operational complexity creates additional hidden costs when managing multiple locations. Multi-warehouse WMS and order management system upgrades typically cost $5,000-$8,000+ annually. Inventory allocation errors lead to cross-warehouse transfers. Split shipments (multiple packages to the same customer) occur in 40% of ecommerce orders and cost 25-30% more than consolidated fulfillment due to duplicate handling and freight charges.
To streamline operations and improve order processing, integrating warehouse management systems, barcode scanners, or AI-driven automation can minimize human errors and significantly boost speed and accuracy. Streamlining order processing through automation—such as automating order entry, invoicing, and tracking—and leveraging barcode scanners for picking and packing not only speeds up the fulfillment process but also reduces costly mistakes.
Healthy benchmarks provide useful reference points: fulfillment should represent 8-12% of revenue, with percentages above 15% indicating inefficiency. Shipping typically comprises 40-70% of total fulfillment costs. Average US cost per package reached $9.08 in 2024, while 3PL fulfillment ranges from $4-10 per order versus $7-15 for in-house small business operations.
Looking for a New 3PL? Start with this Free RFP Template
Cut weeks off your selection process. Avoid pitfalls. Get the only 3PL RFP checklist built for ecommerce brands, absolutely free.
Get My Free 3PL RFPPredictive logistics transforms inventory positioning
Geographic-level demand forecasting has evolved from competitive advantage to operational necessity. Modern forecasting employs hierarchical architectures analyzing demand at SKU, location, regional, category, and channel levels simultaneously. The critical variables extend beyond historical sales to include geodemographics (communities surrounding each location have distinct shopping patterns), regional seasonality, local competitive dynamics, and weather patterns.
Amazon’s 2013 anticipatory shipping patent (US8615473B2) established the conceptual framework now becoming industry standard: inventory proactively pushed toward geographical areas based on predicted demand, with final destination assignment occurring en route. The patent model incorporates historical buying patterns, wish lists, shopping cart activity, and even cursor hover time to forecast regional demand.
Leading platforms operationalize these concepts at scale. Blue Yonder’s cognitive demand planning incorporates hundreds of variables including economic data like CPI, inflation, GDP, interest rates, and fuel prices. Manhattan Associates’ fulfillment optimization simulation engine models alternative strategies balancing cost, speed, service level, and margin, achieving up to 50% reduction in split shipments. Walmart’s route optimization technology avoided 94 million pounds of CO₂ by eliminating 30 million unnecessary miles.
The ROI data supports investment: AI implementations demonstrate 20-30% average inventory reduction and 65% reduction in lost sales due to out-of-stock situations. One multinational food company achieved $70 million in value within six weeks of AI deployment. A multi-location retailer operating 12 regional warehouses reduced total network inventory by 18% while improving fill rates from 89% to 96%.
With the rapid growth of e-commerce, scalable and efficient order fulfillment strategies are essential to support increasing sales volumes and business expansion. Developing a fast fulfillment strategy in 2026 requires predictive operations, distributed networks, and unified technology ecosystems, enabling growth by supporting scalability and operational efficiency.
Operational cascades from inventory misplacement
When inventory sits in the wrong location, costs compound through multiple channels simultaneously. The average fulfillment or shipping error costs $35-58.50 per incident excluding customer service time. Split shipments (an almost inevitable consequence of distributed inventory without intelligent routing) increase costs by 25-30% through duplicate handling and freight charges while confusing customers and eroding brand trust.
Fulfillment errors and delays can significantly damage brand reputation and erode customer trust, leading to a negative customer experience. Effective order fulfillment helps businesses manage demand, streamline logistics, and minimize inefficiencies, all of which are crucial for maintaining a positive customer experience and protecting brand reputation.
The compounding pattern follows a predictable trajectory: immediate higher per-order shipping costs and customer confusion; short-term increased “where is my order” inquiries and customer service costs; medium-term lost repeat purchases and negative reviews; long-term eroded market share and reduced customer lifetime value. Baymard research shows 49% of customers cite unexpected shipping costs as their primary reason for cart abandonment, while PwC found 41% of luxury shoppers would switch brands after a single poor delivery experience.
Stockout dynamics differ significantly between concentrated and distributed inventory. Concentrated inventory creates catastrophic single-point-of-failure risk, where any disruption leaves no backup options. Distributed inventory ensures that stockouts in one region don’t impact operations elsewhere, though it requires sophisticated demand forecasting to avoid the opposite problem: popular SKUs running out in one location while sitting overstocked in another. One brand using three fulfillment centers “encountered issues: popular SKUs would run out in one location and sit overstocked in another, causing lost sales until stock was rebalanced.” They ultimately reverted to two warehouses.
Decision frameworks for inventory management and network design
The signals indicating readiness for distributed fulfillment are measurable: shipping costs rising as a percentage of revenue, high concentration of orders shipping to Zones 5-8, frequent express shipping to maintain delivery promises, single warehouse bottlenecking during volume spikes, customer complaints about delivery times increasing, and competitors offering faster delivery in key markets.
The decision matrix balances multiple factors. Single-warehouse strategies favor businesses with fewer than 100 daily orders, under $5 million annual GMV, customer geography concentrated in 2-3 regions, unique or differentiated products where customers will wait, high SKU counts that would multiply carrying costs, and low margins that cannot absorb overhead. Multi-warehouse strategies favor the inverse: 100+ daily orders, $5 million+ GMV, truly nationwide dispersed customers, commodity products where speed provides competitive advantage, low SKU counts, and high margins.
ABC-XYZ inventory segmentation provides a practical allocation framework. “A” items (the top 20% of SKUs generating 80% of revenue) should be placed in multiple fulfillment centers nearest customers. “B” items warrant centralized or limited distribution. “C” items (slow-movers) belong in single locations and may be candidates for discontinuation. The XYZ overlay addresses demand predictability: predictable demand (X) allows confident distribution, variable demand (Y) requires safety stock buffers, and unpredictable demand (Z) should remain centralized to reduce risk of stockouts or overstock situations. To meet demand across multiple sales channels, businesses must align their inventory and fulfillment processes by integrating sales channels and developing a comprehensive order fulfillment strategy. A successful order fulfillment strategy optimizes every aspect of the product fulfillment process, ensuring efficient operations and customer satisfaction.
The importance of customer satisfaction in fulfillment strategy
Customer satisfaction is at the heart of every successful e-commerce business, and a robust fulfillment strategy is essential to consistently meet customer expectations. In today’s competitive landscape, customers expect fast, reliable, and transparent order fulfillment. When the fulfillment process is streamlined—delivering orders accurately and on time—customers are more likely to be delighted with their experience, leading to higher rates of repeat purchases and positive word-of-mouth.
A well-designed order fulfillment process goes beyond simply shipping products; it encompasses every touchpoint, from the moment a customer places an order to the final delivery. Offering multiple shipping options allows customers to choose the speed and cost that best fits their needs, while real-time tracking and proactive updates provide peace of mind and build trust. Ensuring accuracy in picking, packing, and shipping not only reduces costly errors but also enhances the overall delivery experience.
Prioritizing customer satisfaction within your fulfillment strategy is a critical role for any e-commerce business aiming for long-term success. Satisfied customers are more likely to return, recommend your brand, and become loyal advocates. By focusing on fulfillment processes that consistently meet or exceed customer expectations, businesses can drive growth, strengthen their reputation, and secure a competitive position in the market.
Creating a competitive advantage through inventory placement
Strategic inventory placement is a powerful lever for gaining a competitive advantage in e-commerce fulfillment. By analyzing sales data and leveraging demand forecasts, businesses can identify their top-performing products and position them optimally within their warehouse or across multiple distribution centers. This targeted approach reduces picking and packing times, lowers labor costs, and accelerates delivery speed—key factors in improving customer satisfaction and reducing shipping costs.
Modern inventory management systems and warehouse management systems enable real-time tracking of stock levels, allowing businesses to dynamically adjust inventory placement as demand shifts. This agility ensures that high-demand items are always close to the customers who want them, minimizing delays and enhancing fulfillment speed. For many businesses, partnering with third-party logistics providers or utilizing specialized fulfillment centers can further streamline fulfillment operations, reduce operational costs, and elevate service quality.
Optimizing inventory placement not only improves the efficiency of the fulfillment process but also supports a more responsive and scalable fulfillment strategy. By reducing operational and labor costs, increasing delivery speed, and ensuring products are always available where they’re needed most, businesses can achieve a true competitive edge. In a market where customers expect fast, reliable service, smart inventory placement is essential for meeting demand, improving customer satisfaction, and driving sustained business growth.
Scale Faster with the World’s First Peer-to-Peer Fulfillment Network
Tap into a nationwide network of high-performance partner warehouses — expand capacity, cut shipping costs, and reach customers 1–2 days faster.
Explore Fulfillment NetworkPractical implementation for operations leaders
An effective inventory placement audit begins with mapping customer concentration by ZIP code, identifying where the majority of orders actually originate. Many brands discover that 60-70% of orders concentrate in major coastal metros despite assumptions of nationwide distribution. Current zone distribution analysis reveals what percentage of orders ship in lower-cost Zones 1-4 versus expensive Zones 5-8. Cost-per-zone and transit time calculations establish the baseline for improvement.
SKU-level analysis applies the Pareto principle: 80% of sales come from 20% of SKUs. These “A” SKUs merit multi-location distribution investment, while slow-movers should remain centralized. Reorder quantity calculation (Average Daily Units Sold × Average Lead Time) combined with demand variability analysis determines appropriate safety stock levels for each location.
To further improve efficiency and reduce costs, it is essential to optimize warehouse layout and warehouse operations. Optimizing warehouse layout reduces picking and packing times, while streamlining fulfillment processes can lower costs and increase efficiency across the operation.
Common implementation mistakes include selecting fulfillment partners based solely on cost without evaluating SLAs and technology capabilities, expanding warehouses without unified WMS integration, starting peak season planning too late (November instead of Q1), underinvesting in demand forecasting, and assuming in-house fulfillment saves money without calculating true total costs including overhead.
The successful transformation pattern from case studies follows a consistent sequence: Our Place expanded from 2 to 4 fulfillment centers and cut delivery times from 5-6 days to 2.5 days while saving $1.5 million annually. Semaine Health scaled from single location to 4 centers, reducing transit time from 5.2 to 3.6 days while saving $2+ per order. Ample Foods added a second center and increased 2-day ground coverage from 32% to 65% of customers while achieving 13% bottom-line savings.
Peak season exposes inventory placement decisions
The peak season stress test reveals whether inventory placement decisions were strategic or reactive. Order volumes spike 300-500% during peak periods, and fulfillment systems either scale gracefully or collapse entirely. The preparation timeline demands attention: optimal planning begins in January for Q4 execution, with late summer representing the latest viable start date. Waiting until November to plan for holiday fulfillment means you’re already too late.
Peak season performance benchmarks set by leading 3PLs in 2025 include 99.975% order accuracy, 87% same-day fulfillment, and 99.9% next-day shipping. Return rates peaked at 17.7% during Christmas and Boxing Week 2024, with over $122 billion in returns processed by the first week of January 2025, creating substantial reverse logistics pressure that compounds placement mistakes. During these periods, last mile delivery becomes critical, as shipping speed and reliability directly impact customer satisfaction. Clear communication with customers about delivery times and shipping costs is essential to reduce uncertainty and build trust. Maintaining relationships with multiple carriers ensures redundancy and flexibility in shipping, helping brands adapt quickly to disruptions and meet delivery promises during peak demand.
The micro-seasonality within Q4 requires granular inventory positioning: October demands Halloween items peaking in final two weeks while early gift-buying begins; November explodes with Black Friday deal-seekers and thoughtful gift selection; December brings urgent purchases with specific delivery deadlines; post-holiday creates returns surge. Each phase stresses inventory placement differently, rewarding brands that pre-positioned inventory based on predictive demand signals rather than reacting to orders as they arrive.
Frequently Asked Questions
Why does inventory placement matter more than carrier selection for fast delivery?
Inventory placement determines the fundamental distance packages must travel, which directly controls both transit time and shipping costs. A package traveling from Los Angeles to Boston cannot reach customers in two days via ground shipping regardless of which carrier you use. However, the same order fulfilled from a Pennsylvania warehouse arrives in Zone 2 transit times at a fraction of the cost. Carrier optimization provides 10-15% savings within a given zone, but proper inventory placement can eliminate 2-3 zones entirely, resulting in 71% faster delivery and dramatically lower costs.
What is the minimum order volume needed to justify multiple fulfillment locations?
Red Stag Fulfillment estimates a minimum of $5 million annual GMV or 50-100+ daily orders before multi-warehouse economics become favorable. Below this threshold, the hidden costs of distributed fulfillment (higher storage rates, safety stock multiplication, inbound freight duplication, technology upgrades, and inventory transfer expenses) typically outweigh the shipping savings. A single warehouse storing 1,000 cubic feet costs $750 monthly, while splitting that inventory across two warehouses can cost $1,275 (70% higher) due to higher per-unit rates and duplicated overhead.
How do I know if my business needs distributed fulfillment or if I’m overpaying for expedited shipping?
Warning signs include expedited shipping consuming more than 15% of your shipping budget, Zone 7-8 shipments representing over 30% of orders, warehouse capacity at 80%+ for three or more consecutive months, and delivery performance slipping despite operational improvements. Calculate the cost: if 20% of your orders require expedited shipping at an $8 premium, that’s $16,000 annually for a 10,000-order business. Compare this against the $30,000-$100,000+ cost of operating a second warehouse. If you’re consistently paying expedited rates to compensate for poor placement, distributed fulfillment likely makes economic sense.
What is ABC-XYZ inventory segmentation and how does it guide warehouse placement decisions?
ABC-XYZ segmentation combines sales velocity with demand predictability to determine optimal inventory placement. “A” items are your top 20% of SKUs generating 80% of revenue and should be placed in multiple fulfillment centers nearest customers. “B” items warrant centralized or limited distribution. “C” items (slow-movers) belong in single locations. The XYZ overlay adds demand predictability: predictable demand (X) allows confident distribution across locations, variable demand (Y) requires safety stock buffers, and unpredictable demand (Z) should remain centralized to reduce risk of stockouts or overstock situations.
How does predictive logistics and AI-powered demand forecasting improve inventory placement?
Geographic-level demand forecasting analyzes patterns at SKU, location, regional, category, and channel levels simultaneously, incorporating geodemographics, regional seasonality, local competition, and weather patterns. Amazon’s anticipatory shipping patent established the framework: inventory is proactively pushed toward geographical areas based on predicted demand. Modern AI implementations demonstrate 20-30% average inventory reduction and 65% reduction in lost sales due to stockouts. One multi-location retailer reduced total network inventory by 18% while improving fill rates from 89% to 96% using predictive placement.
When should I start planning inventory placement for peak season?
Optimal peak season planning begins in January for Q4 execution, with late summer representing the latest viable start date. Order volumes spike 300-500% during peak periods, and waiting until November means you’re already too late. The micro-seasonality within Q4 requires granular positioning: October for Halloween and early gift-buying, November for Black Friday, December for urgent deliveries, and post-holiday for returns processing. Return rates peaked at 17.7% during Christmas 2024 with over $122 billion processed in early January, creating reverse logistics pressure that compounds poor placement decisions made months earlier.
Written By:

Rinaldi Juwono
Rinaldi Juwono leads content and SEO strategy at Cahoot, crafting data-driven insights that help ecommerce brands navigate logistics challenges. He works closely with the product, sales, and operations teams to translate Cahoot’s innovations into actionable strategies merchants can use to grow smarter and leaner.
Turn Returns Into New Revenue
Related Articles
Seller Fulfilled Prime Works — But Only With the Right Operating Model
Seller Fulfilled Prime is attractive for very rational reasons.
SLA Meaning in Logistics: What Service Level Agreements Actually Guarantee (and What They Don’t)
The gap between what 3PL providers promise in SLA marketing (“99.
HTS Code Explained: What It Is, Why It Matters, and How Ecommerce Brands Use It
HTS codes (Harmonized Tariff Schedule codes) are standardized numerical classifications that identify imported products for U.
Shipped vs Delivered: What’s the Difference and Why It Matters in Ecommerce
In this article
19 minutes
- Shipped means the carrier took possession, not that delivery started
- Delivered means the carrier marked their job complete, not that the customer received it
- The journey between shipped and delivered contains multiple status checkpoints
- Customer confusion stems from misaligned expectations about timing and responsibility
- Operational implications affect support volume, returns, and customer satisfaction
- Strategic approaches treat status updates as signals requiring operational response
- Frequently Asked Questions
“Shipped” and “delivered” are carrier status updates, not customer truth. Most customer support tickets and delivery frustration happen when brands treat these scan events as definitive outcomes instead of probabilistic signals in the shipping process. ‘Shipped’ and ‘delivered’ have different meanings in the logistics process, each representing a distinct stage in the journey of a package. A package marked “shipped” simply means a carrier scanned a barcode confirming they took possession of it. A package marked “delivered” means a carrier scanned a barcode indicating they completed their final delivery attempt. Neither status guarantees the customer actually has the product in hand, and the gap between these two events creates the majority of post-purchase anxiety and operational complexity for ecommerce brands.
For mid-market Shopify brands processing hundreds or thousands of orders monthly, understanding this distinction directly impacts customer support volume, return rates, and operational efficiency. Customers often assume ‘shipped’ and ‘delivered’ are interchangeable terms, which leads to misunderstandings about order status and timeline expectations. Industry data shows that delivery-related inquiries account for 30-40% of all customer support tickets, with the majority stemming from confusion about what order fulfillment “shipped” and “delivered” actually mean versus what customers expect them to mean.
Shipped means the carrier took possession, not that delivery started
When a package status changes to “shipped,” it indicates that a carrier has scanned the tracking barcode and accepted responsibility for the shipment. Shipping refers to the process of sending items from the seller to the customer, including packaging, dispatch, and transit. This scan typically happens at one of several points: when the carrier picks up packages from the warehouse or fulfillment center, when packages arrive at the carrier’s first sorting facility, or when packages are loaded onto a delivery vehicle for the first leg of transit.
The shipping process begins much earlier than this scan event. It starts when warehouse staff pick items from inventory, pack them into shipping containers, apply shipping labels with tracking numbers, and stage packages for carrier pickup. The shipping process can start even before payment is finalized, as it includes planning based on delivery date options. Often, the process begins at the supplier’s warehouse, and if the supplier’s warehouse is local to the customer, the shipping process is more straightforward. From an operational perspective, orders transition to “fulfilled” status when labels are created, but customers don’t receive shipping notifications until the carrier’s first scan confirms physical possession. Many e-commerce businesses dispatch orders within four business days after shoppers place their orders.
This creates the first source of confusion. Customers receiving a “shipped” notification often assume their package is actively moving toward them. In reality, packages frequently sit at carrier facilities for 12-48 hours between the initial “shipped” scan and meaningful transit progress. Weekend and holiday timing compounds this gap, as packages picked up Friday afternoon may not show movement until Monday or Tuesday. The shipping date, which is when the product leaves the supplier’s warehouse, is important to distinguish from the delivery date, as it helps set accurate customer expectations.
The shipped status also doesn’t indicate which delivery method is being used or where the package currently sits in the carrier network. There are various shipping methods, such as air freight, cargo ships, trains, and trucks, each affecting delivery speed and costs. Air freight is often used for fast international shipments. Shipping small items is typically handled by the local postal service and post office, while larger items may require freight carriers. A package shipped via ground service might take 5-7 business days to reach its destination, while expedited service could deliver in 1-2 days. Shipping charges can vary depending on the method chosen. Both show identical “shipped” status immediately after carrier acceptance, creating misaligned expectations when customers don’t understand the selected shipping method. The shipping timeline, or the expected period from order dispatch to delivery, is usually communicated to customers to help manage these expectations.
For ecommerce operations, the shipped scan serves as confirmation that liability transferred from the brand to the carrier. Before this scan, lost or damaged packages remain the seller’s responsibility. After the scan, claims must go through carrier insurance or reimbursement processes. This legal and financial distinction matters more to operations teams than customers, who simply want to know when their order will arrive. The process involved in shipping includes everything from the moment shoppers place their order, through order processing, packaging, carrier pickup, and handoff to the local postal service or post office for final delivery.
Let AI Optimize Your Shipping and Boost Profits
Cahoot.ai software selects the best shipping option for every order—saving you time and money automatically. No Human Required.
See AI in ActionDelivered means the carrier marked their job complete, not that the customer received it
When tracking shows “delivered,” it means a carrier scanned the package as successfully delivered to the specified address. Delivery refers to the process of transferring the package from the carrier to the recipient, including the estimated shipment date, actual arrival date, and any associated delivery charges. This scan happens when the delivery driver completes what they consider a successful delivery attempt: leaving the package at the customer’s doorstep, handing it to someone at the address, placing it in a mailbox or parcel locker, or completing delivery to a building’s mail room or front desk.
The delivered scan does not verify that the intended recipient actually received the package. It confirms only that the carrier followed their delivery protocol for that address type. For residential deliveries, this typically means leaving the package at the front door, side entrance, or garage. For apartment buildings, delivery might mean the lobby, mailroom, or package room. For businesses, it could mean reception, loading dock, or mail room. The delivery company is responsible for the final leg of the journey, ensuring the package reaches the customer’s home.
This gap between “delivered per carrier protocol” and “received by customer” creates the second major source of confusion and support tickets. Common scenarios where delivered status doesn’t match customer reality include packages left at incorrect addresses due to driver error, packages stolen after delivery (porch piracy), packages delivered to building common areas where the customer doesn’t check, packages marked delivered but actually still on the truck (premature scanning), and packages delivered to neighbors when the primary address isn’t accessible.
Industry research indicates that 1.7 million packages are stolen or lost daily in the United States, with theft occurring after the delivered scan in the majority of cases. From the carrier’s perspective, these shipments completed successfully. From the customer’s perspective, they never received their order. This creates a liability and resolution gap that falls on the ecommerce brand to manage.
The delivered scan also doesn’t account for delivery quality. Packages thrown over fences, left in rain without protection, or placed where they’re easily visible to thieves all receive the same “delivered” status as carefully placed, protected deliveries. Delivery service options, such as white glove delivery for major appliances, can help ensure a higher quality experience. Examples of major appliances include refrigerators, washing machines, and stoves, which often require specialized delivery service. Some deliveries, especially for large items, require installation upon arrival. Carriers optimize for scan completion rates and deliveries per hour, not for delivery experience quality.
For operations teams, delivered status triggers automated systems: order completion emails, review request campaigns, potential reorder marketing, and closure of the order in fulfillment systems. When customers haven’t actually received packages marked delivered, these automated touchpoints generate negative brand experiences and support ticket escalations. Delivery charges can vary based on distance and service level. Delivery is the final stage in the supply chain when a shipped item arrives at its final destination.
The journey between shipped and delivered contains multiple status checkpoints
Between the initial shipped scan and final delivered scan, packages move through a series of carrier facilities and status updates. The delivery process starts at a local warehouse or distribution center where the final delivery is scheduled. Understanding these intermediate stages helps operations teams set accurate customer expectations and diagnose delivery issues.
In transit status appears when packages move between carrier facilities. This indicates active movement through the logistics network but provides limited specificity about location or progress. Packages might show “in transit” for 2-3 days while moving across the country, or for 6-8 hours while moving between local facilities.
Out for delivery means the package loaded onto a delivery vehicle and is scheduled for delivery that day. At this point, the package is en route to the recipient, indicating it is in the final phase of the delivery process. This status typically appears early morning when drivers load trucks, though actual delivery might happen anytime during the driver’s route (often 8am to 8pm). Customers seeing this status often expect delivery within hours, but afternoon and evening deliveries are common.
Delivery attempted indicates the driver tried to deliver but couldn’t complete delivery for some reason: no one available to sign for signature-required packages, access issues at gated communities or locked buildings, or address problems preventing the driver from locating the delivery point. After delivery attempts, packages typically return to local facilities for redelivery the next business day.
Exception or delay statuses signal problems: weather disruptions, transportation issues, incorrect address information, or damaged package labels. These statuses often lack specificity about the actual problem or when resolution might occur, creating customer anxiety and support inquiries.
Arriving late notifications appear when carriers detect packages won’t meet original delivery estimates. These preemptive updates help manage expectations but often arrive too late to prevent customer concern, particularly for time-sensitive orders like gifts or event-related purchases.
Each status transition represents a physical scan event by carrier personnel or automated scanning systems. The last scan event represents the final stage of the delivery process, marking the completion of the package’s journey to its destination. Scan reliability varies by facility, shift, and carrier workload. During peak seasons, scan compliance can drop, leading to packages that move through the network without status updates, creating the appearance that shipments stalled when they’re actually progressing normally.
Providing clear delivery tracking information to customers is essential, as it helps them understand the shipping and delivery process and improves transparency about when their order will arrive.
ShipStation vs. Cahoot: 21x Faster, Real Results
Get the inside scoop on how a leading merchant switched from ShipStation to Cahoot—and what happened next. See it to believe it!
See the 21x DifferenceCustomer confusion stems from misaligned expectations about timing and responsibility
The most common customer misunderstanding treats “shipped” as synonymous with “on the way to me right now.” Customers expect immediate transit progress after shipping notifications, not recognizing that first-mile pickup, sorting, and network injection can take 1-3 days before meaningful movement occurs. This expectation gap generates “where is my order” tickets within 24-48 hours of shipping notifications. Providing clear communication and tracking can make the process simpler for customers and help reduce confusion about shipping and delivery terms.
The second major confusion point occurs when delivered status doesn’t match physical receipt. Customers checking tracking see “delivered” but don’t have packages, leading to immediate support contacts. Operations teams must then diagnose whether the issue is theft, misdelivery, delivery to alternate location (neighbor, building office), or premature scanning where the package will arrive later that day.
Estimated delivery dates compound confusion when they’re treated as guarantees rather than projections. Carriers provide delivery windows based on service level and distance, but weather, volume surges, and operational disruptions regularly push deliveries beyond estimates. Accurate delivery times are crucial for managing customer expectations and preventing misunderstandings. Customers viewing estimates as commitments create support volume when actual delivery falls on the later end of projected windows.
The responsibility boundary between carrier and seller creates additional friction. Customers reasonably believe they purchased from the brand, not from the carrier, and expect the brand to resolve delivery issues regardless of where fault lies. From an operations perspective, issues after the carrier’s first scan fall under carrier responsibility, requiring brands to file claims, request investigations, or seek reimbursement rather than simply reshipping. Providing two dates—the shipping date and the delivery date—can improve clarity and help set realistic expectations for customers. The delivery date is especially important as it represents the final step in the shipping process and is often communicated after the item has been dispatched.
Carrier communication quality varies significantly. Some carriers provide detailed tracking with facility-level updates and realistic delivery windows. Others offer minimal information with vague status descriptions. Brands using multiple carriers create inconsistent customer experiences where tracking quality depends on which carrier handled the shipment, a variable customers don’t control or understand.
Operational implications affect support volume, returns, and customer satisfaction
Customer support teams spend disproportionate time on delivery-related inquiries despite having limited ability to influence carrier performance. Support ticket analysis across ecommerce brands shows 30-40% of contacts relate to shipping and delivery, with common inquiries including “where is my package” after shipped notifications, “tracking says delivered but I don’t have it” scenarios, “why hasn’t my package moved in 3 days” during transit gaps, and “will my package arrive by [date]” for time-sensitive orders. In e-commerce, especially for an e commerce business, efficient shipping and delivery processes are crucial for maintaining customer satisfaction and operational efficiency.
Each inquiry requires support time to investigate tracking, contact carriers, and manage customer expectations, often without ability to actually accelerate delivery. Brands typically implement policies for delivery issues: immediate replacement shipment for packages showing no movement for 7-10 days, replacement or refund for packages marked delivered but not received after 48-72 hours, carrier claims for lost or damaged shipments when tracking confirms issues, and proactive refunds or replacements for packages showing repeated delivery exceptions. The supply chain plays a vital role in managing these shipping and delivery processes, ensuring goods move efficiently from warehouses to customers. Shipping and delivery processes can involve complex logistics, especially for cross-border shipments, which can further complicate support and resolution.
These policies create cost exposure. Reshipping products for carrier failures, processing refunds for delivered-but-not-received packages, and writing off lost inventory when carrier claims don’t cover full value all flow to the brand’s P&L. High-volume brands can see delivery-related costs (replacements, refunds, support labor) reach 2-5% of revenue, with higher percentages during peak seasons when carrier performance degrades. In fulfillment models like drop shipping, where sellers do not hold inventory and rely on third-party suppliers to ship directly to customers, delivery timelines and control can be affected, sometimes leading to a negative customer experience due to limited oversight and potential quality issues.
Returns and exchanges also intersect with shipped versus delivered confusion. Customers who receive damaged products or wrong items often check tracking to understand when the issue might have occurred. “Delivered” status provides no information about package condition, leading customers to assume delivery damage rather than warehouse picking errors or packing problems. This misattribution can lead to carrier claims for issues that originated before shipping.
Customer lifetime value takes hits from poor delivery experiences even when the brand executed perfectly. Research consistently shows that delivery experience significantly influences repeat purchase likelihood and brand perception. Customers experiencing delivery problems often reduce purchase frequency or switch to competitors offering more reliable delivery options, even when delivery failure wasn’t the original brand’s fault.
Proactive communication reduces support volume but requires operational investment. Brands implementing order tracking pages, SMS delivery notifications, and proactive delay alerts see 15-25% reductions in delivery-related tickets. However, these systems require integration with carrier APIs, real-time data synchronization, and thoughtful customer communication design to avoid creating more confusion through excessive notifications.
Cut Costs with the Smartest Shipping On the Market
Guranteed Savings on EVERY shipment with Cahoot's AI-powered rate shopping and humanless label generation. Even for your complex orders.
Cut Costs TodayStrategic approaches treat status updates as signals requiring operational response
Operations leaders at high-performing ecommerce brands shift from reactive delivery problem management to proactive delivery experience design. This starts with carrier performance monitoring: tracking delivery success rates, average transit times by service level and destination zone, exception rates and common exception types, and scan reliability throughout the carrier network. In the context of shipping vs delivery, it’s important to clarify that shipping refers to the process of moving a package from the seller to the carrier, while delivery is the final handover to the customer.
This data informs carrier selection and service level decisions. Brands shipping to similar destination zones repeatedly can analyze which carriers consistently deliver faster or more reliably to those areas. Service level choices (ground versus expedited) can be optimized by calculating whether faster delivery costs justify reduced support tickets and higher customer satisfaction scores. The difference between shipping and delivery is crucial here: shipping is the stage where the package leaves the seller and enters the carrier’s network, while delivery is the stage where the package reaches the customer’s address. For brands looking to streamline these processes, national fulfillment services can play a key role in improving efficiency and reducing costs.
Address validation and delivery instruction capture at checkout prevent many delivery issues. Implementing address verification services that flag incorrect addresses, collecting delivery preferences (safe place to leave packages, gate codes, access instructions), and offering alternative delivery locations (package lockers, retail pickup points) give customers control over delivery outcomes.
Post-delivery verification provides certainty about delivery completion. Photo confirmation of delivered packages (many carriers now offer this), signature requirements for high-value items, and delivery confirmation emails with specific delivery location details reduce “delivered but not received” disputes. However, these features often cost extra or slow delivery, requiring cost-benefit analysis.
Strategic inventory positioning reduces transit time and delivery uncertainty. Brands using distributed fulfillment networks (multiple warehouse locations) can ship from facilities closer to customers, reducing average transit times from 4-6 days to 1-3 days. Shorter transit windows mean fewer days where packages can encounter problems and less time for customer anxiety to build.
Customer communication frameworks acknowledge uncertainty rather than creating false precision. Instead of promising specific delivery dates, communicate delivery windows. Instead of treating shipped status as definitive progress, explain that initial processing takes 1-2 days. Instead of deflecting delivery problems to carriers, own the customer relationship and resolve issues regardless of technical responsibility. This customer-centric approach builds trust even when delivery experiences fall short. Historically, these terms originally referred to different parts of the logistics process, with ‘shipping’ describing the dispatching of goods and ‘delivery’ referring to the final distribution to the recipient.
Frequently Asked Questions
What does “shipped” actually mean when I see it in order tracking?
“Shipped” means a carrier has scanned your package’s tracking barcode and taken possession of it from the warehouse or fulfillment center. This is the carrier’s confirmation that they have your package and accepted responsibility for delivery. However, shipped status doesn’t mean the package is actively moving toward you yet. Packages often sit at carrier facilities for 12-48 hours after the initial shipped scan while being sorted and routed through the logistics network. The shipped status also doesn’t indicate which shipping method was used or when delivery will occur.
What does “delivered” mean and why might I not have received my package?
“Delivered” means a carrier scanned the package as successfully delivered to your address according to their delivery protocol. This typically means leaving the package at your doorstep, handing it to someone at the address, or placing it in a mailbox or building mail room. However, delivered status doesn’t verify that you personally received the package. Common situations where tracking shows delivered but you don’t have the package include theft after delivery, delivery to the wrong address, delivery to neighbors or building common areas, premature scanning where the package arrives later that day, or placement in locations you don’t regularly check.
How long does it typically take between “shipped” and “delivered” status?
Transit time between shipped and delivered depends on the shipping method and distance. Ground shipping typically takes 3-7 business days, expedited shipping takes 1-3 business days, and overnight shipping delivers the next business day. However, the first 1-2 days after shipped status often show little tracking progress as packages move through initial carrier sorting facilities. Weekend and holiday timing can extend these windows by 2-3 days since most carriers don’t deliver on Sundays or holidays. Peak seasons like November and December often add 1-2 days to normal transit times due to increased package volume.
What should I do if tracking says delivered but I don’t have my package?
First, check all possible delivery locations including side doors, garages, mailboxes, and building mail rooms or package rooms. Ask neighbors if they accepted delivery on your behalf. Wait 24-48 hours as premature scanning sometimes occurs where tracking updates before actual delivery. Contact the carrier directly to request delivery confirmation details including specific delivery location and time. If these steps don’t locate the package, contact the seller to report a delivered-but-not-received issue. Most ecommerce brands will replace or refund orders when tracking shows delivered but customers confirm non-receipt, typically after a 48-72 hour investigation window.
Why does my package tracking show “in transit” for days without updates?
Packages showing prolonged “in transit” status without updates usually indicate one of several situations. The package is moving between carrier facilities without intermediate scans, particularly common on long-distance shipments. Scan compliance issues mean facility workers didn’t scan packages at expected checkpoints. Weather or transportation disruptions delayed movement but carriers haven’t updated status to reflect delays. Weekend or holiday timing creates gaps since tracking doesn’t update during non-business days. Peak season volume overwhelms carrier scanning systems. If tracking shows no updates for 5-7 days, contact the carrier or seller for investigation as the package may be lost or misrouted.
Who is responsible when delivery problems occur?
Responsibility depends on when and where the problem occurs. Before the carrier’s first scan (shipped status), the seller is responsible for lost or damaged packages. After shipped status, carriers hold legal responsibility for lost, damaged, or delayed packages according to their service agreements. However, from a customer perspective, you purchased from the seller, not the carrier. Most reputable ecommerce brands will resolve delivery issues regardless of technical responsibility by reshipping products, processing refunds, or filing carrier claims on your behalf. Contact the seller first for fastest resolution rather than trying to navigate carrier claim processes directly.
Written By:
Indy Pereira
Indy Pereira helps ecommerce brands optimize their shipping and fulfillment with Cahoot’s technology. With a background in both sales and people operations, she bridges customer needs with strategic solutions that drive growth. Indy works closely with merchants every day and brings real-world insight into what makes logistics efficient and scalable.
Turn Returns Into New Revenue
Related Articles
Seller Fulfilled Prime Works — But Only With the Right Operating Model
Seller Fulfilled Prime is attractive for very rational reasons.
SLA Meaning in Logistics: What Service Level Agreements Actually Guarantee (and What They Don’t)
The gap between what 3PL providers promise in SLA marketing (“99.
HTS Code Explained: What It Is, Why It Matters, and How Ecommerce Brands Use It
HTS codes (Harmonized Tariff Schedule codes) are standardized numerical classifications that identify imported products for U.
Why Returns Management Is Becoming a Strategic Capability in 2026
In this article
25 minutes
- Why returns were treated as a necessary evil
- What changed going into 2026
- Visibility isn't the same as recovery
- Restocking speed is the new KPI
- The hidden cost of traditional reverse logistics
- Customer initiates the return: the new first impression
- Customer resolution and support: turning returns into loyalty
- Reducing fraudulent returns in a digital-first era
- What a strategic returns management process actually looks like
- Technology’s role in next-generation returns management
- Continuous improvement: building a future-proof returns operation
- Why customer satisfaction will separate winners from everyone else
- Frequently Asked Questions
In 2026, product returns management is no longer just about processing refunds. As margins tighten and volumes rise, the ability to restock faster, recover inventory value, and reduce waste is becoming a strategic capability. Most returns platforms optimize for visibility and convenience, but brands that optimize for recovery are gaining a measurable advantage. The National Retail Federation projects $850 billion in merchandise returns for 2025, representing nearly one-quarter of all online sales. In 2023 alone, consumers returned retail purchases worth $743 billion, about 14.5% of all sales, highlighting the massive scale and complexity of ecommerce returns. For ecommerce operators, the question has shifted from “how do we make returns convenient” to “how do we turn returned inventory back into sellable stock before it loses value.”
To address rising return volumes and evolving customer expectations, businesses need a comprehensive returns strategy and an effective returns management strategy that covers logistics, inventory management, and customer support. This distinction matters because the operational gap between processing a return and recovering its value determines whether returns function as a controllable cost or an uncontrolled margin drain. Operations leaders and ecommerce founders who recognize this difference are restructuring reverse logistics around recovery speed, not just customer satisfaction scores. A positive returns experience can also drive future growth—70% of North American consumers say they purchased more from a retailer after a good return experience, underscoring the importance of meeting or exceeding customer expectations.
Why returns were treated as a necessary evil
For most of ecommerce’s history, the customer returns process existed as a customer experience function. The logic was straightforward: online shopping required trust, and generous return policies built that trust. Amazon normalized free returns, Zappos built its brand on hassle-free exchanges, and the entire industry converged on the idea that friction-free returns were table stakes for customer acquisition and retention.
This framing positioned returns as a cost of doing business in the service of customer loyalty. Retailers invested in return portals, prepaid labels, extended windows, and streamlined refund processing. Clear, transparent policies reduce friction in the returns process, making them easy to find and understand, which is essential for a positive customer experience. The operational goal was speed to refund, not speed to recovery. Processing returns meant getting money back to customers quickly to preserve satisfaction scores and avoid chargebacks.
The underlying economics were tolerable when margins were healthier and return volumes were lower. Ecommerce return rates hovered around 15-20% industry-wide, concentrated in specific categories like apparel and footwear where fit issues drove predictable return patterns. Accurate product information, including comprehensive descriptions and high-resolution images, helps prevent returns due to mismatches in these categories. Brands absorbed the cost as customer acquisition expense, measuring success through Net Promoter Scores and repeat purchase rates rather than inventory recovery metrics.
Warehouse operations reflected these priorities. Returned products entered the same receiving queues as new inventory, got triaged when capacity allowed, and often sat in holding areas waiting for inspection and disposition decisions. The focus was compliance (did we issue the refund within policy?) rather than velocity (how fast can we get this back on the virtual shelf?). For many operations, a two-week return processing cycle seemed acceptable if customer-facing resolution happened in 48 hours.
What changed going into 2026
Multiple structural forces converged to make this approach unsustainable. Return volumes accelerated beyond historical norms, with online sales now experiencing 24.5% return rates compared to 8.9% for physical retail. The gap reflects fundamental differences in purchase behavior when customers can’t touch, try, or examine products before buying. Categories like fashion see returns reaching 30-40%, while electronics, home goods, and beauty products all trend above 20%. These high return rates present unique challenges for ecommerce businesses, requiring tailored returns management strategies to address the specific difficulties of online retail.
Margin pressure intensified across ecommerce. Digital customer acquisition costs rose 222% between 2013 and 2024, climbing from roughly $9 to $29 per customer. Simultaneously, carriers implemented 5.9% rate increases in 2024 with additional surcharges for peak seasons, rural delivery, and oversized packages. Brands operating on 30-40% gross margins discovered that absorbing both outbound and return shipping costs on a 25% return rate left little room for profitability. Operational inefficiencies, especially those caused by manual or outdated returns processes, further erode margins by introducing delays and errors in returns management and inventory updates.
The resale and recommerce market matured into a $200+ billion global industry, creating new expectations around product lifecycle value. Customers increasingly view returns not as failures but as part of normal shopping behavior, with 67% of online shoppers checking return policies before making purchase decisions. This normalization increased return frequency while simultaneously raising the stakes for recovery, as competitors with faster restocking could capture secondary sales that slower operators missed. Analyzing return reasons is now critical—collecting and reviewing data on why items are returned helps identify common causes such as sizing issues, product quality, and wrong items sent. High return rates are often driven by these factors, as well as poor product descriptions, making it essential for brands to address them to reduce returns and improve customer satisfaction.
Sustainability scrutiny added regulatory and reputational pressure. An estimated 5.8 billion pounds of returned goods end up in landfills annually in the U.S. alone, with some estimates suggesting that up to 25% of returns are ultimately destroyed rather than resold. Brands facing Extended Producer Responsibility legislation in Europe and increasing consumer activism around waste found that returns management directly impacted environmental commitments and public perception.
The emergence of AI shopping agents introduced a new dynamic. As automated purchasing tools evaluate inventory availability in real-time, returned items sitting in processing limbo represent invisible stockouts. Products marked as available but actually tied up in reverse logistics create failed purchase attempts when agents try to complete transactions. This means slow returns processing now directly impacts future conversion, not just current customer satisfaction.
Make Returns Profitable, Yes!
Cut shipping and processing costs by 70% with our patented peer-to-peer returns solution. 4x faster than traditional returns.
See How It WorksVisibility isn’t the same as recovery
The returns management software market responded to growing complexity with dashboards, analytics, and process automation. However, an efficient returns management process requires more than just visibility; it transforms returns from a challenge into an opportunity by protecting profit margins and enhancing customer trust. Most platforms focus on visibility: tracking return requests, monitoring refund timing, analyzing return reasons, and providing customers with status updates. This creates the appearance of control without necessarily improving the underlying economic outcome.
A returns management system, as a comprehensive, cloud-based software solution, automates key tasks throughout the returns process—from authorization to inventory updates and customer notifications—enhancing efficiency, data analysis, and integration with other logistics and warehouse management systems. Implementing returns management software automates tasks such as generating return labels and processing refunds, increasing speed and accuracy. Automating returns also involves using software for return authorization, tracking, and initial inspection validation, which streamlines the process and reduces manual errors. Keeping customers updated on their return status is crucial for effective communication and maintaining customer trust.
Visibility tells you that 3,000 units are in return transit. Recovery gets those units back into sellable inventory within 72 hours. Visibility shows you that apparel returns average 35%. Recovery reduces the time between customer return initiation and product availability from 14 days to 3 days. Visibility provides a dashboard showing return reasons. Recovery implements disposition logic that routes items directly to the right endpoint (restock, outlet, liquidation, disposal) without manual intervention.
The distinction matters because time is the enemy of inventory value. Research from the reverse logistics industry shows that products lose approximately 1-2% of value per week they spend in return processing. A $100 item returned in Week 1 might restock at full price. The same item processed in Week 8 may require a 15-20% markdown to clear. For fashion and seasonal goods, this depreciation accelerates dramatically as trends shift and seasons change.
Processing speed also determines working capital efficiency. When $500,000 in inventory sits in return processing for two weeks, that capital is neither generating revenue nor available for reinvestment. For brands operating on tight cash cycles, the difference between 3-day and 14-day return processing can determine whether they have budget to restock bestsellers or run out of cash before the next sales cycle.
Current returns platforms typically optimize for metrics that don’t correlate with recovery value: customer satisfaction with the return experience (95%+ regardless of restocking speed), refund processing time (usually 2-5 days, independent of inventory recovery), return request completion rate (measures portal functionality, not operational outcome), and return reason analytics (useful for product improvement but disconnected from reverse logistics velocity).
Recovery-focused metrics look different: median time from customer handoff to inventory availability (measures full-cycle speed), percentage of returns restocked at full value versus marked down (measures value preservation), inventory availability impact from in-process returns (measures opportunity cost), and working capital tied up in reverse logistics at any given time (measures financial efficiency).
Restocking speed is the new KPI
Return authorization is the first step in the returns process, where the customer initiates the return request. The operational reality of returns creates a hidden constraint on inventory availability. When a customer returns a product, it typically enters a multi-stage process: after return authorization, the return shipment is sent as the customer ships the item back to the returns center. Once the product arrives at the warehouse, it is received and checked in. At this point, the item undergoes a thorough inspection and quality control to ensure it meets standards and to prevent fraudulent returns or restocking of damaged goods. The disposition decision then determines the next step (restock, repair, liquidate, dispose), and finally, approved items get added back to available inventory. The need to ship the product back to the business after authorization adds to the cost and time associated with returns.
Industry data shows this process averages 10-14 days for most ecommerce operations, with many taking 3-4 weeks during peak seasons. For high-velocity SKUs, this creates a perpetual availability gap. A product selling 100 units weekly with a 25% return rate has 25 units constantly in reverse logistics limbo. If processing takes two weeks, that’s 50 units of phantom inventory, equivalent to 3.5 days of lost sales.
This compounds during peak seasons when both sales and returns spike simultaneously. Holiday 2024 data showed return rates surging from 17.6% to 20.4% during peak periods, with processing backlogs extending to 30+ days at some operations. Brands that couldn’t clear this backlog entered January with their bestselling items showing as out-of-stock despite warehouses full of returned inventory awaiting processing.
The competitive advantage of speed becomes clear in marketplace dynamics. On Amazon, products experiencing stockouts lose organic ranking by 30-50% after just 7 days, requiring 3-4 weeks of consistent availability to recover. A brand that restocks returns in 3 days maintains continuous availability and ranking. A competitor taking 14 days experiences repeated micro-stockouts that trigger algorithmic penalties, requiring higher advertising spend to maintain visibility.
The math scales with volume. A brand processing 10,000 returns monthly at $75 average order value has $750,000 in inventory circulating through reverse logistics at any given time. Cutting processing time from 14 days to 5 days frees up approximately $480,000 in working capital while simultaneously improving availability across the catalog. For brands operating on tight margins, this capital efficiency directly determines growth capacity.
Restocking speed also impacts the ability to fulfill new orders from existing inventory. Distributed Order Management systems can’t route orders to inventory that’s physically present but systemically unavailable due to return processing status. This forces brands to carry higher safety stock to buffer against the availability gap created by slow reverse logistics, increasing storage costs and inventory carrying costs.
The hidden cost of traditional reverse logistics
Standard warehouse operations treat returns as a secondary priority behind outbound fulfillment. This makes operational sense when measured by revenue per labor hour (outbound generates revenue, returns represent costs), but it creates systematic delays that quietly erode profitability and disrupt the overall supply chain.
Returned items typically arrive at the same receiving dock as new inventory. During high-volume periods, they wait in queues behind vendor deliveries and FBA shipments. Once received, returns enter holding areas awaiting quality inspection. Inspection teams work through backlogs based on available capacity, which shrinks during peak seasons when warehouses prioritize pick, pack, and ship operations. Items requiring cleaning, minor repair, or repackaging wait for these services to be performed. Disposition decisions often require manual review and approval, creating bottlenecks when operations managers are focused on outbound performance.
This structure creates a predictable failure mode during growth phases. As sales volume increases, warehouse capacity gets consumed by outbound operations. Return processing teams get pulled to help with fulfillment. The return queue grows longer, processing times extend, and the percentage of returns ultimately marked down or liquidated increases because products age out of full-price sellability while sitting in processing.
The financial impact manifests in several ways. Markdown costs average 15-30% of original value for products that can’t be restocked at full price. Liquidation channels typically recover 10-25% of retail value. Disposal costs range from $5-15 per unit depending on product category and disposal method. Storage costs accumulate at roughly $5-8 per cubic foot monthly for inventory sitting in return processing areas.
Labor inefficiency compounds these costs. Traditional return processing requires manual inspection of each item, individual disposition decisions, separate workflows for different return reasons, and manual data entry to update inventory systems. This manual approach increases the risk of human error, leading to mistakes in processing and inventory records. Automation and technological tools can help reduce human error, resulting in more efficient and accurate returns management. Industry benchmarks show that processing a single return can consume 15-30 minutes of labor time depending on product complexity. At $20/hour fully loaded labor costs, that’s $5-10 per return in processing expense before accounting for any markdown or liquidation losses.
Quality control failures create additional exposure. Items restocked without proper inspection may get returned again, doubling reverse logistics costs. Products with defects that slip through inspection and get resold generate negative reviews that impact future conversion. Missing or damaged items create customer service escalations and potential fraud losses. Achieving operational excellence in returns management requires robust quality control and process improvement to minimize these risks. Implementing a system for inspecting and evaluating returned products, along with a clear and well-defined returns management process, can help verify the authenticity of returns and reduce return fraud. The industry estimates that fraudulent returns (returning used, damaged, or counterfeit items) account for 5-10% of all returns, representing tens of billions in annual losses.
Convert Returns Into New Sales and Profits
Our peer-to-peer returns system instantly resells returned items—no warehouse processing, and get paid before you refund.
I'm Interested in Peer-to-Peer ReturnsCustomer initiates the return: the new first impression
When a customer initiates a return, it marks the beginning of the returns management process—and sets the stage for the entire customer experience. This initial step is more than just a transaction; it’s a critical moment that can shape customer satisfaction and influence future loyalty. A well-designed returns process, with clear instructions and transparent policies, reassures customers that their concerns will be addressed efficiently. By providing customers with straightforward return options and proactive communication, businesses can transform a potentially negative situation into a positive one. This approach not only resolves immediate issues but also demonstrates a commitment to customer care, turning the returns process into an opportunity to build trust and foster long-term customer loyalty.
Customer resolution and support: turning returns into loyalty
Delivering effective customer resolution and support is essential for a successful returns management process. When customers reach out with a return, they expect responsive, empathetic service that addresses their needs quickly. By offering flexible solutions such as store credit or easy exchanges, businesses can encourage customers to remain engaged, even after a return. Implementing returns management best practices—like timely communication, clear status updates, and personalized support—ensures operational efficiency and reinforces customer satisfaction. Additionally, gathering and acting on customer feedback allows companies to continuously refine their returns management strategy, turning each return into a chance to strengthen relationships and drive repeat business.
Reducing fraudulent returns in a digital-first era
Fraudulent returns have become a significant challenge for online retailers, especially as ecommerce continues to grow. To protect both margins and customer trust, businesses must leverage return data and advanced analytics to identify suspicious patterns and prevent abuse. Implementing robust verification steps—such as tracking return histories, flagging high-risk transactions, and using AI-driven fraud detection—can help reduce the incidence of fraudulent returns. Transparent communication about return policies and the consequences of dishonest behavior further discourages abuse, while maintaining a fair and respectful environment for genuine customers. By proactively addressing fraudulent returns, companies can safeguard their operations and uphold the integrity of their returns management process.
What a strategic returns management process actually looks like
Returns management focuses on a comprehensive approach that prioritizes both customer experience and operational efficiency, ensuring that every aspect of the returns process is optimized for satisfaction and business outcomes. Recovery-focused returns management starts with a fundamental reframing: returned inventory is an asset to be recovered, not a problem to be processed. This shifts operational priorities from customer service metrics to economic outcomes, and highlights the importance of forward logistics in integrating inventory management and customer service to streamline the return process and product reintegration.
The first element is speed-optimized routing. Rather than sending all returns to a central warehouse where they compete for attention with outbound operations, strategic operators route returns to facilities with dedicated reverse logistics capacity. This might mean regional return centers near major population clusters, partnerships with 3PLs specializing in return processing, or in some cases, leveraging distributed networks where returns can be inspected and restocked at the nearest location to where they’ll be resold. As a business grows, managing returns and logistics becomes increasingly complex, often requiring specialized vendors or third-party logistics providers to handle scaling operations efficiently.
Disposition automation eliminates the manual review bottleneck. Rule-based systems can make instant decisions on straightforward cases: unopened items in original packaging auto-approve for full-price restock, minor wear items route to outlet channels, products with specific defect types go to repair partners, and SKUs below minimum resale value route directly to liquidation. This reduces manual touches from 100% of returns to perhaps 15-20% of edge cases requiring human judgment. Automation and process improvements like these help reduce costs by streamlining workflows and minimizing manual intervention.
Parallel processing replaces sequential workflows. Traditional operations inspect items, then make disposition decisions, then execute the chosen action. Strategic operators inspect, photograph, and process items simultaneously, updating inventory systems in real-time as products move through quality control. This collapses multi-day processes into same-day cycles and helps transform returns from a challenge into a strategic advantage by improving customer experience, optimizing operations, and gaining a competitive edge.
Value preservation becomes an explicit goal. This means implementing cleaning and refurbishment capabilities for products that can be restored to full-price condition, maintaining relationships with multiple liquidation channels to ensure competitive bids on items that can’t be restocked, and tracking which return reasons correlate with successful full-price restocking versus markdowns (to identify product quality issues or listing problems that can be fixed). Effective strategies for managing product returns involve proactive prevention, clear policies, automation, technology use, data analysis, and excellent customer communication. Reducing unnecessary returns through customer education and accurate product information is also crucial for operational efficiency and cost reduction. For example, improving product listings with high-quality images, detailed descriptions, accurate sizing, and materials helps set correct expectations and prevent avoidable returns. Additionally, virtual try on tools can reduce return rates by enabling customers to better visualize products and make more accurate purchase decisions.
Working capital metrics get tracked with the same rigor as customer satisfaction scores. Strategic operators monitor total inventory value in reverse logistics, average processing cycle time by category, percentage of returns restocked at full value, and days of sales lost due to return processing delays. These metrics get reviewed in the same operational meetings where outbound fulfillment performance is discussed. Regularly analyzing returns data helps identify trends and issues that inform future improvements.
Cross-functional coordination treats returns as a full-lifecycle concern. Product teams receive feedback on which items generate high return rates or fail quality inspection. Marketing teams factor return rates and processing speeds into promotional planning. Finance teams incorporate return processing efficiency into margin analysis and cash flow forecasting. Warehouse operations receive clear SLAs for return processing speed, not just accuracy.
Technology integration enables visibility and execution simultaneously. Systems that connect return portals, warehouse management systems, inventory management platforms, and ecommerce backends ensure that restocked items become available for purchase the moment they’re approved for restock, rather than waiting for batch updates or manual data entry.
Technology’s role in next-generation returns management
Modern returns management is powered by technology that streamlines every stage of the returns process, from return initiation to final resolution. Integrated technology solutions automate routine tasks like generating return labels, processing refunds, and updating inventory, reducing manual effort and operational costs. Advanced analytics and machine learning provide deep insights into customer behavior, enabling businesses to identify trends, improve product quality, and enhance customer communication. Technology also supports omnichannel returns, allowing customers to initiate returns online, in-store, or via mobile, and receive consistent, high-quality support across all touchpoints. By embracing integrated technology, businesses can deliver a seamless returns experience that boosts customer satisfaction and drives operational efficiency.
Continuous improvement: building a future-proof returns operation
To stay ahead in the competitive ecommerce landscape, businesses must view their returns management process as a dynamic, evolving capability. Continuous improvement means regularly evaluating returns operations, incorporating customer feedback, and adopting a strategic approach that aligns with changing consumer behavior. Investing in scalable, cloud-based returns management systems enables companies to adapt quickly to market shifts and support business growth. By focusing on reducing operational costs, enhancing customer satisfaction, and leveraging data-driven insights, businesses can transform their returns management into a true competitive advantage. This commitment to innovation and agility ensures that returns operations not only meet today’s demands but are also prepared for the challenges and opportunities of tomorrow.
No More Return Waste
Help the planet and your profits—our award-winning returns tech reduces landfill waste and recycles value. Real savings, No greenwashing!
Learn About Sustainable ReturnsWhy customer satisfaction will separate winners from everyone else
The competitive separation happens along three dimensions: margin preservation, inventory efficiency, and algorithmic advantage.
On margin preservation, efficient returns management is critical. The gap between operators processing returns in 3 days versus 14 days translates directly to bottom-line performance. A brand with $10M in annual returns, operating on 35% gross margins, and experiencing 20% markdown rates on slow-processed returns loses approximately $400,000 annually to avoidable markdowns. Cutting processing time in half might reduce markdown rates to 8%, recovering $240,000 in annual margin. At scale, this difference determines whether the business is profitable.
On inventory efficiency, faster return processing means lower working capital requirements and higher inventory turnover. Brands that excel at recovery can operate with 10-15% less total inventory while maintaining the same in-stock rates, because they don’t need to buffer against the availability gap created by slow reverse logistics. This capital efficiency creates compounding advantages: less inventory requires less warehouse space, lower storage costs, and freed capital to invest in growth initiatives or weather cash flow challenges. Efficient returns management also helps reduce returns by enabling proactive measures such as quality control, accurate product descriptions, and clear customer communication.
The algorithmic advantage manifests in marketplace performance. Platforms like Amazon, Walmart, and emerging channels increasingly use availability consistency as a ranking factor. Products that maintain high in-stock rates, avoid frequent stockouts, and demonstrate reliable fulfillment earn better organic positioning. Returns that restock in 3 days instead of 14 reduce stockout frequency by roughly 75%, directly improving algorithmic treatment and reducing the paid acquisition costs needed to maintain visibility.
As AI shopping agents become more prevalent, the advantage intensifies. Agents evaluating purchase options in real-time can’t select products that show as available but are actually tied up in return processing. The agent moves to the next seller with verified inventory. Brands that recover return inventory faster capture these automated purchases that slower competitors never even see as lost opportunities.
The environmental and regulatory dimension will increasingly matter for brand reputation and compliance. Operations that minimize return-to-landfill rates, maximize product lifecycle value, and transparently report on waste reduction will meet both consumer expectations and emerging regulatory requirements. This isn’t just reputation management, it’s risk mitigation against Extended Producer Responsibility legislation and waste disposal restrictions expanding globally.
The strategic insight is that managing returns optimization compounds over time rather than providing a one-time benefit. Every percentage point improvement in restock rates, every day reduced from processing cycles, and every markdown avoided flows through to both immediate profitability and long-term competitive positioning. Analyzing return patterns and customer feedback is essential for reducing future returns and maximizing profitability. Brands that treat returns as a strategic capability rather than a customer service cost center are building systematic advantages that competitors will find increasingly difficult to match. Efficient returns management not only keeps customers happy by providing a smooth experience, but a well-managed returns process can turn a dissatisfied customer into a loyal advocate. In addition, returns management can enhance brand reputation, as a smooth returns process can turn dissatisfied customers into loyal advocates.
Frequently Asked Questions
What is the difference between returns visibility and returns recovery?
Returns visibility focuses on tracking and reporting: knowing where returns are in the process, monitoring refund timing, and analyzing return reasons through dashboards and analytics. Returns recovery focuses on economic outcomes: how quickly returned inventory becomes sellable again, what percentage restocks at full value versus markdown, and how much working capital is tied up in reverse logistics. Most returns platforms optimize for visibility metrics like customer satisfaction and refund speed. Strategic operators optimize for recovery metrics like time-to-restock and value preservation. The distinction matters because visibility alone doesn’t improve profitability.
How does return processing speed impact inventory availability and sales?
Products lose approximately 1-2% of value per week in return processing. A high-velocity SKU selling 100 units weekly with 25% returns has 25 units constantly in reverse logistics. If processing takes two weeks, that creates a 50-unit availability gap equivalent to 3.5 days of lost sales. On Amazon, stockouts reduce organic ranking by 30-50% after 7 days, requiring 3-4 weeks to recover. Brands processing returns in 3 days versus 14 days maintain higher availability, better marketplace rankings, and lower advertising costs while reducing the working capital tied up in inventory limbo.
What are the hidden costs of traditional reverse logistics approaches?
Traditional warehouse operations treat returns as secondary to outbound fulfillment, creating systematic delays. Returns compete with new inventory at receiving docks, wait in queues for inspection, require manual disposition decisions, and often take 10-14 days to process (extending to 30+ days during peak). This creates markdown costs of 15-30% for aged inventory, liquidation recovery of only 10-25% of retail value, storage costs of $5-8 per cubic foot monthly, and labor costs of $5-10 per return for manual processing. For a brand processing 10,000 returns monthly at $75 AOV, slow processing ties up $750,000 in working capital while generating avoidable markdown losses.
What operational changes enable faster returns recovery?
Strategic operators implement speed-optimized routing to dedicated reverse logistics facilities instead of central warehouses, disposition automation using rule-based systems to eliminate manual review bottlenecks (reducing manual touches from 100% to 15-20% of cases), parallel processing that inspects and updates inventory systems simultaneously rather than sequentially, cleaning and refurbishment capabilities to restore items to full-price condition, and real-time inventory system integration so restocked items become available immediately. These changes can reduce processing cycles from 10-14 days to 3-5 days while increasing the percentage of returns restocked at full value.
Why does returns management increasingly impact competitive positioning?
Returns management affects three competitive dimensions simultaneously. First, margin preservation: cutting processing time from 14 days to 5 days can reduce markdown rates from 20% to 8%, recovering hundreds of thousands in annual margin. Second, inventory efficiency: faster processing requires 10-15% less total inventory to maintain in-stock rates, freeing working capital and reducing storage costs. Third, algorithmic advantage: maintaining availability through faster restocking improves marketplace rankings and reduces paid acquisition costs. As AI shopping agents become prevalent, they select sellers with verified inventory availability, making recovery speed directly impact conversion for automated purchases.
How do return volumes and economics differ between online and physical retail?
Online sales experience 24.5% return rates compared to 8.9% for physical retail, reflecting fundamental differences when customers can’t examine products before purchase. Fashion categories see 30-40% online return rates, while electronics, home goods, and beauty trend above 20%. The National Retail Federation projects $850 billion in merchandise returns for 2025. With ecommerce gross margins typically 30-40% and carriers implementing 5.9% rate increases plus surcharges, absorbing both outbound and return shipping on 25% of sales leaves minimal profitability. An estimated 5.8 billion pounds of returned goods reach U.S. landfills annually, with up to 25% of returns destroyed rather than resold.
Written By:
Indy Pereira
Indy Pereira helps ecommerce brands optimize their shipping and fulfillment with Cahoot’s technology. With a background in both sales and people operations, she bridges customer needs with strategic solutions that drive growth. Indy works closely with merchants every day and brings real-world insight into what makes logistics efficient and scalable.
Turn Returns Into New Revenue
Related Articles
Seller Fulfilled Prime Works — But Only With the Right Operating Model
Seller Fulfilled Prime is attractive for very rational reasons.
SLA Meaning in Logistics: What Service Level Agreements Actually Guarantee (and What They Don’t)
The gap between what 3PL providers promise in SLA marketing (“99.
HTS Code Explained: What It Is, Why It Matters, and How Ecommerce Brands Use It
HTS codes (Harmonized Tariff Schedule codes) are standardized numerical classifications that identify imported products for U.
Ecommerce Fulfillment Is Becoming a Demand Accelerator in 2026

In this article
23 minutes
- Introduction to Ecommerce Fulfillment
- Ecommerce Fulfillment Models
- Delivery speed now directly determines customer satisfaction and whether customers buy
- Marketplace algorithms now treat fulfillment as a ranking signal
- Geographic inventory management and placement constrain or enable growth
- Stock-outs trigger algorithmic penalties that compound lost sales
- AI shopping agents evaluate fulfillment as primary selection criteria
- Speed and reliability standards have become non-negotiable table stakes
- Distributed fulfillment networks require sophisticated orchestration technology
- Ecommerce Fulfillment Provider Selection
- Outsourcing Fulfillment and Costs
- Operational consequences of fulfillment operations failures compound rapidly
- Frequently Asked Questions
The era when fulfillment was merely an operational expense is over. In 2026, fulfillment performance directly shapes marketplace visibility, conversion rates, and customer lifetime value, functioning as either a demand accelerator or a demand suppressor. Data shows that 2-day or faster delivery options correlate with a 10.5% conversion rate uplift and an 8.9% increase in repeat purchases, while slow shipping causes 21-23% of all cart abandonments. With AI shopping agents now processing over 50 million shopping queries daily and evaluating delivery speed as a primary ranking criterion, fulfillment reliability has transformed from a back-office function into the decisive factor separating growing brands from those losing ground.
Ecommerce fulfillment refers to the entire supply chain process involved in delivering online orders to customers. Ecommerce fulfillment is the process of getting orders to customers who make purchases online.
This structural shift means ecommerce operators can no longer treat logistics as separate from demand generation. As Digital Commerce 360 declared in their 2026 trends analysis: “The battlefront has moved away from the front end and marketing promises to inventory and data flow. The trend shows it is less about getting customers but more about how you can fulfil the promises.” For mid-market to enterprise operators, understanding this evolution and acting on it has become essential for competitive survival.
Introduction to Ecommerce Fulfillment
Ecommerce fulfillment is the backbone of any successful online business, shaping both customer satisfaction and long-term loyalty. The ecommerce fulfillment process encompasses every step from receiving and storing inventory, to picking, packing, and shipping orders directly to customers’ doors. As online shopping continues to accelerate, the efficiency and reliability of your fulfillment process can make or break the customer experience.
A well-optimized ecommerce fulfillment process ensures that orders are shipped accurately and on time, directly impacting customer satisfaction and repeat business. Effective inventory management is essential, allowing businesses to maintain the right stock levels, avoid costly stockouts, and streamline the entire fulfillment process. Whether you’re managing fulfillment in-house or working with a fulfillment partner, choosing the right approach is critical for scaling your online business.
There are several ecommerce fulfillment models available, each with its own advantages and challenges. Understanding these models—and how they align with your business goals—will help you develop a fulfillment strategy that supports growth, controls costs, and consistently meets customer expectations. In this guide, we’ll explore the key models, the importance of inventory management, and how to select the right fulfillment partner to support your business as it evolves.
Ecommerce Fulfillment Models
Ecommerce brands have a range of fulfillment models to choose from, each designed to support different sales channels and business needs. The most common approaches include in-house fulfillment, outsourced fulfillment through third-party logistics (3PL) providers, hybrid models, and dropshipping.
In-house fulfillment gives brands direct control over the pick, pack, and ship process, making it easier to maintain quality and customize the customer experience. However, as order volumes grow or sales channels diversify, managing fulfillment internally can become complex and resource-intensive.
Outsourced fulfillment, often managed by specialized 3PLs, allows ecommerce brands to leverage external expertise and infrastructure. This model is especially effective for businesses selling across multiple sales channels, as fulfillment providers can efficiently pick, pack, and ship orders from strategically located warehouses.
Hybrid models combine elements of both in-house and outsourced fulfillment, enabling brands to retain control over certain products or regions while scaling with external partners elsewhere. Dropshipping, meanwhile, allows brands to sell products without holding inventory, with suppliers handling the shipping process directly to customers.
Choosing the right fulfillment model depends on your business size, product mix, and growth ambitions. The ability to efficiently pick, pack, and ship across all your sales channels is essential for delivering a seamless customer experience and supporting business expansion.
Slash Your Fulfillment Costs by Up to 30%
Cut shipping expenses by 30% and boost profit with Cahoot's AI-optimized fulfillment services and modern tech —no overheads and no humans required!
I'm Interested in Saving Time and MoneyDelivery speed now directly determines customer satisfaction and whether customers buy
The relationship between fulfillment performance and conversion has become mathematically predictable. Research from Jitsu and Coresight found that retailers offering 2-day or faster delivery see conversion rates climb 10.5% compared to standard shipping options. The impact compounds: companies implementing same-day delivery report 66% conversion rate improvements, a 77% increase in net-new sales, and 78% improvement in repeat purchases.
Amazon’s dominance illustrates this dynamic. The platform maintains conversion rates of 10-13%, roughly five times the global ecommerce average of 1.65-3%, with Prime members converting at even higher rates due to fast, reliable shipping and frictionless checkout. This performance gap creates pressure across the entire market: 63% of consumers now expect two-day delivery as standard, with 86% defining “fast delivery” as two days or less.
Cart abandonment data reveals the cost of falling short. Baymard Institute’s 2025 analysis of 50 studies found global cart abandonment averaging 70.22%, with 21% directly citing slow delivery and 39% abandoning over extra costs including shipping fees. Capital One Shopping research found that 43% of shoppers have abandoned a cart or retailer entirely due to slow shipping speeds, and 63% choose a different retailer for future purchases when shipping exceeds two days.
The customer lifetime value impact proves even more significant. Shoppers receiving their first order within two days demonstrate 40% higher CLV over 12 months, while Bain & Company research shows that a 5% increase in customer retention can boost profits by 25-95%. Fast and accurate fulfillment is crucial for customer satisfaction and encourages repeat purchases. Efficient, reliable fulfillment helps build customer trust and brand loyalty. Fast fulfillment doesn’t just close sales, it builds the foundation for repeat business by helping meet customer expectations and fostering customer loyalty.
Marketplace algorithms now treat fulfillment as a ranking signal
Fulfillment metrics have become core inputs to the algorithms determining product visibility on major marketplaces. On Amazon, where over 82% of sales flow through the Buy Box, delivery speed now “trumps fulfillment type” according to recent algorithm analysis, meaning even merchant-fulfilled sellers can win if regional delivery matches or exceeds FBA performance. Products with FBA enrollment rank 3-7 positions higher on average than equivalent merchant-fulfilled listings and convert 1.5-2x better. Fulfillment by Amazon FBA is an ecommerce fulfillment service that gives you access to Amazon’s vast logistics network. With FBA, products are sent directly to Amazon fulfillment centers, where Amazon handles storage, packing, shipping, and customer service, enabling fast Prime shipping and improved ranking potential.
Amazon’s performance thresholds enforce this reality with severe consequences. Sellers must maintain Order Defect Rates below 1%, Late Shipment Rates below 4%, Valid Tracking Rates above 95%, and On-Time Delivery Rates above 90% to avoid account suspension. Premium shipping eligibility requires even tighter tolerances: On-Time Delivery above 93.5%, Cancel Rate below 0.5%, and Valid Tracking at 99%.
Walmart’s marketplace has implemented similar structures, with sellers using Walmart Fulfillment Services seeing a 50% GMV lift on items tagged “Walmart Fulfilled” with “2-Day Shipping” badges. The platform now requires On-Time Delivery Rates above 90%, Valid Tracking Rates above 99%, and will introduce a 2% Negative Feedback Rate threshold in early 2026. Non-compliant sellers face listing suppression, suspension, or termination, with termination appeals explicitly not accepted.
The buy box calculation extends beyond speed to include pricing within 5% of the lowest offer, consistent inventory availability, geographic proximity to customers, and performance history. Sellers experiencing stockouts face immediate Buy Box loss, potential search result suppression, and for products with three or more stockouts in 90 days, extended ranking suppression that can take 3-4 weeks to recover.
Looking for a New 3PL? Start with this Free RFP Template
Cut weeks off your selection process. Avoid pitfalls. Get the only 3PL RFP checklist built for ecommerce brands, absolutely free.
Get My Free 3PL RFPGeographic inventory management and placement constrain or enable growth
Where inventory sits determines what delivery promises are possible, which directly impacts conversion and marketplace visibility. A fulfillment warehouse plays a crucial role in managing and storing inventory, ensuring efficient order processing and integration with ecommerce platforms. Maintaining well-organized store inventory and optimal inventory levels across multiple locations is essential for fast, reliable ecommerce fulfillment. An inventory management system helps track and manage inventory across fulfillment warehouses, providing real-time visibility and preventing stockouts or overstocking. The process of receiving inventory involves inspecting, counting, and logging products into a Warehouse Management System (WMS), which supports accurate inventory control and streamlined operations. Analysis from ShipBob shows that distributing inventory across multiple fulfillment centers reduces shipping times by 71%, while strategic placement enables 45% more in-region orders and average shipping cost savings of 6.25% per order.
The mathematics of shipping zones explain this relationship. A 5-pound FedEx Ground package costs $11.98 in Zone 2 but $18.42 in Zone 8, a 54% increase. Transit times range from 1-2 days for Zones 1-2 to 5-6+ days for Zones 7-8. For businesses shipping 1,000 packages monthly, the difference between serving customers in Zones 2-3 versus 7-8 can exceed $100,000 annually in additional shipping costs alone.
The conversion impact proves equally stark. Case studies document the consequences: Our Place reduced delivery times from 5-6 days to 2.5 days by expanding from two to four fulfillment centers, saving $1.5 million in freight costs while improving 98% of parcels to Zones 1-6. Aroma360 cut EU delivery from 25 days (shipping from Miami) to 3 days using UK-based fulfillment, an 88% reduction that transformed European market viability.
Network design research indicates that three strategically positioned warehouses can enable 98% of U.S. customers to receive 2-day ground shipping nationwide. Optimal locations include Ohio (central access, high-volume throughput), Texas/Atlanta (southern coverage reaching both coasts), California (West Coast and import operations), and Pennsylvania/New Jersey (Northeast density). For businesses with sufficient volume, zone skipping (consolidating shipments destined for the same region into truckloads that bypass multiple sorting facilities) delivers 30-50% shipping cost reductions on applicable routes.
Stock-outs trigger algorithmic penalties that compound lost sales
The immediate revenue loss from inventory unavailability represents only a fraction of the total cost. Marketplace algorithms actively penalize inconsistent availability, creating compounding effects that persist long after stock returns. To avoid these issues, it is essential to manage inventory effectively across all fulfillment centers, using technology and warehouse management systems to monitor and optimize stock levels.
On Amazon, a 7-day stockout reduces organic ranking by 30-50%, with recovery requiring 3-4 weeks of consistent inventory. Products experiencing three or more stockouts in 90 days face extended ranking suppression that demands higher CPC bids and promotional spending to regain visibility. Survey data from 240 sellers found that Amazon stockouts resulted in an average of $18,000 in lost revenue per incident, accounting for ranking drops, missed Buy Box time, and slow recovery.
Inventory management is critical to growing an ecommerce business and involves tracking and controlling stock levels to meet demand. The Inventory Performance Index (IPI) creates additional pressure. Amazon’s current minimum threshold of 400 (on a 0-1,000 scale) triggers immediate storage restrictions and capacity limits when breached. As of April 2025, long-term storage fees now apply at 271 days (reduced from 365), while holding 26+ weeks of inventory triggers Storage Utilization Surcharges of up to $10 per cubic foot on excess inventory.
Pattern’s “Ecommerce Equation” framework (Revenue = Traffic × Conversion × Price × Availability) captures this dynamic. As their analysis states: “You can fully optimize your traffic, conversion, and price, but without having product available to sell, you can’t grow revenue for your brand.” Availability isn’t merely a sub-component of conversion; it’s a standalone revenue lever that can zero out all other optimization efforts.
AI shopping agents evaluate fulfillment as primary selection criteria
The rise of AI-mediated commerce introduces a new set of buyers who evaluate fulfillment programmatically. ChatGPT now processes over 50 million shopping-related queries daily from 800+ million weekly users, with OpenAI’s November 2025 launch of Shopping Research and Instant Checkout enabling direct purchases within the interface. Perplexity’s Buy with Pro offers one-click checkout with memory-driven personalization. Google’s AI Mode in Search, powered by Gemini 2.5 and a Shopping Graph of 50+ billion product listings refreshed 2 billion times hourly, can complete purchases via agentic checkout with user confirmation.
These agents evaluate products differently than human browsers. BCG research confirms that AI agents “prioritize price, user ratings, delivery speed, and real-time inventory over brand familiarity or loyalty.” When two sellers offer similar products, the agent selects based on shipping speed, reviews, and availability, even if title, image, and structured data are otherwise identical. According to Mastercard’s analysis, agents “evaluate shipping times, return policies and other logistical details” as core selection criteria. AI agents also process online orders by analyzing fulfillment options and selecting the most efficient provider to ensure timely delivery.
An efficient supply chain is critical for meeting the criteria set by AI agents, as it impacts delivery speed, inventory accuracy, and overall customer satisfaction. Automation and multi-carrier software are essential for efficient ecommerce fulfillment, especially in meeting customer demands.
This shift reduces merchant control over the customer journey. Retailers face what BCG describes as “loss of direct traffic, reduced insight into customer behavior and weakened brand loyalty as agents compare products based on a narrow set of criteria.” AI agents may break up multi-item purchases across retailers to optimize price per item, making cross-selling and upselling significantly harder.
The technical requirements for AI visibility are becoming clear. OpenAI’s product feed specification requires merchants to provide shipping methods, costs, and estimated delivery times; seller identification and policy links; return windows; and aggregated review statistics. Machine-readable schema markup for shipping details, return policies, and real-time inventory status determines whether AI agents can even evaluate a listing. Products with missing GTINs or stale availability data may be skipped entirely.
McKinsey projects the U.S. B2C retail market could see up to $1 trillion in orchestrated revenue from agentic commerce by 2030, with global projections reaching $3-5 trillion. While current adoption remains modest (ChatGPT referrals accounted for just 0.82% of ecommerce sessions over Thanksgiving weekend), the trajectory is clear. Businesses with subscription models stand to benefit particularly, given agents’ ability to manage replenishable recurring purchases autonomously.
Scale Faster with the World’s First Peer-to-Peer Fulfillment Network
Tap into a nationwide network of high-performance partner warehouses — expand capacity, cut shipping costs, and reach customers 1–2 days faster.
Explore Fulfillment NetworkSpeed and reliability standards have become non-negotiable table stakes
Same-day delivery has crossed from competitive advantage to consumer expectation. The global same-day delivery market reached $14.7 billion in 2025, growing at 20.8% annually toward projected values of $66-83 billion by 2033. Consumer surveys show 80% now expect retailers to offer same-day options, 67% of U.S. consumers expect same-day delivery availability, and 28% have abandoned purchases specifically because they needed items sooner than the provided delivery estimate.
The operational requirements to meet these expectations are precise. Amazon requires On-Time Delivery Rates above 90% (increased from prior thresholds in September 2024), Valid Tracking Rates above 95%, and Order Defect Rates below 1%. Walmart demands On-Time Delivery above 90%, Valid Tracking above 99%, Cancellation Rates below 2%, and Refund Rates below 6%. Target Plus requires shipping within 24 hours of order placement with delivery within 5 days, and no dropshipping allowed. Shipping delays are a key challenge in ecommerce fulfillment, often caused by errors in order processing, picking, packing, and managing high order volumes, which can hinder delivery times and customer satisfaction.
Industry benchmarks for order accuracy set the bar even higher. Best-in-class operations target 99.5-99.9% accuracy rates, with the WERC benchmark median at 99.6%. Inventory accuracy standards similarly require 99.5%+ for reliable fulfillment, though average retail accuracy without RFID sits at just 65%. The gap between leaders and laggards creates real competitive separation.
Returns processing has emerged as an equally critical standard. Research shows 72% of online customers expect refund credits within 5 days, and 88% would limit or stop shopping with merchants that take longer. With 24.5% of online sales returned (versus 8.9% in physical stores) at a cost of approximately $100 per ecommerce order, returns processing speed directly impacts both customer retention and operational costs. Returns management is an integral part of the ecommerce fulfillment process, involving the handling of returned items and issuing refunds or exchanges.
Distributed fulfillment networks require sophisticated orchestration technology
Building a multi-node fulfillment network demands more than additional warehouse space. Effective distributed fulfillment requires Distributed Order Management (DOM) systems capable of intelligent routing based on customer proximity, real-time inventory availability across all nodes, shipping cost optimization, service level requirements, and carrier performance data.
The technology stack encompasses Order Management Systems (OMS) for central processing, Warehouse Management Systems (WMS) for per-node operations, Transportation Management Systems (TMS) for carrier selection and rate shopping, and the DOM layer for orchestration. A warehouse management system plays a critical role in managing inventory, streamlining warehouse operations, and improving scalability for businesses operating their own warehouses or using hybrid fulfillment models. Order processing is a key component of distributed fulfillment, involving the steps of receiving, reviewing, and preparing customer orders to ensure timely and accurate shipments. A fulfillment solution provides a comprehensive system for managing fulfillment activities such as inventory management, order processing, and shipping, and can integrate with various ecommerce platforms and channels to streamline operations and support growth. These systems collectively manage ecommerce fulfillment operations, which include receiving inventory, storing and packing products, shipping orders, and handling customer service and returns. Leading DOM vendors include Fluent Commerce, SAP Order Management, Manhattan Associates, and ecommerce-focused options like ShipBob and Extensiv. Integration requirements span ecommerce platforms (Shopify, BigCommerce, Magento), marketplaces (Amazon, Walmart, TikTok Shop), ERP systems (NetSuite, SAP), carrier APIs, and returns platforms.
The ROI from proper orchestration is substantial. Freedom Australia reduced order cancellation rates by 85% using DOM capabilities, increasing stock availability 10x for online business. Zone skipping implementations deliver 30-50% shipping cost reductions on applicable routes, with ShipBob documenting savings of $3,000 on 2,000-package shipments from Philadelphia to Minneapolis.
However, the complexity costs deserve honest assessment. Multi-warehouse operations increase total safety stock requirements, raise inbound freight costs to multiple locations, create duplicate storage and handling fees, and demand significant technology and integration investment. Analysis of mid-sized sellers (1,000 orders/month) found that using two warehouses saved only 10% on shipping but added approximately 25% more total cost, around $48,000 annually in overhead. The calculus only works at sufficient volume.
Ecommerce Fulfillment Provider Selection
Selecting the right fulfillment partner is a pivotal decision for any ecommerce business aiming to scale efficiently. The ideal fulfillment partner should align with your current needs and future growth plans, offering the flexibility and service levels required to support your evolving fulfillment strategy.
Key considerations include the size and complexity of your business, the range of fulfillment services offered, technology integration capabilities, and the provider’s geographic reach. A robust fulfillment partner should offer advanced inventory management systems, real-time order tracking, and seamless integration with your ecommerce platforms and sales channels.
When evaluating potential partners, ask targeted questions about their experience with similar businesses, their ability to handle seasonal spikes, and their approach to customer service and returns. Assess whether their fulfillment operations can scale with your business and if their technology stack supports your order management and reporting needs.
Timing is also crucial—many brands wait too long to outsource, resulting in operational bottlenecks and missed growth opportunities. By proactively seeking the right fulfillment partner, you can streamline your fulfillment process, reduce operational headaches, and focus on growing your online business.
Outsourcing Fulfillment and Costs
Outsourcing fulfillment operations to a third-party logistics provider (3PL) can be a strategic move for ecommerce brands looking to accelerate business growth and expand into new markets. A professional 3PL brings expertise, technology, and a network of fulfillment centers to efficiently manage the entire order fulfillment process, from inventory storage to shipping orders.
However, it’s essential to understand the full scope of ecommerce fulfillment costs before making the leap. Typical expenses include storage fees for inventory, pick and pack charges for each order, shipping costs based on destination and package size, and additional service fees for value-added services like branded packaging or returns management. Some providers may also charge setup or integration fees, so it’s important to review contracts carefully.
While outsourcing can reduce operational costs and free up resources for core business activities, brands should evaluate the total cost of fulfillment—including hidden fees and the impact on customer experience. The right fulfillment partner will offer transparent pricing, scalable solutions, and the operational excellence needed to support your business growth without sacrificing quality service or customer satisfaction.
Operational consequences of fulfillment operations failures compound rapidly
Poor fulfillment performance triggers cascading effects that extend far beyond immediate order problems. Failed deliveries cost an average of $17.78 per attempt and account for 8-20% of shipments depending on geography. Late delivery correlates with a 1.1% increase in returns for every day late. And 69% of consumers blame the brand, not the carrier, for poor delivery experiences.
Customer lifetime value takes direct hits. Research shows 58% of consumers will stop doing business after a bad service experience, 32% leave after a single negative interaction, and lost customers now cost an average of $29 each, up from $9 a decade ago. Repeat customers spend 67% more than first-time buyers and are 60% less likely to churn than dissatisfied customers. Every fulfillment failure potentially eliminates that future value.
The competitive context makes these failures particularly costly. Industry-wide average delivery time improved 27% year-over-year to 3.7 days in late 2024, meaning the threshold for acceptable performance keeps rising. Amazon has normalized 2-day shipping and now pushes same-day and 1-day as the new standard. Carriers implemented 5.9% rate increases in 2024 with additional surcharges for peak seasons, rural areas, and oversized packages. Operators falling behind face both margin pressure and market share erosion. Inefficiencies in fulfilling orders can drive up your fulfillment cost, directly impacting your bottom line through inefficient, day-to-day execution. Comparing fulfillment costs and optimizing the process of fulfilling orders is essential to remain competitive and profitable.
During peak season, these challenges intensify. Holiday 2024 saw on-time performance drop to approximately 84%, return rates surge from 17.6% to 20.4%, and up to 7% of packages reported damaged or lost. Brands utilizing two or more last-mile partners experienced 27% fewer delivery failures, suggesting that carrier diversification has become a necessary resilience strategy.
Frequently Asked Questions
How does delivery speed affect conversion rates?
Retailers offering 2-day or faster delivery see conversion rates increase by 10.5% compared to standard shipping. When a customer places an order, it initiates the ecommerce fulfillment process, which consists of several distinct steps: receiving, storing, picking, packing, shipping, and returns processing. Efficient management and quick processing of customer orders are crucial for meeting delivery speed expectations. Same-day delivery implementations report 66% conversion improvements, 77% increases in net-new sales, and 78% improvement in repeat purchases. Cart abandonment data shows 21% of abandoned carts cite slow delivery as the reason, while 43% of shoppers abandon retailers entirely due to slow shipping. The impact on customer lifetime value is equally significant, with customers receiving first orders within two days showing 40% higher CLV over 12 months.
What marketplace performance metrics determine seller visibility and Buy Box eligibility?
Amazon requires Order Defect Rates below 1%, Late Shipment Rates below 4%, Valid Tracking Rates above 95%, and On-Time Delivery Rates above 90% to avoid suspension. Premium shipping eligibility requires On-Time Delivery above 93.5%, Cancel Rate below 0.5%, and Valid Tracking at 99%. Walmart demands On-Time Delivery above 90%, Valid Tracking above 99%, Cancellation Rates below 2%, and Refund Rates below 6%.
Ecommerce logistics play a crucial role in meeting these strict marketplace performance metrics, as they ensure smooth order processing and timely delivery. Efficient logistics provide a significant competitive edge in ecommerce.
Products with FBA enrollment rank 3-7 positions higher and convert 1.5-2x better than merchant-fulfilled equivalents, though delivery speed now matters more than fulfillment type.
How do stockouts impact marketplace rankings and revenue?
A 7-day Amazon stockout reduces organic ranking by 30-50%, with recovery requiring 3-4 weeks of consistent inventory. Timely ship inventory processes are crucial to prevent stockouts and maintain sales momentum. Products with three or more stockouts in 90 days face extended ranking suppression requiring higher CPC bids to regain visibility. Survey data shows average revenue loss of $18,000 per stockout incident when accounting for ranking drops, missed Buy Box time, and slow recovery. Accurate fulfillment is associated with higher customer lifetime value and reduces costly returns. Sellers also risk falling below Amazon’s IPI threshold of 400, triggering storage restrictions and capacity limits.
What are the cost and conversion benefits of distributed fulfillment networks?
Distributing inventory across multiple fulfillment centers reduces shipping times by 71%, enables 45% more in-region orders, and saves an average of 6.25% per order on shipping costs. A 5-pound package costs $11.98 in Zone 2 versus $18.42 in Zone 8, meaning geographic placement can save businesses shipping 1,000 packages monthly over $100,000 annually. Case studies show Our Place saved $1.5 million in freight costs while improving 98% of parcels to Zones 1-6 by expanding from two to four fulfillment centers. However, ecommerce fulfillment cost in distributed networks depends on several factors, including order volume, product size, storage requirements, and value-added services. Smaller operations may find the overhead (25% higher total costs) outweighs the 10% shipping savings.
How do AI shopping agents evaluate fulfillment when making purchase decisions?
AI agents prioritize price, user ratings, delivery speed, and real-time inventory over brand familiarity or loyalty. When two sellers offer similar products, agents select based on shipping speed, reviews, and availability. In an ecommerce store, AI agents evaluate fulfillment options by analyzing available shipping methods, costs, and estimated delivery times to ensure a seamless order processing workflow. Customers increasingly expect same-day or next-day shipping as a baseline requirement. OpenAI’s product feed specification requires merchants to provide shipping methods, costs, estimated delivery times, return windows, and aggregated review statistics. Products with missing GTINs or stale availability data may be skipped entirely. Machine-readable schema markup for shipping details, return policies, and real-time inventory status determines whether AI agents can evaluate a listing.
What technology stack is required for an effective ecommerce fulfillment process in multi-warehouse fulfillment?
Effective distributed fulfillment requires Distributed Order Management (DOM) systems for intelligent routing, Order Management Systems (OMS) for central processing, Warehouse Management Systems (WMS) for per-node operations, and Transportation Management Systems (TMS) for carrier selection. Leading DOM vendors include Fluent Commerce, SAP Order Management, Manhattan Associates, ShipBob, and Extensiv. Integration requirements span ecommerce platforms (Shopify, BigCommerce, Magento), marketplaces (Amazon, Walmart, TikTok Shop), ERP systems (NetSuite, SAP), carrier APIs, and returns platforms. A good fulfillment partner can provide access to advanced technology and infrastructure that may be too costly for a business to develop in-house. With a dedicated account manager, businesses receive hands-on support in managing fulfillment technology, ensuring smooth integration and ongoing optimization. The technology investment becomes cost-effective only at sufficient order volumes.
Written By:
Rinaldi Juwono
Rinaldi Juwono leads content and SEO strategy at Cahoot, crafting data-driven insights that help ecommerce brands navigate logistics challenges. He works closely with the product, sales, and operations teams to translate Cahoot’s innovations into actionable strategies merchants can use to grow smarter and leaner.
Turn Returns Into New Revenue
Related Articles
Seller Fulfilled Prime Works — But Only With the Right Operating Model
Seller Fulfilled Prime is attractive for very rational reasons.
SLA Meaning in Logistics: What Service Level Agreements Actually Guarantee (and What They Don’t)
The gap between what 3PL providers promise in SLA marketing (“99.
HTS Code Explained: What It Is, Why It Matters, and How Ecommerce Brands Use It
HTS codes (Harmonized Tariff Schedule codes) are standardized numerical classifications that identify imported products for U.