
What Is a Flash Sale? Benefits, Risks, and Operational Challenges

A flash sale is a short-duration promotional event in which a brand offers discounted prices on select items for a defined window of time, typically anywhere from a few hours to 48 hours. The design is deliberate: urgency created by time limits and limited quantities drives consumers to make purchasing decisions faster than they otherwise would, compressing demand into a concentrated burst of order volume. The thrill of winning a great deal during flash sales adds an element of entertainment and excitement for consumers.
For ecommerce brands, understanding the benefits and advantages of a well-executed flash sale is key—it can clear excess inventory, boost brand awareness, create a competitive edge, and bring in new customers while boosting sales and brand visibility. Flash sales are used by both online and brick-and-mortar stores to drive traffic. For example, limited-time apparel discounts and surprise sales from retailers like Zulily or Gilt are classic flash sales. Retailers often employ countdown timers to create urgency, and the extreme time limit can reduce decision fatigue for consumers. The primary goal of a flash sale is to encourage impulse purchases by creating urgency and leveraging the fear of missing out among consumers. A poorly planned one can crash a website, overwhelm fulfillment capacity, trigger a wave of returns, and deliver margin outcomes that look worse after the event than before it.
Why Brands Run Flash Sales to Clear Excess Inventory
The appeal of the flash sale format is straightforward. Time pressure converts browsers into buyers. Scarcity signals create excitement that standard promotional pricing does not. And the concentrated format makes flash sales easier to promote with urgency across email, SMS, and social channels than an indefinite sale with no clear endpoint.
Ecommerce brands use flash sales for several distinct purposes, and the reason behind the event shapes how it should be structured:
Clearing excess inventory is one of the most operationally sound uses of a flash sale. A brand sitting on overstock of a slow-moving SKU, seasonal leftover, or a product being discontinued can use a flash sale with deep discounts on those specific items to convert dead stock into cash and recover warehouse space. The margin hit is absorbed on inventory that was not moving anyway.
Rewarding loyal customers through exclusive early access or member-only flash sales builds relationship value without the margin erosion that comes from running public discounts. A flash sale visible only to email subscribers or loyalty members provides the perception of exclusivity and the feeling of being valued without training the broader market to wait for deals.
Driving new customer acquisition is a legitimate goal, but it requires careful analysis of unit economics. Flash sales often attract new customers and first-time buyers, but a major challenge is converting these shoppers into loyal customers after the sale ends, as many may not return for future purchases. Additionally, flash sales can be used to re-activate dormant email subscribers, bringing them back into the customer journey. A customer acquired through a 50 percent discount on a first purchase has to return and buy at full price for that acquisition to make financial sense. Flash sales that acquire customers who are discount-motivated and never return at full price are not growth events. They are margin-eroding promotions that inflate order counts. Brands should focus on strategies that maximize the impact of flash sales for new customer acquisition.
Generating revenue during slow periods gives brands a tool for activating demand during historically low-traffic windows. An off-season flash sale can bridge revenue gaps, though the cost in margin per order needs to be weighed against what that demand would look like at standard pricing without the promotional push.
The Demand Spike Problem
The defining operational feature of a flash sale is the demand spike. Demand that would have been distributed across days, weeks, or months is collapsed into hours. The concentrated volume is precisely what makes the format effective from a marketing standpoint and precisely what makes it dangerous from an operations standpoint.
A brand that processes 200 orders per day and runs a flash sale that generates 2,000 orders in four hours has not just had a good day. It has presented its fulfillment infrastructure with a challenge it was not designed to handle at that ratio. Unless capacity was explicitly prepared in advance, every system that touches order processing comes under simultaneous stress: the website, the inventory management system, the warehouse pick-and-pack workflow, the carrier pickup volume, and the customer service queue.
Website performance failures during flash sales are common enough to be an expected risk rather than an edge case. A spike in concurrent sessions that exceeds server capacity produces slow load times or outright downtime at exactly the moment when customer intent is highest. Every second of downtime during a flash sale is lost revenue and broken brand credibility. Brands running flash sales on Shopify benefit from the platform’s infrastructure, but third-party apps, custom integrations, and poorly optimized themes can still produce performance degradation under load. Load testing before a high-volume event is not optional preparation. It is standard practice for any brand expecting meaningful traffic.
Inventory management during a flash sale requires real-time accuracy. Overselling, where a product sells more units than are physically in stock, is a frequent flash sale failure mode. A customer who completes a purchase and receives a cancellation notification a day later because the item was already sold out when they ordered has had a worse experience than if they had simply seen the item as unavailable. Overselling also drives a disproportionate share of post-sale customer service volume, refund processing, and negative reviews.
Fulfillment Bottlenecks
The order processing spike from a flash sale creates downstream pressure on fulfillment that often does not become visible until days after the event ends. Warehouse teams that were staffed for normal daily volume face a backlog of orders that arrive simultaneously rather than in a steady flow. Pick-and-pack throughput has a ceiling regardless of order volume. Packing stations, label printers, carrier pickups, and staging areas all have physical capacity limits.
Brands that run flash sales without pre-staging inventory near packing stations, without adding temporary labor or scheduling existing staff for extended shifts, and without coordinating increased carrier pickup volumes in advance will discover these limits painfully. The result is shipping delays that stretch beyond the delivery windows communicated to customers at checkout. Customers who purchased during a flash sale expecting two to three day delivery and received their order eight days later are not likely to return at full price. During and after a flash sale, it is crucial to provide excellent customer service to maintain customer satisfaction and foster loyalty. Excellent customer service can help mitigate negative experiences caused by fulfillment delays and ensure a positive perception of the company.
Third-party logistics providers are a partial solution to the capacity problem, but they require advance notification to prepare. A 3PL that is not told about an upcoming flash sale until the orders start flowing has the same capacity constraints as an in-house warehouse, which is especially problematic for small businesses relying on third-party logistics for warehousing and fulfillment. Communication with fulfillment partners well before the event, including a projected order volume range and a timeline, allows the partner to staff appropriately and pre-position inventory.
Carrier capacity is a separate constraint that brands frequently overlook. Scheduling a carrier pickup that is ten times the normal daily volume without coordination may result in a partial pickup or a missed pickup entirely. A brand shipping via UPS, FedEx, or a regional carrier should contact their account manager before a high-volume flash sale event to confirm pickup capacity and, if needed, schedule a supplemental pickup or arrange a drop-off to a hub facility, since broader supply chain inefficiencies and carrier reliability issues can amplify flash-sale-related bottlenecks.
Margin Erosion: The Math Brands Skip
Flash sales feel like revenue events. The order volume is high. The revenue number is large. The margin story is often quietly worse than it appears.
A product with a standard unit margin of 40 percent sold at a 40 percent discount is generating zero gross margin on every sale. When warehousing costs, payment processing fees, and shipping costs are applied against that order, the unit economics are negative. A flash sale that generates $80,000 in revenue at negative margin is not a success. It is an expensive exercise in revenue with no profit.
The break-even analysis for a flash sale requires calculating the actual gross margin at the discounted price after all variable costs, not just comparing the revenue to the cost of goods sold. For inventory clearance purposes, some margin sacrifice is rational because the alternative is holding costs and eventual write-off. For demand generation purposes, the margin arithmetic needs to close in a realistic customer lifetime value model.
The returns impact is often not modeled into flash sale planning at all. Flash sales generate higher return rates than standard purchase events for several reasons: customers buy impulsively under time pressure, customers purchase items they are less certain about because the low price reduces the psychological cost of a mistake, and some customers purchase multiples intending to return the sizes or styles that do not work. A flash sale with a 25 percent return rate has a meaningfully different margin profile than one with a 10 percent return rate. Return processing costs, restocking labor, and the possibility that returned items arrive in unsellable condition all reduce the effective margin of the event further.
The Contrarian View: Flash Sales Can Undermine Brand Positioning
Many ecommerce brands treat flash sales as a tactical revenue lever without considering their effect on brand perception and customer pricing expectations.
A customer who buys from a brand for the first time during a 60 percent off flash sale has established a reference price. When they return to the site and see standard pricing, they have a decision to make: pay the full price, wait for the next sale, or abandon the brand. Brands that run flash sales frequently are implicitly telling their customers that the real price is the sale price. Over time, this erodes willingness to pay at full price, suppresses organic demand, and creates a customer base that is structurally dependent on promotional events to engage.
This is not a theoretical risk. It is the documented pattern of brands that over-rely on promotional pricing as a demand driver. The flash sale format accelerates this dynamic because the urgency mechanics make the discount even more salient in the customer’s memory than a standard promotion would.
However, a positive flash sale experience can strengthen the company’s reputation and foster greater customer loyalty, as customers associate the company with value and excitement. Brands with strong brand equity, a loyal customer base, and disciplined promotional cadence can run flash sales without these consequences. Staying informed about ecommerce logistics and fulfillment trends through industry events and conferences can also help brands refine their flash sale strategies over time. The risk is highest for brands that use flash sales as a primary growth mechanism rather than as a deliberate, selective tool.
How to Run a Flash Sale Without Breaking Operations
For brands that have evaluated the economics and determined a flash sale makes sense, preparing your ecommerce store and store infrastructure is crucial for smooth execution. Robust ecommerce fulfillment software with real-time visibility and smart inventory placement can make that checklist far easier to execute at scale.
Flash Sale Operational Preparation Checklist:
- Identify your target audience and understand their preferences and buying behavior to maximize the effectiveness of your flash sale.
- Use multiple channels—such as email, social media, and website banners—to promote the flash sale, build anticipation, and drive customers to shop.
- Leverage flash sales as an effective way to sell products quickly and clear excess or slow-moving inventory from your ecommerce store.
- Set inventory limits per SKU and use platform-level inventory caps to prevent overselling. If a flash sale is limited to 500 units of a product, the system should stop accepting orders at 500, not at some downstream point after the warehouse has already committed to fulfillment.
- Communicate with all operational partners before the event: warehouse team or 3PL, carriers, customer service. Each group needs to know the expected volume, the timing, and what elevated response looks like for their function.
- Test the website under load before the event goes live. Tools that simulate concurrent users against a staging environment can identify performance bottlenecks before they affect real customers.
- Build the return policy for the event explicitly and display it prominently. A flash sale with no stated return policy creates customer service ambiguity that costs more to resolve than a clear policy stated upfront.
- Define a realistic shipping window at checkout that reflects actual fulfillment capacity during the event period, not standard processing time. Underpromising delivery time and meeting it is far better than overpromising and failing.
- Monitor order flow and inventory in real time during the event. Having a team member watching live order volume and inventory levels allows rapid intervention if a SKU sells out faster than expected or if a fulfillment bottleneck is emerging.
Frequently Asked Questions
What is a flash sale?
A flash sale is a short-duration promotional event where a brand offers steep discounts on select products for a defined time window, typically a few hours to 48 hours. The combination of limited time and limited quantities is designed to create urgency and drive concentrated purchase activity.
How long should a flash sale last?
Most flash sales run between four hours and 24 hours. The optimal duration depends on the size of the audience being reached and the depth of inventory available. Shorter windows create stronger urgency but require a larger active audience to generate meaningful volume. Longer windows give more customers the opportunity to participate but reduce the urgency signal.
Are flash sales good for ecommerce brands?
They can be, when used selectively with a clear objective, properly modeled unit economics, and adequate operational preparation. Used frequently or without planning, flash sales erode margins, train customers to expect discounts, and create fulfillment problems that damage customer experience.
What is the biggest operational risk of a flash sale?
Demand spikes that exceed fulfillment capacity are the most common operational failure mode. When orders arrive faster than a warehouse or 3PL can process them, shipping delays follow, customer expectations are broken, and customer service volume spikes. The second most common risk is overselling, where orders are accepted for inventory that is no longer available.
How do flash sales affect returns?
Flash sales typically generate higher return rates than standard purchases because customers buy under time pressure and with less deliberation than usual. Brands should model expected return rates into the margin analysis for any flash sale event and ensure reverse logistics capacity is available to handle the post-event return flow.
How can a brand avoid overselling during a flash sale?
Set hard inventory limits in the ecommerce platform or order management system that prevent additional orders once the allocated quantity is sold. Real-time inventory tracking during the event is essential. Brands using multiple sales channels simultaneously must ensure inventory is not double-allocated across channels without a centralized inventory pool.
Should flash sales be exclusive to existing customers?
For brands concerned about training the broader market to wait for discounts, offering flash sale access exclusively to existing email subscribers or loyalty members is a better-positioned strategy. It rewards loyalty, maintains urgency, and avoids the brand perception problems that come from making deep discounts visible to the general public.
Written By:

Rinaldi Juwono
Rinaldi Juwono leads content and SEO strategy at Cahoot, crafting data-driven insights that help ecommerce brands navigate logistics challenges. He works closely with the product, sales, and operations teams to translate Cahoot’s innovations into actionable strategies merchants can use to grow smarter and leaner.

Turn Returns Into New Revenue

Related Articles
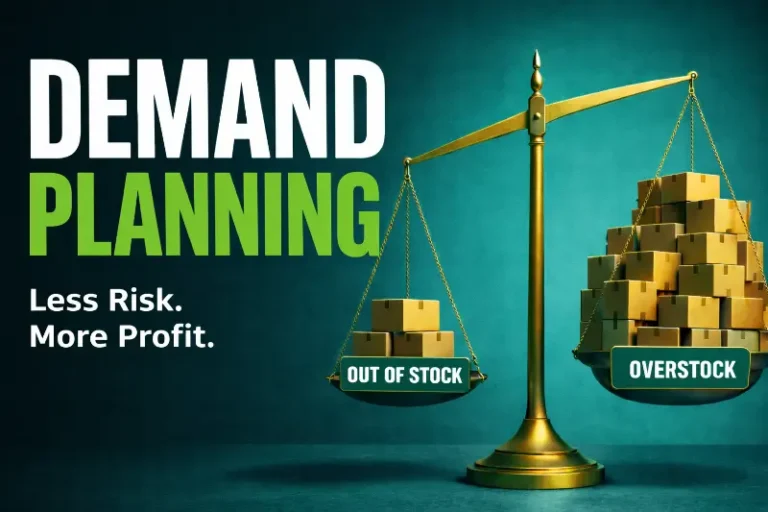
What Is Demand Planning? How It Impacts Inventory, Forecasting, and Profitability
Demand planning is the process of estimating future customer demand so that a business can align its inventory, procurement, and operations to meet that demand without carrying mor...

Why 100% P2P Adoption Is the Wrong Goal
Peer-to-peer returns let customers send eligible returned items directly to other customers instead of routing every package back through the warehouse, cutting shipping and proces...
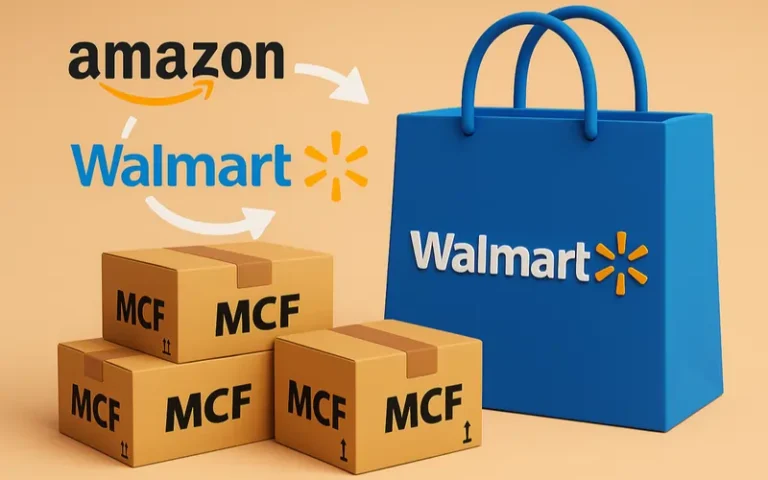
Walmart Officially Allows Amazon Multi-Channel Fulfillment (MCF)
Big news for multichannel sellers: Walmart now officially allows Amazon Multi-Channel Fulfillment (MCF), Amazon’s service for using its fulfillment network to ship orders from mult...
Does UPS Deliver on Saturdays? UPS Weekend Delivery Explained

In this article
 14 minutes
- Yes, UPS Delivers on Saturdays
- Saturday Delivery Is Not the Same as Universal Weekend Delivery
- Does UPS Deliver on Sunday?
- Which UPS Services Offer Saturday Delivery?
- Does UPS Ground Deliver on Saturday?
- How Much Does UPS Saturday Delivery Cost?
- Does UPS Offer Saturday Pickup?
- How Late Does UPS Deliver on Saturday?
- UPS vs. FedEx, USPS, and Amazon Weekend Delivery
- What Saturday Delivery Means for Ecommerce Sellers
- Weekend Delivery Depends on Fulfillment, Not Just the Carrier
- How Cahoot Helps Sellers Compete on Fast Delivery
- How to Check Whether Your UPS Package Will Arrive Saturday
- The Bottom Line on UPS Saturday Delivery
- Frequently Asked Questions
Yes, UPS delivers on Saturdays for many residential and commercial packages. UPS says it offers Monday through Saturday delivery service for residential and commercial parcels, but standard UPS delivery does not run on Sunday. UPS delivers packages on weekends, especially to meet the needs of e commerce businesses, as the demand for faster shipping in online retail continues to grow. Most packages are generally delivered by 8 p.m., though the final delivery time can vary by route, package volume, weather, holidays, and destination.
For consumers, the answer is simple: UPS Saturday delivery is available for many packages, but you should check your tracking number for the latest details. For ecommerce sellers, the bigger question is whether UPS delivers on weekends is particularly relevant for e commerce operations aiming to meet customer expectations, while also considering if Saturday delivery actually helps you improve the customer promise without creating unnecessary shipping costs, operational stress, or missed expectations at checkout.
Yes, UPS Delivers on Saturdays
UPS does deliver on Saturdays, and Saturday delivery is now part of many UPS weekend delivery options. This can include ground residential delivery packages, commercial parcels, and certain air services, depending on the selected service, destination, package weight, and shipper settings.
That does not mean every UPS package will arrive on Saturday. Availability can vary by location, service level, whether the destination is a residential address or business address, and how UPS defines a business day for the specific service. A package moving through UPS Ground, UPS 2nd Day Air, Next Day Air, UPS SurePost, or another service may have different Saturday delivery rules.
The best way to confirm whether a specific UPS package will arrive on Saturday is to check the tracking number. UPS tracking is the source of truth for a live shipment because it reflects the selected service, current scan history, destination, and final delivery status.
Saturday Delivery Is Not the Same as Universal Weekend Delivery
A common mistake is assuming that “UPS weekend delivery” means UPS delivers every package on both Saturday and Sunday. That is not how it works.
UPS offers Saturday delivery for many shipments, but Sunday delivery is not standard. UPS’s weekend delivery page says UPS offers Monday through Saturday delivery for residential and commercial parcels and that there are no Sunday deliveries. UPS’s weekend services primarily focus on Saturday deliveries, with limited or no standard Sunday service.
That distinction matters. If a customer asks whether UPS delivers on weekends, the short answer is: yes, UPS delivers on Saturdays, but standard UPS Sunday delivery is not available. If a package is urgent, the shipper may need a special service or a different delivery option rather than assuming it can arrive on Sunday.
Does UPS Deliver on Sunday?
For standard UPS delivery, no. UPS does not generally deliver on Sunday. Most UPS locations are not open for standard deliveries on Sunday, and UPS open hours typically cover Monday through Saturday.
There may be edge cases involving urgent services, special arrangements, final-mile partnerships, or nonstandard delivery situations, but those should not be treated as normal UPS Sunday delivery. Consumers should check tracking details. Ecommerce sellers should never promise Sunday delivery at checkout unless the selected service specifically supports it.
This is especially important for ecommerce brands because shoppers often compare UPS, FedEx, USPS, and Amazon orders without understanding that each carrier has different weekend delivery rules. If your checkout promise says an order will arrive “this weekend,” customers may interpret that as Saturday or Sunday. Your carrier selection may not support that.
Which UPS Services Offer Saturday Delivery?
Saturday delivery can depend on the UPS service used, the destination, and whether the shipment qualifies. UPS lists Saturday delivery as available for services such as UPS 2nd Day Air and UPS 3 Day Select on its domestic shipping services page.
Here is a practical overview:
| UPS Service | Saturday Delivery Notes |
| UPS Ground | Saturday ground deliveries may be available for many residential packages, depending on location, destination, and service eligibility. |
| UPS 2nd Day Air | Saturday delivery may be available depending on the selected service and destination. UPS lists Saturday delivery as available for UPS 2nd Day Air. |
| UPS Next Day Air | Saturday delivery may be available for time sensitive shipments in eligible areas. Shippers should confirm availability and any additional fees during label creation. |
| UPS SurePost | SurePost deliveries may involve USPS for final delivery, making weekend and even Sunday delivery possible in some cases. SurePost is an exception among UPS services, as its integration with USPS allows for some weekend and Sunday deliveries, depending on USPS weekend schedules and the destination. |
| UPS Express Critical | Designed for urgent deliveries and special shipping needs. This may be relevant for urgent shipments, but it is not the same as standard Saturday ground delivery. |
The main point: do not assume Saturday delivery applies just because UPS transports the package. Confirm the selected service, destination, and delivery options before promising a Saturday arrival.
Does UPS Ground Deliver on Saturday?
UPS Ground can deliver on Saturday in many cases, especially for residential deliveries. In fact, ground residential deliveries on Saturdays are often included at no additional cost for eligible addresses. However, eligibility depends on the shipment, destination, and service availability.
For shoppers, this means a UPS Ground package may arrive Saturday, but it is not something to guess from the service name alone. Check tracking.
For ecommerce sellers, this matters because Saturday ground deliveries can sometimes improve delivery speed without paying for a more expensive air service. If a Friday shipment can reach a nearby residential customer on Saturday by ground, that may be more cost-effective than upgrading every order to UPS 2nd Day Air.
But this only works if the seller’s fulfillment process supports it. If the order misses the warehouse cutoff, sits unprocessed until Monday, or cannot be picked up on Saturday, the theoretical Saturday delivery advantage disappears.
How Much Does UPS Saturday Delivery Cost?
UPS Saturday delivery cost can vary. The final cost may depend on the selected service, package weight, destination, residential or commercial delivery type, shipper account settings, and whether Saturday delivery is included or added as an option. For many ground residential deliveries, there is no additional cost for Saturday delivery, but other UPS services may incur extra fees for Saturday service.
Some Saturday delivery options may be included for certain services or regions, while others may involve additional fees. That is why sellers should confirm the final cost during label creation, rate shopping, or checkout configuration rather than relying on a blanket rule.
For ecommerce brands, the cost question should be broader than “Does UPS charge extra for Saturday delivery?” The better question is:
Does Saturday delivery help us meet a faster delivery promise at a cost that still protects margin?
Sometimes the answer is yes. Sometimes the added fee or required service upgrade makes the order unprofitable. The right choice depends on shipping costs, package weight, destination, order value, customer expectations, and available carrier options, and whether expedited shipping options actually improve the overall economics.
Does UPS Offer Saturday Pickup?
Yes, UPS offers Saturday pickup options. UPS says it offers Saturday package car pickup services, which can help businesses that want to move orders into the shipping process before Monday. UPS offers Saturday pickups for various services, and customers can schedule a UPS pickup on Saturdays depending on their location and service requirements.
Saturday pickup is different from Saturday delivery. A package can be delivered on Saturday even if the seller does not use Saturday pickup. Likewise, a seller may want Saturday pickup so weekend orders begin moving sooner, even if final delivery happens the following week.
This distinction is important for ecommerce sellers. If your warehouse closes Friday afternoon and does not process orders again until Monday, Saturday delivery alone may not help your customers. To make weekend delivery useful, you may also need weekend ecommerce order fulfillment services, Saturday pickup, accurate cutoff times, and carrier services that match your delivery promises.
UPS Store hours and pickup availability can vary by location, so customers and sellers should check local details before assuming a drop-off or pickup option is open on Saturday.
How Late Does UPS Deliver on Saturday?
UPS says most packages are generally delivered by 8 p.m.
That does not mean every Saturday package will arrive at the same time. Delivery times depend on driver route, destination, service level, package volume, weather, holidays, and operational conditions. A package marked “out for delivery” may still arrive later in the day.
For a specific package, the tracking number is the best place to check. If the shipment has a guaranteed delivery commitment, tracking and service details should show the relevant information. If the package does not have a specific guaranteed delivery time, customers should avoid assuming it will arrive in the morning or early afternoon.
UPS vs. FedEx, USPS, and Amazon Weekend Delivery
Consumers often search UPS weekend delivery alongside FedEx Home Delivery, USPS weekend delivery, Priority Mail, and Amazon orders because weekend delivery expectations have changed. Many shoppers now expect packages to move or arrive on Saturdays, and some expect Sunday delivery as well. Saturday delivery and pickup services are most widely available in major metropolitan areas, where demand and logistical efficiency are highest.
But carriers do not all operate the same way.
FedEx, USPS, Amazon, and UPS each have different delivery services, pickup rules, final delivery networks, and weekend coverage. USPS may deliver certain mail and packages on weekends. Amazon orders may arrive on weekends depending on the fulfillment network and local delivery capacity. FedEx Home Delivery has its own residential delivery model.
For ecommerce sellers, the lesson is simple: do not build checkout promises around assumptions. Build them around the actual carrier service, customer location, fulfillment cutoff, and delivery estimate, whether you’re managing your own store or relying on marketplaces like those that benefit from fast eBay fulfillment.
What Saturday Delivery Means for Ecommerce Sellers
Saturday delivery can be a real advantage for ecommerce brands, especially Shopify merchants using dedicated fulfillment services, but only when the operation behind it is ready.
For example, Saturday delivery can help reduce the Friday-to-Monday delivery gap. A package shipped on Friday may be able to reach certain residential customers on Saturday instead of waiting until Monday. That can improve customer satisfaction, reduce “Where is my order?” tickets, and make a brand’s delivery promise more competitive.
Saturday delivery can also help with time sensitive shipments. If a customer needs an item before the weekend, a seller may be able to use UPS Saturday delivery options or specialized Amazon SFP 3PL fulfillment services instead of automatically upgrading to the most expensive urgent delivery service.
But there is a hard truth here: carrier availability does not fix weak fulfillment execution.
If inventory is too far from the customer, if orders are not picked and packed quickly, if cutoff times are unrealistic, or if the wrong service is selected at label creation, Saturday delivery will not save the customer experience. It may only add cost.
Weekend Delivery Depends on Fulfillment, Not Just the Carrier
Many ecommerce sellers focus on whether UPS, FedEx, or USPS can deliver on Saturday. That is only one part of the shipping process.
To use Saturday delivery effectively, a seller needs to answer several operational questions, especially if they also sell on marketplaces with strict fast-shipping standards such as Walmart’s TwoDay and ThreeDay delivery requirements:
- Is the inventory close enough to the customer for ground delivery to arrive on Saturday?
- Can the warehouse process Friday and weekend orders fast enough?
- Is Saturday pickup available?
- Does the checkout promise account for weekends and holidays?
- Are customer support teams prepared to explain Saturday and Sunday delivery differences?
- Does the selected service support the promised delivery date?
- Are additional fees worth the customer experience benefit, and do you have proof from fulfillment service reviews that your partners can consistently deliver on those promises?
This is where distributed fulfillment can make a meaningful difference. When inventory is placed closer to customers, more orders can reach buyers quickly by ground. Leveraging specialized order fulfillment services for ecommerce companies can reduce the need to pay extra for air services and make fast delivery more affordable.
How Cahoot Helps Sellers Compete on Fast Delivery
Cahoot does not control UPS delivery days, and Saturday delivery is ultimately determined by the carrier, service, destination, and shipment details.
Where Cahoot can help is in the fulfillment strategy behind the shipment. Ecommerce brands need more than a carrier that offers Saturday delivery. They need ecommerce fulfillment software that supports inventory placement, order routing, fulfillment execution, and shipping choices that make fast delivery practical and cost-aware.
With a smarter fulfillment network and multi-carrier shipping software for ecommerce, sellers may be able to reach more customers in fewer days, use ground services more effectively, reduce unnecessary expedited shipping costs, and set more accurate delivery expectations at checkout. That is the operational advantage: not simply knowing that UPS delivers on Saturdays, but building a fulfillment process that can use weekend delivery without damaging margins.
How to Check Whether Your UPS Package Will Arrive Saturday
If you are waiting for a UPS package, follow these steps:
- Check your UPS tracking number.
- Review the selected service.
- Look at the estimated delivery date.
- Confirm whether the destination is eligible for Saturday delivery.
- Watch for updates such as “out for delivery” or “delivery attempted.”
- Contact UPS or the shipper if the shipment is urgent.
If you are an ecommerce seller, check Saturday delivery availability during label creation or rate shopping. Do not rely on a general rule. Confirm the service, destination, final cost, and any added charge before presenting Saturday delivery as an option to customers, and make sure your multi-carrier shipping software accurately reflects those options.
The Bottom Line on UPS Saturday Delivery
UPS does deliver on Saturdays for many residential and commercial packages. Saturday delivery may apply to UPS Ground, air services, and other UPS delivery options depending on the shipment, destination, and selected service.
But UPS Saturday delivery is not the same as universal weekend delivery. Standard UPS Sunday delivery is not available, Saturday pickup is separate from Saturday delivery, and the final cost can vary.
For consumers, the best move is to check the tracking number. For ecommerce sellers, the better move is to build a fulfillment operation that can use Saturday delivery intelligently: close inventory, realistic cutoffs, accurate checkout promises, and carrier choices that balance speed with cost.
FAQs About UPS Saturday Delivery
Does UPS deliver on Saturdays?
Yes, UPS delivers on Saturdays for many residential and commercial packages. Availability depends on the selected service, destination, package type, and shipper settings.
Does UPS deliver on Sundays?
Standard UPS delivery does not usually run on Sunday. UPS says it offers Monday through Saturday delivery service for residential and commercial parcels and that there are no Sunday deliveries.
Does UPS Ground deliver on Saturday?
UPS Ground may deliver on Saturday for many residential packages, depending on the shipment and destination. Check the tracking number or confirm availability during label creation.
Does UPS 2nd Day Air deliver on Saturday?
UPS lists Saturday delivery as available for UPS 2nd Day Air, but availability can depend on destination and shipment details.
How much does UPS Saturday delivery cost?
UPS Saturday delivery cost can vary based on service, package weight, destination, account settings, and whether Saturday delivery is included or added. Check UPS rates during label creation or contact UPS for the final cost.
Does UPS offer Saturday pickup?
Yes, UPS offers Saturday pickup options, including Saturday package car pickup services. Pickup availability can vary by location and business setup.
What is the latest time UPS delivers on Saturday?
UPS says most packages are generally delivered by 8 p.m. Actual delivery times can vary by route, volume, weather, service, and destination.
Can ecommerce sellers offer Saturday delivery at checkout?
Yes, but only if the selected carrier service, destination, fulfillment cutoff, pickup schedule, and delivery estimate support it. Sellers should avoid promising Saturday delivery unless they can confirm availability and cost.
Is Saturday delivery guaranteed?
Not always. Some services may include specific delivery commitments, while others provide estimated delivery windows. Check the selected service and UPS tracking details for the most accurate information.
Written By:
Rinaldi Juwono
Rinaldi Juwono leads content and SEO strategy at Cahoot, crafting data-driven insights that help ecommerce brands navigate logistics challenges. He works closely with the product, sales, and operations teams to translate Cahoot’s innovations into actionable strategies merchants can use to grow smarter and leaner.
Turn Returns Into New Revenue
Related Articles
What Is Demand Planning? How It Impacts Inventory, Forecasting, and Profitability
Demand planning is the process of estimating future customer demand so that a business can align its inventory, procurement, and operations to meet that demand without carrying mor...
Why 100% P2P Adoption Is the Wrong Goal
Peer-to-peer returns let customers send eligible returned items directly to other customers instead of routing every package back through the warehouse, cutting shipping and proces...
Walmart Officially Allows Amazon Multi-Channel Fulfillment (MCF)
Big news for multichannel sellers: Walmart now officially allows Amazon Multi-Channel Fulfillment (MCF), Amazon’s service for using its fulfillment network to ship orders from mult...
What Is JIT Management? Benefits, Risks, and When It Works

JIT management, short for Just-in-Time, is an inventory and production approach where goods are acquired, produced, or replenished only when they are needed to fulfill demand, rather than being stockpiled in anticipation of future orders. JIT is a strategy for optimizing business operations by streamlining workflows and improving efficiency across the company. The core premise is simple: just-in-time inventory held in a warehouse costs money without generating revenue, so the goal is to have as little of it as possible while still meeting customer demand.
In practice, JIT is not primarily an inventory strategy. It is a bet on supply chain reliability. The JIT inventory methodology is a production and inventory management strategy focused on minimizing inventory levels by producing and ordering goods only as needed. The entire model functions on the assumption that suppliers will deliver on time, that demand can be forecast accurately enough to trigger replenishment at the right moment, and that nothing in the chain between raw material and customer will break. When those assumptions hold, JIT delivers real and measurable operational advantages. When they do not, the absence of buffer inventory means the impact of any disruption is immediate and total.
How JIT Management Works
JIT operates on a pull system rather than a push system. In a traditional push inventory model, a business forecasts what it expects to sell, builds or orders that quantity, and pushes it into stock ahead of demand. In a JIT pull model, production or replenishment is triggered by actual demand signals rather than forecasts. Nothing is made or ordered until something downstream signals that it is needed.
The most well-known implementation is Toyota’s Production System, developed in Japan in the 1950s and 1970s. Toyota used Kanban cards, visual signals that triggered replenishment of components on the production line only when existing supply was depleted. The JIT manufacturing and manufacturing process at Toyota are optimized using the JIT method, which focuses on producing goods only as needed to minimize excess inventory and reduce costs. The goal was to produce exactly what was needed, in exactly the right quantity, at exactly the right time. Toyota received components from suppliers often within hours of installation on the assembly line, eliminating the warehouse of parts that most manufacturers assumed was necessary.
Dell provides the most widely cited modern example. Rather than building computers in advance and hoping customers would buy the configurations in stock, Dell assembled machines only after customers placed orders. Dell uses expected sales to align inventory with demand, ensuring components are ordered and stocked based on anticipated customer purchases. Components were delivered from suppliers in tight windows aligned with the production schedule. This allowed Dell to avoid the inventory obsolescence that plagued competitors who stocked finished goods that were already outdated by the time they sold.
For ecommerce and retail operations, JIT translates into ordering replenishment inventory from suppliers in smaller, more frequent batches timed to current sales velocity, rather than large periodic orders based on forecasted future demand. Inventory management systems and advanced ecommerce shipping software and ecommerce fulfillment software with smart inventory placement help monitor stock levels and reduce inventory waste by providing real-time tracking and automated alerts, ensuring that inventory is replenished only as needed. The warehouse or fulfillment center carries less on hand at any given time, which reduces storage costs, cuts the risk of dead stock, and keeps working capital from being locked in unsold goods.
The mechanics require three things to function: accurate demand forecasting to know when to trigger a replenishment order, reliable suppliers who can deliver within tight lead-time windows, and real-time inventory visibility to know when stock is reaching the reorder point. The importance of time JIT inventory is critical in ensuring timely replenishment, as goods must arrive exactly when needed to avoid stockouts and minimize inventory waste. Remove any one of those and the system begins to fail.
Supply Chain Considerations
Implementing a JIT inventory system hinges on the strength and reliability of your entire supply chain. Unlike traditional inventory strategies that rely on buffer stock to absorb shocks, JIT inventory management demands that every link in the chain—from raw materials to finished goods—operates with precision and minimal delay. This means that even minor supply chain disruptions, such as transportation delays or supplier hiccups, can halt production and jeopardize customer satisfaction, which is why robust order fulfillment integrations with marketplaces and shipping carriers are so important for real-time coordination.
To build a resilient JIT inventory management system, businesses must prioritize relationships with reliable suppliers who can consistently deliver on tight schedules. Establishing clear communication channels and performance expectations with suppliers is essential, as is developing contingency plans for unexpected disruptions. For example, identifying alternative suppliers or diversifying sourcing regions can help mitigate the risk of a single point of failure in your supply chain, and addressing key obstacles to building an efficient supply chain helps ensure your lean strategy remains resilient.
Accurate demand forecasting is another cornerstone of effective JIT inventory management. By analyzing sales trends, seasonality, and market shifts, businesses can align production schedules and inventory levels more closely with actual customer demand. This reduces the risk of excess inventory and unsold stock, while ensuring that enough inventory is always available to meet customer orders. Leveraging inventory management software with real-time inventory tracking and automated alerts can further enhance visibility and control, allowing businesses to respond quickly to changes in demand or supply chain conditions.
The Toyota Production System (TPS) exemplifies how integrating continuous improvement and waste reduction into every aspect of the production process—including supply chain management—can yield substantial cost savings and efficiency gains. TPS’s focus on minimizing waste, streamlining inventory movements, and fostering a culture of ongoing improvement has set the standard for JIT inventory systems worldwide. By adopting similar principles, businesses can tailor their JIT strategy to their unique operational needs, driving both production efficiency and customer satisfaction.
For ecommerce businesses, managing a JIT inventory system presents unique challenges. Inventory must often be tracked across multiple sales channels and fulfillment centers, making real-time visibility and coordination even more critical. Implementing robust inventory management software, leveraging order fulfillment services for ecommerce companies, and choosing the right warehousing services provider can automate replenishment, monitor inventory levels across locations, and help manage inventory during demand spikes—ensuring that customer demand is met without accumulating excess stock or incurring unnecessary storage costs.
Ultimately, the success of a JIT inventory management system depends on the ability to manage inventory proactively across the entire supply chain. By investing in reliable supply chain partnerships, leveraging technology for real-time inventory control, and continuously refining supply chain processes, businesses can reduce inventory costs, minimize waste, and improve production efficiency. Staying current with logistics, fulfillment, and supply chain events and educational webinars on ecommerce logistics and multi-channel fulfillment can also inform strategic improvements. This not only enhances customer satisfaction but also provides a competitive edge in today’s fast-paced markets.
The Real Benefits of JIT
The financial case for JIT is straightforward when the conditions support it.
Reduced inventory holding costs are the most direct benefit. Inventory sitting in a warehouse generates costs that accumulate continuously: storage fees, insurance, labor to manage and count it, and the risk of deterioration or obsolescence. Industry estimates consistently place inventory carrying costs at 20 to 30 percent of inventory value per year. A business holding $500,000 in average inventory is spending $100,000 to $150,000 annually just to keep it there. JIT reduces the average inventory on hand, which compresses those costs proportionally. Additionally, JIT helps minimize labor costs by reducing the amount of handling and storage required, streamlining operations and lowering overall labor expenses.
Improved cash flow follows directly. Capital that would have been tied up in excess stock is freed for other uses: marketing, product development, operational improvements, or debt reduction. For growth-stage ecommerce brands where cash flow is often the binding constraint, this is a meaningful advantage. Every dollar not sitting on a shelf is a dollar available to fund growth. By maintaining minimal inventory, JIT helps reduce costs and improve efficiency, ensuring resources are used more effectively across the business.
Reduced dead stock and obsolescence risk is a benefit that compounds over time. Brands that consistently overorder relative to demand accumulate slow-moving inventory that eventually becomes unsellable. JIT’s discipline of ordering to actual demand rather than optimistic forecasts prevents the structural overbuying that generates dead stock. For product categories with short life cycles, like consumer electronics, seasonal apparel, or trend-driven goods, this is operationally significant. Regularly identifying and clearing obsolete inventory is also crucial for optimizing storage space, reducing costs, and improving overall inventory efficiency.
Improved quality control emerges as a secondary benefit, particularly in manufacturing contexts. When production runs are smaller and more frequent, defects are identified faster because there is less in-process inventory to absorb and conceal them. A production defect on a batch of 100 units is caught after 100 units. On a batch of 10,000 units, it may not surface until the entire batch has moved downstream. JIT practices contribute to minimizing costs and improve efficiency throughout the production process by enabling faster detection and correction of issues.
The Risks That Are Systematically Underweighted
The risks of JIT are not theoretical. They are structural, and recent supply chain history has illustrated them at scale.
Supply chain disruption is the defining vulnerability. JIT eliminates the buffer inventory that absorbs shocks. When a supplier misses a delivery, when a port is congested, when a weather event delays inbound freight, or when a carrier capacity crunch extends lead times, a JIT operation has no reserve to draw from. Production halts. Fulfillment pauses. Customer orders cannot ship. The 1997 Aisin fire, which destroyed the sole facility supplying Toyota’s brake valves, nearly brought the entire Toyota production network to a standstill within days because there was no safety stock. The COVID-19 pandemic produced the same phenomenon at global scale, exposing how many industries had adopted JIT principles without building the supplier redundancy and geographic diversification that Toyota spent decades developing alongside its lean practices. Additionally, if demand drops unexpectedly, the lack of buffer inventory can result in unsold inventory that cannot be easily stored or managed—an issue frequently highlighted in news about evolving ecommerce fulfillment networks and partnerships.
Demand forecasting error is amplified, not buffered. In a JIT system, an unexpected demand spike cannot be met from stock because there is no meaningful stock to draw from. When demand exceeds forecast, the response is entirely dependent on how fast the supply chain can accelerate. If supplier lead times are four weeks and demand spikes in week one, customers wait four weeks or go elsewhere. Brands that adopt JIT without significantly investing in forecast accuracy essentially exchange one operational risk for another.
Single-supplier dependency is a concentration risk. JIT typically requires close, reliable relationships with a small number of preferred suppliers to achieve the lead-time precision the model demands. That concentration creates fragility. A supplier experiencing a labor dispute, a quality failure, a financial crisis, or a natural disaster puts the entire JIT-dependent operation at risk. Toyota’s own experience during semiconductor shortages in 2021 and 2022 demonstrated that even decades of supply chain mastery cannot fully immunize against disruption when the failure is systemic across an entire industry.
Loss of volume discounts is a real but often overlooked cost. JIT’s smaller, more frequent orders sacrifice the per-unit pricing advantage that comes with large batch purchases. Depending on the product and supplier relationship, this cost can partially or fully offset the holding cost savings that JIT is supposed to deliver. However, for businesses with limited storage space, the benefits of reducing inventory levels and minimizing the need for additional storage space may outweigh the loss of volume discounts.
JIT also helps optimize storage space by reducing the need for large warehouses, allowing businesses to operate more efficiently and lower their storage costs.
The Contrarian View: JIT Is Widely Misunderstood
One of the most persistent misconceptions about JIT is that its core purpose is to minimize inventory. This framing is wrong, and it is the source of much of the criticism JIT received following supply chain failures during the pandemic. While maintaining minimal inventory is a visible feature of JIT systems, the true goal is to create a responsive, efficient process that meets customer demand without unnecessary waste.
Toyota did not design JIT to minimize inventory. It designed JIT to expose waste and eliminate the root causes of production problems. Inventory, in Toyota’s framework, is a form of waste because it masks defects, covers up process inefficiencies, and hides supplier reliability issues. JIT forces problems to the surface by removing the buffer that conceals them. When a supplier is chronically unreliable, a JIT system will surface that unreliability immediately. In a high-inventory environment, the same unreliability can remain invisible for months because excess stock absorbs the delays. Just-in-time manufacturing, as developed in the Toyota Production System, focuses on waste reduction and continuous process improvement, not simply on reducing inventory levels.
The companies that adopted JIT principles purely to reduce inventory costs, without building the supplier relationships, process discipline, and continuous improvement culture that Toyota spent decades developing, were running a cost-reduction program, not a JIT program. They assumed the benefits without accepting the systemic commitments that make those benefits sustainable. When disruptions hit, they had the vulnerabilities of JIT without its underlying resilience mechanisms.
This matters for ecommerce brands evaluating JIT because the question is not whether to order less inventory. It is whether the entire operational and supplier ecosystem can support a lean model reliably enough to justify the absence of a buffer. For Amazon-focused brands, this includes aligning JIT practices with FBA constraints and maintaining a healthy Inventory Performance Index (IPI) score so storage limits do not undermine lean inventory strategies.
JIT in Ecommerce vs Manufacturing
JIT originated in manufacturing, where production cycles are relatively predictable, supplier relationships are long-term and deeply integrated, and demand signals from the assembly line are clear and continuous. These conditions are not replicated in most ecommerce environments, particularly in warehouse processes like pick and pack fulfillment for ecommerce orders.
Manufacturing JIT works because the trigger for replenishment is a physical signal in a controlled production process. Ecommerce JIT is working against consumer demand variability, longer and less predictable supplier lead times, seasonal and promotional spikes, and a customer base that expects immediate fulfillment regardless of what is in stock.
That does not mean JIT principles have no application in ecommerce. For stable, high-velocity SKUs with reliable supplier lead times, ordering in smaller, more frequent batches rather than large quarterly positions reduces holding costs and dead stock risk. For perishable goods or products with short shelf lives, JIT is essentially a necessity rather than a choice. For brands with limited warehouse space, reducing on-hand inventory through tighter replenishment cycles is operationally valuable. JIT also helps businesses optimize storage space by minimizing the amount of inventory kept on hand, freeing up valuable warehouse capacity and improving overall efficiency, which may eventually justify shifting from an in-house warehouse to a third-party logistics (3PL) provider.
Where JIT creates acute risk in ecommerce is in seasonal or trend-sensitive products where demand is inherently spiky and unpredictable, or where supplier lead times are long enough that a reorder triggered by current demand cannot arrive before stock depletes. The classic scenario: a brand operating near-JIT gets a viral social moment that drives 10x normal order volume. Supplier lead time is six weeks. The brand stocks out within 48 hours and spends six weeks apologizing to customers and watching competitors capture the demand they generated.
The practical ecommerce application of JIT is typically a hybrid: lean inventory positions on stable SKUs, with deliberately maintained safety stock on seasonal items, promotional inventory, and SKUs where the cost of a stockout in lost sales and customer lifetime value exceeds the carrying cost of the buffer. Effective time inventory management is crucial here, as coordinating replenishment and fulfillment based on real-time demand and operational timing helps minimize costs and increase efficiency and can even help turn ecommerce order fulfillment into a profit driver. The goal is not purity of the JIT model. It is the right amount of inventory for each SKU given its demand profile and supply chain reliability.
Frequently Asked Questions
What does JIT management mean?
JIT stands for Just-in-Time. JIT management is an inventory and operations approach where goods are ordered, produced, or replenished only when they are needed to fulfill actual demand, rather than being stocked in advance. The goal is to minimize inventory on hand while still meeting customer orders without delay.
Where did JIT originate?
JIT was developed as part of Toyota’s Production System in Japan in the decades following World War II. Toyota refined the approach through decades of supplier relationship building, process discipline, and continuous improvement culture. It became widely adopted in manufacturing globally during the 1980s and has since been adapted for retail and ecommerce contexts.
What are the main benefits of JIT inventory management?
The primary benefits are reduced inventory holding costs, improved cash flow from freeing capital previously tied up in stock, lower risk of dead stock and obsolescence, and greater operational efficiency. In manufacturing, JIT also tends to surface quality defects faster because smaller batch sizes make problems immediately visible.
What are the biggest risks of JIT?
The defining risk is supply chain disruption. JIT eliminates the buffer inventory that absorbs delays, so any failure in the supply chain, whether a supplier issue, a transportation delay, or a demand spike, has an immediate and direct impact on fulfillment. Overreliance on demand forecast accuracy, single-supplier concentration, and loss of volume discount pricing are additional structural risks.
Does JIT work for ecommerce businesses?
JIT principles can be applied in ecommerce, but rarely in their pure form. Ecommerce demand is more variable than manufacturing production schedules, and supplier lead times are often too long to support true JIT replenishment for all SKUs. Most ecommerce operations benefit from a hybrid approach: lean inventory positions on stable, predictable SKUs and deliberately maintained safety stock on seasonal, trend-sensitive, or high-value items where stockout costs are significant, especially for brands evaluating their Shopify order fulfillment options and 3PL strategies.
How is JIT different from just-in-case inventory management?
Just-in-case inventory management is the traditional approach of holding safety stock and buffer inventory to protect against demand variability and supply chain disruption. JIT replaces that buffer with reliable supply chains and accurate demand signals. JIT prioritizes cost efficiency and eliminates waste. Just-in-case prioritizes service continuity and resilience. Most sophisticated operations today use elements of both depending on the product and risk profile.
What conditions need to be in place for JIT to work effectively?
JIT requires accurate demand forecasting, reliable suppliers with consistent lead times, real-time inventory visibility, and strong supplier relationships. It also requires an organizational commitment to continuous improvement and the process discipline to identify and address problems before buffer inventory can mask them. Businesses without these foundations in place are taking on JIT’s risks without the operational infrastructure to manage them.
Written By:

Indy Pereira
Indy Pereira helps ecommerce brands optimize their shipping and fulfillment with Cahoot’s technology. With a background in both sales and people operations, she bridges customer needs with strategic solutions that drive growth. Indy works closely with merchants every day and brings real-world insight into what makes logistics efficient and scalable.
Turn Returns Into New Revenue
Related Articles
What Is Demand Planning? How It Impacts Inventory, Forecasting, and Profitability
Demand planning is the process of estimating future customer demand so that a business can align its inventory, procurement, and operations to meet that demand without carrying mor...
Why 100% P2P Adoption Is the Wrong Goal
Peer-to-peer returns let customers send eligible returned items directly to other customers instead of routing every package back through the warehouse, cutting shipping and proces...
Walmart Officially Allows Amazon Multi-Channel Fulfillment (MCF)
Big news for multichannel sellers: Walmart now officially allows Amazon Multi-Channel Fulfillment (MCF), Amazon’s service for using its fulfillment network to ship orders from mult...
What Is Dead Stock? Causes, Risks, and How to Avoid It
In this article
21 minutes
- What Dead Stock Actually Is
- The Upstream Causes Most Brands Miss
- The Financial Impact: What It Actually Costs
- The Contrarian View: Dead Stock Is Not Always a Failure
- Industry-Specific Challenges
- Prevention: Where the Real Work Happens
- Creating a Dead Stock Prevention Culture
- What to Do When Dead Stock Has Already Accumulated
- Conclusion
- Frequently Asked Questions
Dead stock is inventory that has not sold and is no longer expected to sell. It sits in warehouse space, generates no revenue, and accumulates costs every day it remains. For ecommerce brands and operations leaders, dead stock is one of the most financially damaging conditions a business can carry, precisely because it builds slowly and quietly until its weight becomes impossible to ignore.
The important reframe is this: dead stock is not primarily a warehouse problem. It is the result of upstream decisions that were made weeks, months, or even purchasing cycles before the product ever arrived on a shelf. Understanding dead stock means understanding how MOQ commitments, demand forecasting failures, and purchasing behavior compound over time into inventory that has no path to revenue.
What Dead Stock Actually Is
Dead stock refers to products that are new, often still in original packaging, but have no realistic prospect of selling at or near their original price. This distinguishes it from returned inventory, which came back from customers and may be resalable, and from safety stock, which is intentional reserve inventory held against demand uncertainty.
A product becomes dead stock when the conditions that made it purchasable no longer exist. The trend moved on. The season ended. A newer version replaced it. The marketing push that was supposed to drive demand never materialized. The demand forecast that justified the purchase order turned out to be significantly wrong.
In the fashion and sneaker industry, the term “deadstock” carries a different meaning entirely. In that context, deadstock refers to unworn, discontinued shoes or apparel still in original condition, often valued precisely because of their rarity. Deadstock items in these markets are typically brand-new, unsold inventory, often with their original tags attached, which makes them more desirable and authentic, especially in resale and vintage markets. In fashion, deadstock fabric refers to unsold, past-season fabrics—often leftover from previous collections—that can be repurposed or sold at a discount. These fabrics are valuable resources for designers and manufacturers looking to reduce waste and create unique pieces. That secondary market meaning is a reminder that inventory with no demand in one channel can sometimes find demand elsewhere, a point worth returning to when discussing remediation.
The Upstream Causes Most Brands Miss
Dead stock is treated too often as an inventory management failure when it is actually a purchasing and planning failure that shows up in the warehouse and impacts the entire company.
Minimum order quantities are one of the most direct structural causes. When a supplier requires a company to order 1,000 units to secure a viable unit cost, and realistic customer demand for that SKU is 400 units over the same period, 600 units of potential dead stock are created at the moment the purchase order is signed. The problem is not that the product failed to sell. The problem is that the MOQ committed the company to inventory it could not absorb. This happens repeatedly across catalogs when companies accept supplier MOQs without stress-testing them against actual demand data.
Demand forecasting errors are the other primary cause. Over-ordering and failing to accurately predict how much inventory is needed to meet customer demand are leading reasons companies accumulate dead stock. When a company overestimates how many units of a product will sell in a given period, it orders more than demand can absorb. Inaccurate demand forecasting can lead to dead stock accumulation when businesses miscalculate future demand. Optimistic sales projections, particularly for new products without historical data, new colorways or variants added speculatively, or products tied to a trend that the company assumed had more runway than it did, all generate excess stock that ages into dead stock. Poor forecasting is not always avoidable, but systematic overconfidence in projections is a pattern that can be identified and corrected.
Seasonality without discipline creates predictable dead stock cycles. Seasonal products have defined sell-through windows. If a company orders too much of a seasonal item, or orders it too late in the season, the inventory arrives into a closing window and cannot be cleared before demand drops off. Failing to adjust purchasing patterns for seasonal fluctuations can result in excess stock that remains unsold. What remains becomes dead stock unless it can be carried to the following season, at additional holding cost, with the risk that demand does not return at the same level. Seasonality factors play a crucial role in dead stock creation, particularly when companies do not align inventory with seasonal customer demand.
Supply chain disruption responses generated significant dead stock across many companies during and after 2020 to 2022. Companies often over-order safety stock to meet future needs, which can become excess inventory if demand normalizes. Brands that panic-ordered large quantities to buffer against supply uncertainty found themselves holding excess inventory after demand patterns normalized. Safety stock acquired under uncertainty became structural overstock when the threat passed. Supply chain disruptions have emerged as a significant contributor to dead stock in recent years.
Returns that never reenter the sellable inventory pool contribute to dead stock accumulation in a less obvious way. A returned item that is not inspected, refurbished, and relisted promptly may sit in a returns queue until its resale window closes. At scale, poor returns processing is a reliable secondary source of dead stock.
It is important to note the difference between slow-moving products and dead stock: slow-moving products may eventually sell, while dead stock remains unsold and completely stagnant. Monitoring slow-moving products helps companies prevent them from turning into dead stock and optimize inventory turnover.
The Financial Impact: What It Actually Costs
The direct cost of dead stock starts with the capital tied up in unsold units. For a brand that purchased 500 units of a product at $40 each, $20,000 in working capital is frozen the moment those units become unsellable. The most obvious cost of dead stock is lost revenue, and these direct costs immediately impact the company’s account and overall profitability. That capital cannot fund new product development, marketing campaigns, or reorders of faster-moving SKUs. It is simply gone from productive use.
Carrying costs compound the problem. A company’s total carrying costs can tie up as much as 20% to 30% of its capital at any given time. Carrying costs typically range from 15% to 30% of the inventory’s value annually, including expenses related to warehouse space, insurance, taxes, and opportunity costs of capital. Industry estimates consistently put inventory holding costs at 20 to 30 percent of inventory value per year. That means $20,000 in dead stock is generating $4,000 to $6,000 in annual holding costs on top of the sunk purchase cost, covering warehouse space, utilities, insurance, and the labor required to manage and count stock that is not moving. The longer an item is stored before selling it, the higher the item’s carrying costs become.
For brands on third-party fulfillment platforms, particularly Amazon FBA, the financial penalty is more explicit. Amazon’s long-term storage fees and aged inventory surcharges impose escalating charges on units that have not sold within defined windows. Dead stock in an FBA warehouse does not just sit passively. It generates monthly charges that erode the residual value of the inventory until the cost of removal or disposal exceeds the cost of simply paying the ongoing fees.
When dead stock is finally cleared, the mechanism for doing so almost always destroys margin. A clearance sale at 50 percent off recovers half the purchase cost, but none of the carrying cost already absorbed. Liquidation at pennies on the dollar recovers a fraction of the investment. Donation to charity provides a potential tax benefit but no revenue. Write-off closes the accounting but confirms the total loss. Dead stock not only costs money to obtain, but also costs you the profit from its sale that you were counting on.
A practical example illustrates the full picture. An electronics brand purchases 300 units of a tablet accessory for $50 each, forecasting strong demand based on early sales of a related product. The accessory sells 80 units in the first two months. Sales stall. The product sits for six months before the brand accepts it is unlikely to move at full price. By that point, the 220 unsold units represent $11,000 in frozen capital. Six months of carrying costs at 25 percent annually add approximately $1,375. A clearance sale at 40 percent of original price recovers roughly $4,400. The total loss on a purchase that seemed reasonable at the time is approximately $8,000, before accounting for the warehouse space consumed and the staff time invested in auditing, relisting, and eventually clearing the inventory.
Dead stock can lead to significant opportunity costs as money and resources tied up in dead inventory are not available to invest in inventory that could bring in more profits. This creates opportunity costs for the company, as warehouse space could otherwise be dedicated to new product lines or value-added services that might generate higher profit margins. Dead stock also creates multiple cascading inefficiencies throughout warehouse operations, complicating inventory counts and increasing the likelihood of errors in inventory records.
The Contrarian View: Dead Stock Is Not Always a Failure
Most inventory advice treats dead stock as a symptom of poor management, and in the majority of cases that framing is accurate. But a more nuanced view recognizes that some dead stock is the cost of doing business with range and ambition.
A brand that never generates dead stock is a brand that never takes a position on a new product, never tests a new category, and never bets on a trend. Pure conservatism in purchasing protects against dead stock but also limits upside. The goal is not zero dead stock. The goal is dead stock at a rate that reflects rational risk-taking rather than systematic forecasting failure or structural overcommitment via MOQ.
The brands that manage this best treat dead stock as a measurable operational metric with an acceptable threshold. They set a target for dead stock as a percentage of total inventory value, monitor it regularly, and investigate when it rises above that threshold. Regular dead stock takes—inventory audits focused on identifying unsellable or slow-moving inventory items—help companies pinpoint which inventory items have become dead stock and require action to minimize storage costs and optimize warehouse space. They distinguish between dead stock generated by deliberate product bets that did not pay off and dead stock generated by preventable errors in purchasing or demand planning. The first is a cost of growth. The second is waste.
Industry-Specific Challenges
Dead stock is a universal risk, but its causes and consequences can vary dramatically depending on the industry. In fashion, for example, the rapid turnover of trends means that stock can become dead almost overnight if consumer preferences shift or a season ends unexpectedly. Retailers in this space often face the challenge of predicting which styles will resonate, and overordering on a trend that fizzles can leave them with racks of unsellable merchandise. To mitigate this risk, many fashion brands are adopting “buy now, wear now” models, focusing on smaller, more frequent orders that align closely with current demand.
In the electronics industry, the pace of technological innovation creates a different kind of dead stock risk. New product launches and frequent upgrades can render existing inventory obsolete before it ever reaches customers. For electronics manufacturers and retailers, designing products with modular components or upgradable features can help extend the market life of inventory and reduce the volume of dead stock. Additionally, close monitoring of product life cycles and timely markdowns on older models are essential strategies for minimizing losses.
Understanding these industry-specific challenges is crucial for developing targeted approaches to dead stock management. By tailoring strategies to the unique risks of their sector, businesses can more effectively avoid accumulating dead stock and protect their bottom line.
Prevention: Where the Real Work Happens
Preventing dead stock requires changes at the purchasing and planning stage, not at the warehouse stage.
Right-sizing MOQ commitments is the most impactful single intervention for many brands. Before accepting a supplier’s minimum order quantity, a team should explicitly calculate how many weeks or months of supply that MOQ represents against realistic demand. If the MOQ requires more than 10 to 12 weeks of supply at current velocity, the risk of dead stock creation is meaningful. Negotiating lower MOQs, consolidating orders across SKUs to meet supplier thresholds, or accepting a higher per-unit cost at a lower quantity are all viable alternatives to systematically overbuying.
Demand planning grounded in data rather than optimism reduces the forecasting error that generates dead stock. This means using historical sales velocity as the primary input, applying seasonal adjustment factors based on past seasonal patterns, and treating new product projections with explicit conservatism until sales data exists. It also means separating the demand plan from the sales team’s revenue targets, which are aspirational, and building the purchasing plan around the more conservative of the two. Using inventory management software enables companies to make informed decisions about how much inventory to purchase and when, helping to prevent dead stock. Accurate demand forecasting, supported by real-time inventory visibility and analytics, is essential to prevent over-ordering and to better align inventory with future needs.
Variant discipline matters particularly for apparel, footwear, and consumer goods brands that offer products in multiple sizes, colors, or configurations. Each variant is its own SKU with its own demand profile. Adding variants speculatively, particularly colorways or sizes that have not been validated by customer data, creates multiple low-velocity SKUs where MOQ applies per variant. The resulting inventory commitment across the full variant matrix is frequently the origin of significant dead stock.
Early identification of slow-moving inventory gives a brand the maximum window to intervene before a slow-mover becomes unsellable. Inventory aging reports, velocity alerts set at 30 and 60 days of below-target turnover, and regular SKU-level reviews allow operations teams to begin clearance activity while the product still has market value. Regular inventory audits and predictive analytics can help identify products at risk of becoming dead stock by spotting early warning signs of declining demand, allowing proactive inventory adjustments. A product that has been moving slowly for 30 days can often be cleared at a modest discount. The same product at 120 days may require 60 to 70 percent off to move at all.
Managed use of alternative channels extends the clearance options available. Liquidation partners, outlet marketplaces, bundle strategies with faster-moving products, and B2B bulk buyers all represent channels that can absorb inventory at below-retail prices while recovering more than write-off value. For brands with charitable giving programs, donation of dead stock provides a tax benefit while clearing warehouse space, though the accounting treatment varies and should be confirmed with a tax advisor.
Adopting a Just-in-Time (JIT) approach can further reduce the risk of overstocking by ordering only as needed to meet existing demand, ensuring inventory levels are closely aligned with future needs.
Creating a Dead Stock Prevention Culture
Building a culture that actively works to avoid dead stock starts with organization-wide awareness and shared responsibility. Every team—from procurement and sales to marketing and warehouse operations—should understand how excess inventory and slow-moving items impact the company’s financial health and warehouse space. Regular training sessions and transparent communication about the direct and indirect costs of dead stock can help foster this awareness.
Leveraging inventory management software is a key step in this process. These tools provide real-time visibility into inventory levels, highlight slow-moving items, and generate alerts when stock is at risk of becoming dead. Regular inventory audits, supported by this technology, enable teams to identify patterns early and take corrective action—whether that means launching targeted clearance sales, bundling slow sellers with popular products, or exploring alternative sales channels such as online marketplaces or B2B buyers.
Aligning incentives is another powerful lever. For example, rewarding sales teams for moving older inventory before introducing new products encourages a focus on overall inventory health rather than just top-line sales. Cross-departmental meetings to review inventory performance and discuss strategies for improvement ensure that everyone is accountable for minimizing dead stock. By embedding these practices into daily operations, businesses can create a proactive culture that prioritizes inventory efficiency and reduces the risk of accumulating dead stock.
What to Do When Dead Stock Has Already Accumulated
For brands that are already holding significant dead stock, the priority is to stop the compounding. Every additional month of carrying costs reduces the recoverable value of the inventory. Acting early, even at a loss, is almost always better than waiting for a better opportunity that does not materialize. Utilizing alternative sales channels such as eBay, Amazon FBA, or specialized liquidation partners can help move dead stock and recover some value.
A structured clearance plan that sequences options from highest to lowest recovery is more effective than reacting opportunistically. Start with promotional pricing through your own channels, where margin recovery is highest. Move to bundle strategies that attach slow-moving units to fast-moving products without discounting either individually—this product bundling, or kitting, increases perceived value and can help recover some of the initial investment. Effective handling of dead stock can also involve offering deep discounts, selling products at a lower price through clearance sales or alternative channels to attract bargain shoppers, or liquidation. Donating dead stock can provide tax benefits and improve the company’s public image. Returning unsold inventory to suppliers or creating partnerships with other companies for co-branded promotions are additional strategies for offloading dead stock.
The accounting treatment for dead stock write-offs and write-downs has tax implications that vary by jurisdiction and business structure. The write-down reduces the book value of inventory, which affects reported gross margin and COGS. In some cases it creates a taxable loss that offsets income. Operations leaders should coordinate with their finance and tax team before executing large dead stock write-offs to ensure the timing and accounting treatment are optimized.
Conclusion
In conclusion, dead stock is a costly challenge that affects businesses of all sizes and industries, tying up valuable warehouse space, eroding profit margins, and limiting the ability to invest in new opportunities. The root causes—ranging from inaccurate demand forecasting and overordering to poor sales strategies—underscore the need for better inventory management and the adoption of inventory management software to enhance visibility and control.
By fostering a culture that values accurate demand forecasting, regular inventory reviews, and cross-functional collaboration, companies can make more informed purchasing decisions and respond quickly to shifts in market demand. Exploring alternative sales channels, such as online marketplaces, and considering charitable donations for unsold inventory can help recover some value from dead stock while freeing up space for new inventory.
Ultimately, effective dead stock management is about more than just clearing out unsold items—it’s about building a resilient supply chain and a business that can adapt to changing market conditions. With the right strategies and tools in place, businesses can protect their profit margins, optimize warehouse space, and ensure long-term sustainability and growth.
Frequently Asked Questions
What is dead stock in ecommerce?
Dead stock refers to inventory items that remain unsold and are considered unsellable, meaning they are unlikely to sell at a price that recovers the cost of goods. These inventory items typically consist of brand-new, unused products that have lost their market demand due to factors like trend shifts, poor forecasting, overordering, or the end of a seasonal window. Dead stock can also include damaged items, incorrect deliveries, leftover seasonal products, or expired raw materials.
What causes dead stock?
The most common causes are demand forecasting errors that lead to overbuying, over-ordering, MOQ commitments that force brands to purchase more inventory than demand can absorb, poor variant management that creates low-velocity SKUs, and seasonality mismanagement where inventory arrives too late in the selling window to be cleared. Over-ordering leads to dead stock accumulation when businesses order excess inventory without understanding future sales needs. Inaccurate demand forecasting can cause businesses to miscalculate future demand, resulting in excess inventory that becomes dead stock. Seasonality factors play a crucial role in dead stock creation, particularly when businesses fail to adjust their purchasing patterns to accommodate seasonal fluctuations in demand. Supply chain disruptions that prompted large precautionary orders have also been a significant structural cause for many brands in recent years, as companies over-order safety stock that later becomes excess inventory.
How does dead stock affect cash flow?
Dead stock locks working capital into inventory that generates no revenue. That capital cannot be reinvested in faster-moving products, marketing, or operations, resulting in an opportunity cost as resources are tied up in dead inventory instead of being used for more profitable inventory. Carrying costs continue to accumulate on unsold inventory at a rate of 20 to 30 percent of inventory value per year, meaning dead stock actively erodes cash flow beyond the initial purchase cost. Additionally, inventory that does not turn over within a fiscal year is typically classified as a liability in the company’s account, further impacting overall financial health.
How is dead stock different from slow-moving inventory?
Slow-moving products are items that sell below target velocity but still have a realistic chance of being sold at or near full price. In contrast, dead stock refers to inventory that remains completely stagnant and unsellable, with no realistic demand left. The distinction is important: while slow-moving products may eventually sell and can often be recovered through promotion or repositioning, dead stock typically requires clearance, liquidation, or write-off.
Can dead stock be sold or recovered?
In most cases, some recovery is possible. Selling products at a lower price through clearance sales or discount sections can help offload dead stock and attract bargain shoppers. Utilizing alternative sales channels such as eBay, Amazon FBA, or specialized liquidation partners can also help move dead stock and recover some costs. Bundle strategies, where dead stock units are combined with popular items, can help recover some of the initial investment without a headline discount. Liquidation partners and outlet marketplaces recover less but move volume at scale. Charitable donation provides a potential tax benefit in exchange for no revenue. The earlier recovery action is taken, the higher the recovery rate.
How do you prevent dead stock from building up?
Prevention starts at the purchasing stage. Right-sizing MOQ commitments against realistic demand data, using historical sales velocity rather than optimistic projections as the foundation for demand plans, adding new variants conservatively, and setting inventory aging alerts that trigger review before slow-movers become unsellable are the most reliable prevention strategies.
Leveraging inventory management software can help track stock levels in real time and prevent dead stock accumulation. Predictive analytics can identify products showing early warning signs of declining demand, enabling businesses to make informed decisions and proactively adjust inventory before items become dead stock. Regular inventory audits are also important, as they help identify slow-moving items early, allowing for timely action.
Regular SKU-level performance reviews ensure that underperforming products are identified and addressed before carrying costs compound.
What is the difference between dead stock and deadstock in fashion?
In general ecommerce and retail operations, dead stock refers to unsold inventory with no realistic path to sale at original price, representing a financial liability. Dead stock can include seasonal products, outdated technology, perished goods, overordered merchandise, and unsuccessful product lines.
In the fashion and sneaker industry, “deadstock” (or deadstock fabric) describes unworn, discontinued items or past-season, unsold fabrics leftover from previous collections that can be repurposed or sold at a discount. These deadstock items often retain their original tags, indicating they are brand-new and unused, which makes them more desirable and authentic, especially in the resale and vintage markets. The same word describes opposite conditions: worthless excess in one context and premium scarcity in another.
Written By:
Indy Pereira
Indy Pereira helps ecommerce brands optimize their shipping and fulfillment with Cahoot’s technology. With a background in both sales and people operations, she bridges customer needs with strategic solutions that drive growth. Indy works closely with merchants every day and brings real-world insight into what makes logistics efficient and scalable.
Turn Returns Into New Revenue
Related Articles
What Is Demand Planning? How It Impacts Inventory, Forecasting, and Profitability
Demand planning is the process of estimating future customer demand so that a business can align its inventory, procurement, and operations to meet that demand without carrying mor...
Why 100% P2P Adoption Is the Wrong Goal
Peer-to-peer returns let customers send eligible returned items directly to other customers instead of routing every package back through the warehouse, cutting shipping and proces...
Walmart Officially Allows Amazon Multi-Channel Fulfillment (MCF)
Big news for multichannel sellers: Walmart now officially allows Amazon Multi-Channel Fulfillment (MCF), Amazon’s service for using its fulfillment network to ship orders from mult...
What Is MOQ? Minimum Order Quantity Explained for Ecommerce
In this article
18 minutes
- Introduction to MOQ
- How Minimum Order Quantity Works in Practice
- Types of MOQs
- The Real Cost of a High MOQ
- Low Minimum Order Quantities
- Break Even Point
- MOQ and Dead Stock: A Direct Line
- Inventory Management Software
- Calculating MOQ Fit Before You Commit
- How to Negotiate MOQ With Suppliers
- Managing MOQ Across a Multi-SKU Catalog
- Frequently Asked Questions
MOQ, or minimum order quantity, is the smallest order a supplier will accept, often defined as the smallest number of units you can order at once. For ecommerce brands, it is one of the most consequential variables in inventory planning because it determines not just how much you buy, but how much capital you expose per SKU before a single unit sells.
Most operators encounter MOQ as a supplier constraint and treat it like a fixed rule. The more useful frame is to treat it as a risk variable, with the important distinction that a supplier’s MOQ is not the same as the quantity a buyer would ideally order for its own business. Both the seller and the buyer must consider MOQ in their inventory and supply chain planning. Every time you accept a supplier’s MOQ without stress-testing it against your demand data, you are making a bet on sell-through. Get that bet wrong often enough, and the result is dead stock, locked cash, and margin erosion that compounds quietly until it becomes a real problem.
Suppliers implement minimum order quantities to cover production costs and setup costs so each run is profitable, which means they need to sell enough units for a production run to make sense. Suppliers set their own MOQs based on their business needs, production costs, inventory constraints, profit margins, and administration costs. Setting an MOQ helps optimize the supply chain, reduce costs, improve production efficiency, and strengthen supplier relationships.
Introduction to MOQ
Minimum Order Quantity (MOQ) is a foundational concept in both business and supply chain management. At its core, MOQ refers to the smallest number of units a supplier is willing to sell in a single transaction. For ecommerce businesses, understanding minimum order quantity moq is essential for effective inventory management and maintaining a healthy supply chain. The MOQ set by a supplier directly impacts how much inventory you need to purchase, how you allocate your capital, and how you plan your inventory replenishment cycles.
A well-managed MOQ helps businesses avoid overstocking, reduce storage costs, and ensure that inventory levels align with actual customer demand. On the supplier side, MOQs are used to ensure that production runs are economically viable, covering the costs of raw materials, labor, and logistics. For buyers, knowing how minimum order quantity works is key to negotiating favorable terms, optimizing order quantities, and building strong supplier relationships. In the following sections, we’ll explore the different types of MOQs and how they affect your business operations.
How Minimum Order Quantity Works in Practice
Suppliers set MOQs to protect their own economics. Running a production batch has fixed costs regardless of volume: machine setup, raw materials procurement, labor scheduling, and quality control. The supplier’s minimum order quantity is often determined by the minimum amount needed to cover production and administration costs. Below a certain order size, those fixed costs make the transaction unprofitable for the manufacturer. The MOQ is the floor where production still makes sense for them.
From the buyer’s side, that floor becomes your ceiling for flexibility. You cannot order less than the MOQ, which means that if your projected demand sits below it, you are overbuying by definition.
Consider a straightforward example. A brand sells a seasonal candle variant that moves about 400 units per quarter. The supplier’s MOQ is 1,000 units—a high minimum order quantity. This high MOQ can create challenges for inventory turnover and demand forecasting, as the brand must buy 2.5 quarters of supply in a single purchase. If the variant underperforms, sells through slowly, or gets discontinued, 600 units sit in a warehouse generating holding costs and tying up working capital that could fund a better-performing SKU.
Both parties often negotiate MOQs based on demand forecasts, historical sales data, and purchasing power to achieve mutually beneficial terms.
That gap between the MOQ and your realistic demand forecast is where inventory risk lives.
Types of MOQs
MOQs come in two main forms: simple and complex. A simple MOQ is straightforward—it might require you to order a minimum quantity of a single product or reach a minimum dollar amount per order. For example, a supplier may require a minimum quantity of 100 units or a $500 minimum order before processing your request.
Complex MOQs, on the other hand, involve multiple conditions. These could include combinations of minimum quantities across several SKUs, minimum dollar values, or even specific packaging requirements. For instance, a supplier might require you to order at least 50 units of each color variant, or a total of 200 units across a product line, or meet a certain spend threshold.
Suppliers set these minimums to manage their production costs and maintain efficient inventory levels. By establishing MOQs, they can ensure that each production run is cost-effective, administrative tasks are streamlined, and inventory turnover remains healthy. For buyers, understanding the type of MOQ in place is crucial for planning purchases and managing inventory efficiently.
The Real Cost of a High MOQ
The sticker price of an MOQ order is not the full cost. The full cost includes everything that happens after the inventory arrives.
Inventory holding costs accumulate the moment product hits your warehouse. Storage fees, insurance, shrinkage, and the labor required to manage stock all run on the clock. For brands using third-party logistics providers or Amazon FBA, those costs are explicit and itemized. For brands running their own warehouse space, they are often underestimated because they blend into general overhead. Ordering large quantities due to a high minimum order quantity can require businesses to possibly warehouse large quantities of stock, impacting warehouse capacity and storage space.
Cash flow is the more acute problem. A high MOQ order pulls a large amount of working capital forward, often weeks or months before the inventory starts generating revenue. For a growing ecommerce brand managing multiple SKUs, stacking several high-MOQ purchases in the same period can create serious cash pressure, limiting the ability to fund marketing, new product development, or operations. High MOQs can create cash flow constraints for smaller businesses and may serve as a barrier to entry for those unable to commit to such a large volume.
Dead stock is the downstream consequence. When MOQ-driven purchases outpace actual customer demand, excess inventory does not just cost money to store. It eventually forces a decision: run a discount to clear it, write it down, or liquidate it. Each option destroys margin. The brands most vulnerable are those with broad SKU catalogs, seasonal products, trend-sensitive items, or multiple variants (sizes, colors, configurations) where demand per variant is naturally fragmented. High minimum order quantities can lead to increased carrying costs, higher average stock levels, and a greater risk of excess inventory or obsolescence if demand does not meet expectations.
Ecommerce businesses on Amazon and Walmart marketplace face an amplified version of this problem because storage fees, Inventory Performance Index (IPI)-driven storage limits, and aging penalties make excess inventory progressively more expensive the longer it sits. Sellers must proactively manage Amazon inventory performance and storage limits to avoid tying up capital in slow-moving FBA stock.
High MOQs help suppliers protect their operations from the administrative burden and reduced profitability associated with processing numerous small orders, resulting in lower administrative costs.
Bulk orders often mean lower shipping and logistics costs per item.
Low Minimum Order Quantities
Low minimum order quantities (low MOQs) offer significant advantages, especially for startups and small businesses with limited resources. With a low MOQ, businesses can test new products, respond quickly to market trends, and enter new markets without committing to large inventory purchases. This flexibility is particularly valuable for companies operating in niche or seasonal markets, where customer demand can be unpredictable.
Low MOQs also allow businesses to maintain a diverse product range without tying up too much capital or exceeding their storage capacity. However, there are trade-offs: ordering in smaller quantities can lead to higher administrative costs per unit and may reduce the cost efficiency gained from bulk purchasing. To address these challenges, businesses can negotiate with suppliers for better terms, leverage inventory management software to optimize order quantities, and implement just-in-time inventory systems to keep inventory levels lean. Many brands also revisit their broader ecommerce supply chain efficiency strategy to reduce unstable costs and process bottlenecks. By balancing the benefits and drawbacks, companies can use low MOQs to support growth while managing risk and operational costs.
Break Even Point
The break-even point (BEP) is a vital metric when determining the right MOQ for your business. It represents the point at which your total revenue matches your total costs—including both fixed and variable production costs. Understanding your break-even point helps you calculate the minimum order quantity that will cover your expenses and start generating profit.
To find your BEP, use the formula: BEP = Fixed Costs / (Selling Price – Variable Costs). This calculation allows you to see how many units you need to sell at a given price to cover all your costs. By factoring in your MOQ requirements, you can determine whether your planned order size will help you reach profitability or if you need to adjust your MOQ strategy. Analyzing the break-even point ensures that your inventory levels are aligned with your business goals, minimizes total inventory costs, and supports healthy profit margins. This approach helps you make informed decisions about production, purchasing, and inventory management, ensuring your business remains financially sustainable while also creating room to optimize overall order fulfillment costs.
MOQ and Dead Stock: A Direct Line
Dead stock does not appear suddenly. It accumulates gradually, SKU by SKU, order by order, every time the MOQ accepted at purchase exceeds the demand that actually materializes.
Monitoring inventory turnover rates and regularly reviewing sales data can help identify low-demand or slow-turnover items, allowing businesses to optimize MOQs and negotiate better terms.
The pattern typically looks like this: a brand sources a new product and accepts the supplier’s MOQ to secure a competitive unit cost. Initial sales are promising. The next reorder goes through at the same MOQ. Demand softens slightly, but the order is already placed. By the third cycle, a portion of the inventory is aging. By the fourth, storage costs are eating into the margin the bulk pricing was supposed to protect.
Historical sales data can expose this dynamic early. If your weeks-of-supply metric consistently runs far above your target after each replenishment, your MOQ is structurally higher than your demand justifies. That is the signal to act, either by renegotiating the MOQ, adjusting order frequency, or rationalizing the SKU before dead stock compounds further.
For brands with large catalogs, this analysis matters at the variant level, not just the product level. A top-level SKU may appear healthy while a specific size or colorway quietly accumulates excess stock because the MOQ was set against aggregate demand, not variant-level demand.
Effective management of minimum order quantities can significantly impact cash flow, storage requirements, and overall operational efficiency and market competitiveness.
Inventory Management Software
Inventory management software (IMS) is an essential tool for businesses looking to manage their minimum order quantity moq effectively. IMS enables you to track inventory levels in real time, monitor supplier lead times, and optimize order quantities based on actual customer demand. By automating key processes, IMS helps reduce inventory costs, minimize stockouts, and improve overall operational efficiency.
With features like automated ordering, demand forecasting, and supplier performance tracking, inventory management software empowers businesses to make data-driven decisions about their MOQ strategy. IMS can also help calculate your economic order quantity (EOQ)—the optimal order quantity that minimizes total inventory costs by balancing ordering and holding costs. The EOQ formula is: EOQ = √((2 * Demand * Ordering Cost) / Holding Cost). By leveraging IMS to calculate EOQ and manage order quantities, businesses can ensure they are meeting customer demand without overstocking, reducing administrative costs, and maintaining optimal inventory levels. Ultimately, effective use of IMS supports strategic inventory management, cost savings, and a more agile, responsive supply chain, especially when paired with a thoughtful ecommerce order fulfillment profit strategy that treats fulfillment as a lever for growth rather than a pure cost center.
Calculating MOQ Fit Before You Commit
Before accepting any supplier MOQ, the calculation worth running is simple: divide the MOQ by your average monthly unit sales for that SKU. The result is the number of months of supply you are committing to in a single order. It is important to use demand forecasts to calculate minimum order quantity and ensure that your order size aligns with sales expectations, helping to avoid excess stock or stockouts.
If that number is two or three months, the risk is manageable for a stable product. If it stretches to six months or beyond, you are making a high-stakes forecast. For new products without sales history, any MOQ that requires months of supply is speculative by nature.
The economic order quantity (EOQ) framework offers a more rigorous version of this analysis. EOQ calculates the order size that minimizes total inventory costs by balancing ordering costs against holding costs. Businesses should calculate minimum cost order quantity by considering factors such as demand forecast, storage capacity, budget constraints, and lead times. Inventory management software and technology tools can help calculate minimum order quantity more precisely. If your EOQ sits below the supplier’s MOQ, you will structurally carry excess inventory on every cycle. The gap between your EOQ and the MOQ is a direct measure of the inefficiency you are accepting and a signal to evaluate more efficient ecommerce order fulfillment services that can support better inventory placement.
For products with proven demand and stable velocity, a high MOQ is often manageable. For long-tail SKUs, new variants, or seasonal items, even a moderate MOQ can create excess inventory risk that accumulates over time.
How to Negotiate MOQ With Suppliers
MOQ is a starting position, not an immovable policy. Suppliers set MOQs to protect their economics, but they may adjust MOQs based on market conditions, production efficiency, and customer relationships. This means there is usually room to negotiate when you can offer something in return.
Several approaches tend to work in practice:
- Commit to volume over time rather than in a single order. A supplier who sets an MOQ of 1,000 units may accept 500 units per order if you can demonstrate a reliable ordering cadence and annual purchase volume that covers their margin requirements.
- Consolidate SKUs into a single order. If you source multiple products from the same supplier, bundling orders can help you meet an aggregate MOQ threshold while distributing the quantity across items with stronger demand coverage.
- Start with a pilot order framing. For new products, presenting the first order as a market validation run with a firm commitment to scale can give a supplier confidence in the long-term relationship without requiring you to over-buy upfront.
- Offer favorable payment terms. Paying earlier, or in full at order, reduces supplier risk and often provides leverage to negotiate lower minimum quantities. Pairing this with the right warehousing and fulfillment services partner ensures that once inventory lands, it’s stored and processed efficiently.
- Ask about tiered pricing structures. Sometimes the unit economics at a lower order quantity are acceptable when you factor in reduced holding costs and eliminated dead stock risk. The bulk savings at the full MOQ may not justify the inventory carrying cost and write-down exposure.
- Engage in transparent discussions with suppliers about your business needs and sales projections. Clearly communicating your operational requirements and expected demand can help negotiate lower MOQs that better align with your business strategy.
- Consider offering volume discounts or other incentives. Providing tiered pricing or free shipping can encourage customers to place larger orders and help you meet supplier MOQs more efficiently.
- Time negotiations during slower seasons and propose bundling multiple SKUs. Suppliers may be more flexible with MOQs during off-peak periods, and bundling different products can help you reach the required MOQ while diversifying your inventory.
Maintaining healthy supplier relationships is the foundation for any of this to work. Suppliers who trust the buyer’s business and forecasts are more willing to flex on MOQ terms, particularly as order history builds. Maintaining open communication with suppliers is essential for negotiating flexible MOQ terms.
Managing MOQ Across a Multi-SKU Catalog
At scale, MOQ management becomes a portfolio problem. Each SKU in your catalog has its own demand profile, its own supplier MOQ, and its own risk exposure. Managing them individually is operationally intensive and tends to produce inconsistent outcomes.
Effective inventory management at this level requires demand-driven replenishment logic that compares each SKU’s forecasted consumption against its MOQ before the order is placed, not after. When forecasted demand falls below the MOQ threshold, the system should flag it for review rather than auto-reorder at the minimum. Regularly reviewing inventory levels and adjusting MOQ strategies according to changes in market demand is essential to ensure optimal stock levels and reduce unnecessary costs.
Inventory management software that surfaces weeks-of-supply, sell-through rate, and MOQ gap metrics per SKU gives operations teams the visibility to make those calls systematically. Using technology to automate inventory management helps businesses continuously monitor demand patterns and adjust MOQs as needed. Without that visibility, MOQ decisions default to manual judgment, which scales poorly and tends to favor over-ordering to avoid stockouts. Many operators supplement these tools with ongoing ecommerce logistics and fulfillment webinars to stay ahead of marketplace rule changes and best practices.
The broader strategic objective is a catalog where the MOQ-to-demand ratio stays within a manageable range across active SKUs. That often means pruning low-velocity variants, consolidating suppliers where possible, and setting explicit thresholds for when a SKU’s demand no longer justifies its supplier’s minimum. For marketplace sellers, diversifying beyond FBA with options like Merchant Fulfilled Prime and other FBA alternatives can also change how aggressively you need to buy against each MOQ. Balancing your own inventory and only holding as much inventory as needed helps optimize carrying costs and reduces risk.
Frequently Asked Questions
What does MOQ mean in ecommerce?
MOQ stands for minimum order quantity. It is the smallest number of units a supplier will sell in a single order. In ecommerce, it directly affects how much inventory you purchase per cycle, how much capital you commit upfront, and how much excess stock risk you carry per SKU.
How does minimum order quantity affect cash flow?
A high MOQ forces you to purchase more inventory than you may need in the near term, pulling working capital forward before that inventory generates revenue. For brands managing multiple SKUs simultaneously, stacking high-MOQ orders can significantly reduce cash flow flexibility and limit investment in other areas of the business, especially when layered on top of rising Amazon FBA fees and storage charges.
What is the difference between MOQ and economic order quantity?
MOQ is the minimum a supplier will accept. Economic order quantity (EOQ) is the order size that minimizes your total inventory costs, balancing ordering costs against holding costs. When your EOQ falls below a supplier’s MOQ, you will carry excess inventory on every replenishment cycle, increasing holding costs and dead stock risk.
Can you negotiate a supplier’s MOQ?
Yes. MOQ is often negotiable, particularly when you can offer a reliable order cadence, consolidated purchasing across multiple SKUs, or favorable payment terms. Suppliers set MOQs to protect their margins, so any negotiation that addresses their underlying economics gives you room to move.
How does a high MOQ lead to dead stock?
When the MOQ exceeds your actual demand for a SKU, every order cycle produces more inventory than you can sell in a reasonable timeframe. That excess accumulates as dead stock, incurring storage costs, tying up capital, and eventually forcing markdown or liquidation decisions that erode margin.
How do you calculate whether an MOQ is too high for your business?
Divide the MOQ by your average monthly unit sales for that SKU. The result tells you how many months of supply you are committing to in a single order. For stable, fast-moving products, several months of supply may be acceptable. For new, seasonal, or low-velocity SKUs, anything beyond a few weeks of supply represents meaningful inventory risk.
Written By:
Indy Pereira
Indy Pereira helps ecommerce brands optimize their shipping and fulfillment with Cahoot’s technology. With a background in both sales and people operations, she bridges customer needs with strategic solutions that drive growth. Indy works closely with merchants every day and brings real-world insight into what makes logistics efficient and scalable.
Turn Returns Into New Revenue
Related Articles
What Is Demand Planning? How It Impacts Inventory, Forecasting, and Profitability
Demand planning is the process of estimating future customer demand so that a business can align its inventory, procurement, and operations to meet that demand without carrying mor...
Why 100% P2P Adoption Is the Wrong Goal
Peer-to-peer returns let customers send eligible returned items directly to other customers instead of routing every package back through the warehouse, cutting shipping and proces...
Walmart Officially Allows Amazon Multi-Channel Fulfillment (MCF)
Big news for multichannel sellers: Walmart now officially allows Amazon Multi-Channel Fulfillment (MCF), Amazon’s service for using its fulfillment network to ship orders from mult...
Target Vendor Portal Explained: What Brands Actually Have to Manage
In this article
15 minutes
- More than purchase orders and invoices
- Where compliance requirements create financial exposure
- How chargebacks actually happen (and stack up)
- Portal failures are almost always fulfillment failures in disguise
- Integration with Other Systems
- Practical steps that reduce penalties and protect margins
- Frequently Asked Questions
The Target vendor portal is not an admin dashboard. It is a compliance and fulfillment control system where small operational errors cascade into chargebacks, delays, and margin erosion. Target Partners Online is the web portal Target provides to support its vendors and suppliers. Brands that treat it as a place to check orders and submit invoices misunderstand what it actually demands. For any company supplying Target, the portal is where performance is measured, penalties are assessed, and the financial health of the retail partnership is determined in real time.
Known formally as Target Partners Online (accessible at partnersonline.com), the platform houses more than 40 distinct applications spanning purchase orders, shipping logistics, item management, product costing, invoicing, dispute resolution, and supplier performance tracking. Every Target supplier, from a large CPG brand seeking to secure Target as a key retail partner to emerging direct-to-consumer companies entering big-box retail for the first time, operates through this ecosystem daily. As a web portal, it serves as a centralized digital hub for vendor management and business operations, enabling vendors and suppliers to manage retail data, communication, and compliance. Sales teams pull retail sales data. Logistics teams manage routing and shipments. Accounts receivable teams track deductions. The portal touches every function, and compliance failures in any one of them carry direct financial consequences.
More than purchase orders and invoices
The core workflows inside the Target vendor portal reflect the full lifecycle of a retail order, not just the transaction itself. Understanding these workflows is essential because each one contains compliance checkpoints where errors generate chargebacks.
Purchase orders arrive via EDI 850, and Target’s POs can be substantial (500+ line items is not unusual). Vendors must review and acknowledge orders within a defined window, and the original PO quantity matters enormously because Target measures fill rate against that original number, not any revised figure. This means suppliers cannot reduce order quantities through EDI 860 change requests and then claim full compliance.
Advanced Ship Notices (ASNs) are submitted via EDI 856 and must be error-free and received before the shipment’s in-yard date and time. The ASN contains item IDs, quantities shipped, case pack information, SSCC-18 barcodes, bill of lading numbers, carrier details, and expected delivery dates. Target’s distribution centers depend on accurate ASN data for receiving, so inaccuracies do not simply create a paperwork problem. They disrupt the physical flow of goods through the supply chain.
Routing compliance is managed through ShipIQ, which replaced the legacy Vendor Ready to Ship system. ShipIQ automates shipment creation and assigns pickup dates based on product lead time rather than vendor preference. For collect shipments (where Target pays freight), suppliers must release POs in ShipIQ on a specific timeline. For prepaid shipments, appointments are scheduled through Docklink or RyderShare. Pallet heights, stretch wrap specifications, label placement, and GS1-128 carton labels all fall under routing guide requirements.
Invoicing flows through EDI 810 documents, with Electronic Funds Transfer required for all domestic vendors. The portal’s Accounts Receivable Deduction Dashboard gives suppliers visibility into deduction activity and payment trends, while the Synergy dispute portal allows vendors to submit and track chargeback disputes with supporting documentation.
Where compliance requirements create financial exposure
Target’s compliance program, built around its On Time Fill Rate (OTFR) framework, sets performance goals that are almost uniformly 100%, with one exception: fill rate, set at 95%. Every metric below target triggers percentage-based or per-carton penalties that compound quickly across shipments.
On-time shipping carries a 3% of cost-of-goods penalty on all non-compliant items, with a $150 minimum chargeback. This applies whether the vendor ships collect or prepaid, and Target penalizes shipments that arrive both too early and too late. For collect shipments, the vendor must have goods ready for pickup in the assigned window. For prepaid shipments, the Target distribution center must receive goods within the delivery window. Drop trailers receive a grace period of 12 hours before and 4 hours after the scheduled time, while live trailers must arrive within 30 minutes of the appointment.
Fill rate compliance requires shipping at least 95% of items on the original purchase order, measured at the item level. Falling below that threshold triggers a 3% COGS fine on non-compliant items. Because this is measured against the original EDI 850, suppliers who habitually short-ship or rely on PO modifications to mask inventory shortfalls face consistent penalties.
Target’s Perfect Order Program (introduced in May 2025 for domestic suppliers) added three additional compliance layers: ASN Availability, ASN Accuracy, and Physical Barcode Accuracy. Each carries a fine of $0.75 per non-compliant carton with a $100 minimum. ASN Accuracy now measures both item-level attributes (vendor case pack information) and shipment-level data (store ship information). Physical Barcode Accuracy requires that 100% of cartons arriving at Target’s distribution centers carry legible, scannable barcodes that match the retailer’s system records.
How chargebacks actually happen (and stack up)
Chargebacks at Target are not isolated penalties. They are generated by a system that evaluates every shipment against multiple compliance criteria simultaneously, meaning a single problematic shipment can trigger three or more separate chargebacks. A late shipment with an inaccurate ASN and barcode errors produces an on-time violation, an ASN accuracy fine, and a physical barcode penalty, all on the same PO.
The most common chargeback categories include invoice match deductions (carton shortages, cost differences, case pack discrepancies), vendor performance deductions (late shipments, fill rate shortfalls, ASN failures), and freight deductions (unapproved expedited freight, backorder charges, improper consolidator shipments). Third-party audit firms like PRGX and Cotiviti also generate deductions on Target’s behalf.
The financial scale is significant. Industry data indicates that vendor chargebacks can account for 2% to 10% of a manufacturer’s total revenue. A company shipping $80 million annually to Target could face up to $4 million in deductions. Violations remain active for two weeks from the creation date; if unresolved, they convert to chargebacks. Domestic PO disputes must be filed within three months, and import PO disputes within six months. Missing those windows means the losses become permanent.
Portal failures are almost always fulfillment failures in disguise
The most persistent misconception about the Target vendor portal is that compliance problems originate in the portal itself. They rarely do. The portal reports what happened in the physical world. When an ASN is inaccurate, it is almost always because the warehouse shipped different quantities than expected. When a fill rate violation appears, it reflects an inventory problem upstream, not a data entry mistake downstream.
This pattern emerges from the handoff points in a typical supply chain: the vendor’s ERP sends data to the EDI system, which connects to the 3PL’s warehouse management system, which generates the ASN. At each handoff, data can degrade. A warehouse management system that cannot track inventory at every touchpoint will produce inaccurate counts, which flow into inaccurate ASNs, which trigger compliance penalties that look like “portal errors” but are actually warehouse errors. Understanding Target’s supply chain is crucial for vendors to ensure smooth operations and avoid these common pitfalls.
Brands also face what compliance consultants call the three competing sources of truth problem: the retailer’s routing guide documentation, the portal’s automated rules (which determine what the system “sees”), and the operational checklists used by warehouse teams. When these three layers fall out of sync (for example, when a routing guide is updated but the 3PL’s checklist is not), the warehouse executes correctly against outdated instructions while the portal grades against current rules. The chargeback hits, everyone feels they did their job, and yet the penalty stands.
Rushed picking and packing operations, last-minute substitutions, label printer misconfigurations, and staging delays all manifest as portal compliance failures. Treating them as clerical problems leads to repeated violations because the root cause remains unaddressed.
Target’s vendor portal is also essential for operational communication, including updates about distribution center closures, and Target Plus sellers must pair that visibility with a 3PL optimized specifically for Target Plus requirements.
Integration with Other Systems
To truly unlock the power of Target Partners Online, brands and suppliers must look beyond standalone portal usage and embrace integration with their broader business systems. Seamless integration is the key to transforming Target Partners Online from a compliance checkpoint into a central platform for driving sales, optimizing operations, and gaining valuable insights across your entire supply chain.
By connecting Target Partners Online with other tools—such as item cost management systems, product costing platforms, and electronic funds transfer solutions—vendors can automate manual processes, reduce errors, and achieve real-time visibility into critical performance metrics. For example, integrating item cost management tools allows for more accurate product costing and pricing strategies, ensuring that every purchase order is both competitive and profitable. Linking electronic funds transfer systems streamlines payment workflows, minimizing the risk of late deliveries and improving cash flow management, while programs like the Cahoot Fulfillment Partner network can turn underutilized warehouse capacity into revenue-generating fulfillment infrastructure.
Domestic based vendors, private label suppliers, and CPG brands alike benefit from integrating Target Partners Online with their accounts payable team’s software and supply chain management platforms. This connectivity enables teams to track inventory levels, monitor purchase orders, and manage item setup with greater precision. Real-time data flow between systems means that performance metrics are always up to date, especially when supported by robust order fulfillment integrations across ecommerce partners and carriers, empowering teams to identify root causes of issues—such as invalid deductions or inventory discrepancies—before they impact the bottom line.
Leveraging Target’s packaging program and the Vendor Training Hub through integrated processes ensures that your business consistently meets the retailer’s highest standards. These integrations not only support compliance but also provide actionable insights that help vendors track performance, optimize promotional campaigns, and drive sales growth.
Practical steps that reduce penalties and protect margins
Brands that consistently maintain strong supplier performance on Target’s Supplier Performance Management Dashboard tend to share several operational disciplines. The Target vendor portal provides the ability to create visualizations, reports, and alerts, enhancing a user’s capacity to analyze, interpret, and act on retail data efficiently:
- Pre-shipment auditing and documentation. Quality checks on every outbound retail shipment, verifying label accuracy, case pack counts, pallet configurations, and documentation completeness. Photographing and logging every shipment with timestamps creates evidence for disputing erroneous chargebacks.
- EDI automation with real-time synchronization. Moving from batch processing to real-time sync between ERP, WMS, and EDI systems eliminates timing discrepancies. Automated ASN generation tied directly to warehouse management data ensures the ASN matches the physical shipment.
- Converting routing guides into actionable warehouse checklists. Distilling Target’s detailed routing documentation into concise, DC-specific checklists (covering booking steps, label placement, carton count rules, ASN timing, and documentation retention) bridges the gap between retailer requirements and warehouse execution.
- Dedicated compliance ownership. Assigning a specific person or team to monitor Target’s performance metrics weekly, attend vendor trainings, update internal systems when requirements change, and manage the dispute process through Synergy.
- Retail-experienced fulfillment partners. Working with 3PLs that specialize in big-box retail compliance and understand Target’s specific requirements for item setup, routing, labeling, and delivery windows.
Operational tools like Vendor Management and Maintenance (VMM) and Vendor Ready to Ship (VRS) enable vendors to streamline processes and reduce errors.
Beyond these operational investments, the most effective brands build a monthly compliance review cadence: tracking the top chargeback codes by dollar amount and frequency, auditing EDI and ASN timing, reviewing label templates, and updating warehouse teams on any changes to Target’s portal rules or routing guide. Every recurring chargeback should produce a corrective action, a documentation standard, and a training update. Disputing chargebacks without fixing the underlying process guarantees the same penalties will return.
The Vendor Training Hub (VTH) provides access to training and compliance guidelines for suppliers to meet Target’s standards.
Frequently Asked Questions
What is the Target vendor portal and who needs to use it?
The Target vendor portal, formally called Target Partners Online (partnersonline.com), is a web portal and compliance and fulfillment control system used by all Target suppliers. It contains over 40 applications for managing purchase orders, shipping logistics, item management, product costing, invoicing, dispute resolution, and supplier performance tracking. Every Target supplier from large CPG brands to emerging DTC companies entering big-box retail must operate through this platform daily. Sales teams access retail sales data, logistics teams manage routing and shipments, and accounts receivable teams track deductions. The portal is not optional for any vendor relationship with Target.
Access and secure logins are provided to all Target retail vendors, allowing them to share Target data and communicate within a single portal. Authentication services ensure secure user authorization, compliance, and protected data sharing within the web portal.
What are the core workflows vendors must manage in the Target portal?
Core workflows include: (1) Purchase orders via EDI 850 that must be acknowledged within defined windows; (2) Advanced Ship Notices (ASNs) via EDI 856 submitted before shipment in-yard dates with item IDs, quantities, case packs, SSCC-18 barcodes, and carrier details; (3) Routing compliance through ShipIQ (replaced Vendor Ready to Ship) for collect and prepaid shipments with specific pallet, labeling, and appointment requirements; (4) Invoicing via EDI 810 with Electronic Funds Transfer required for domestic vendors; (5) Dispute management through the Synergy portal for chargeback resolution with supporting documentation.
Vendor management is also a key workflow, supported by the Vendor Management and Maintenance (VMM) web-based app, which allows vendors to manage details such as mailing address and bank information.
The Target vendor portal includes tools for analyzing supplier business and provides access to various Target applications and systems, and Target Plus merchants can complement this with specialized Target Plus order fulfillment services to maintain fast, affordable delivery performance.
What are Target’s compliance requirements and how do chargebacks work?
Target’s On Time Fill Rate (OTFR) framework sets performance goals at nearly 100% (except fill rate at 95%). On-time shipping violations trigger 3% of COGS penalties with $150 minimum. Fill rate below 95% of original PO triggers 3% COGS fine on non-compliant items. Target’s Perfect Order Program (May 2025) added ASN Availability, ASN Accuracy, and Physical Barcode Accuracy requirements at $0.75 per non-compliant carton with $100 minimum. A single problematic shipment can trigger multiple simultaneous chargebacks (late delivery + inaccurate ASN + barcode errors all on same PO). Violations convert to chargebacks after two weeks if unresolved.
How much can Target chargebacks cost vendors annually?
Industry data indicates vendor chargebacks can account for 2% to 10% of a manufacturer’s total revenue with Target. A company shipping $80 million annually could face up to $4 million in deductions. Common categories include invoice match deductions (carton shortages, cost differences, case pack discrepancies), vendor performance deductions (late shipments, fill rate shortfalls, ASN failures), and freight deductions (unapproved expedited freight, backorder charges). Third-party audit firms like PRGX and Cotiviti also generate deductions. Domestic PO disputes must be filed within three months, import PO disputes within six months, or losses become permanent.
Why do most Target portal compliance failures actually originate in fulfillment operations?
The portal reports what happened in the physical world, not clerical errors. When an ASN is inaccurate, the warehouse almost always shipped different quantities than expected. Fill rate violations reflect upstream inventory problems, not data entry mistakes. The problem emerges from handoff points: vendor ERP sends data to EDI system, which connects to 3PL warehouse management system, which generates the ASN. At each handoff, data can degrade. Warehouse management systems that cannot track inventory at every touchpoint produce inaccurate counts that flow into inaccurate ASNs, triggering compliance penalties that look like “portal errors” but are actually warehouse errors.
What is the three competing sources of truth problem in Target compliance?
The three competing sources of truth are: (1) Target’s routing guide documentation (official requirements); (2) The portal’s automated rules that determine what the system “sees” and grades; (3) Operational checklists used by warehouse teams to execute shipments. When these three layers fall out of sync (for example, routing guide updates but 3PL checklist is not updated), the warehouse executes correctly against outdated instructions while the portal grades against current rules. The chargeback hits, everyone feels they did their job correctly, yet the penalty stands. This misalignment accounts for many recurring compliance failures.
What operational practices reduce Target chargebacks and protect margins?
Effective practices include: (1) Pre-shipment auditing with quality checks on label accuracy, case pack counts, pallet configurations, and photographic documentation with timestamps for dispute evidence. Manual processes in these steps can be time consuming and drain resources, especially for smaller teams; (2) EDI automation with real-time sync between ERP, WMS, and EDI systems to eliminate timing discrepancies. Automating retail link data-pulling and analysis helps improve efficiency for brands working with Target; (3) Converting routing guides into DC-specific warehouse checklists covering booking, labeling, carton counts, ASN timing; (4) Dedicated compliance ownership with weekly metric monitoring and Synergy dispute management; (5) Retail-experienced 3PL partners specializing in big-box compliance; (6) Monthly compliance review tracking top chargeback codes, auditing EDI/ASN timing, and updating warehouse teams on portal rule changes.
What happens if vendors ignore Target compliance requirements?
Chronic noncompliance carries consequences beyond chargebacks: degraded vendor scorecard ratings, reduced future order volumes, eroded buyer trust, and potential loss of shelf space. The Supplier Performance Management Dashboard tracks shipping reliability, on-time metrics, fill rate, and ASN compliance weekly. Target’s business intelligence platform Greenfield provides over 100 queryable metrics on sales, inventory, and performance. These visibility tools only help if underlying fulfillment operations are sound. Treating compliance as a back-office function rather than a supply chain discipline determines whether a Target retail partnership generates margin or quietly destroys it through accumulating penalties.
Written By:
Indy Pereira
Indy Pereira helps ecommerce brands optimize their shipping and fulfillment with Cahoot’s technology. With a background in both sales and people operations, she bridges customer needs with strategic solutions that drive growth. Indy works closely with merchants every day and brings real-world insight into what makes logistics efficient and scalable.
Turn Returns Into New Revenue
Related Articles
What Is Demand Planning? How It Impacts Inventory, Forecasting, and Profitability
Demand planning is the process of estimating future customer demand so that a business can align its inventory, procurement, and operations to meet that demand without carrying mor...
Why 100% P2P Adoption Is the Wrong Goal
Peer-to-peer returns let customers send eligible returned items directly to other customers instead of routing every package back through the warehouse, cutting shipping and proces...
Walmart Officially Allows Amazon Multi-Channel Fulfillment (MCF)
Big news for multichannel sellers: Walmart now officially allows Amazon Multi-Channel Fulfillment (MCF), Amazon’s service for using its fulfillment network to ship orders from mult...
Why Amazon FBA Hazmat Shipments Often Get Routed Across the Country

In this article
8 minutes
Some sellers believe Amazon only has one hazmat warehouse. That is not true, but the experience of shipping hazmat through FBA can make it feel that way.
If you have ever created a hazmat shipment and been forced to send it to a single facility across the country, you know the frustration. This often happens when products are classified as hazardous products and flagged for special handling. Instead of multiple inbound options, you get one destination. In some cases, the system shows no available fulfillment centers at all. For sellers trying to maintain steady inventory flow, that feels restrictive and confusing.
The real issue is not the number of warehouses. The real issue is how hazmat space is allocated inside them.
Understanding Dangerous Goods Hazmat
Selling on Amazon opens up opportunities, but it also comes with responsibilities—especially when it comes to hazardous materials. Dangerous goods hazmat refers to products that contain hazardous substances, which can pose health, safety, or environmental risks if not handled correctly. These include items like cleaning products, flammable liquids, battery powered devices, pressurized containers, and more.
To help sellers navigate these risks and recent regulatory changes that hold Amazon accountable for unsafe products, Amazon has established the FBA Dangerous Goods Program. This program is designed to ensure that all dangerous goods are handled, stored, and transported safely and in compliance with strict safety regulations. If you want to sell dangerous goods through FBA, you must provide accurate and complete information about your products, including a Safety Data Sheet (SDS) or, in some cases, exemption sheets. The safety data sheet SDS is a critical document that details the composition, hazards, and safe handling procedures for each product.
Proper documentation is not just a formality—it’s a requirement for participating in the dangerous goods program. Amazon uses this information to classify your products, determine the correct storage and transportation methods, and ensure compliance with all relevant regulations. Failing to provide a complete safety data sheet or exemption sheet can delay your hazmat review, prevent your products from being listed, or even result in removal from the FBA program.
By understanding what qualifies as dangerous goods and following the proper procedures for documentation and compliance, sellers can safely and successfully participate in the FBA dangerous goods program. This not only protects your business but also helps Amazon maintain the highest safety standards for customers, employees, and the environment.
What Sellers Are Actually Seeing
Many sellers report that FBA assigns only one hazmat destination at a time. In forum posts, you’ll find examples like, “Why is FBA making me send all my HAZMAT to Dupont WA,” even when the seller is located on the opposite coast.

Other sellers encounter a more severe message: “No fulfillment centers are currently available to receive dangerous goods.” That error effectively shuts down inbound shipments until capacity reopens.
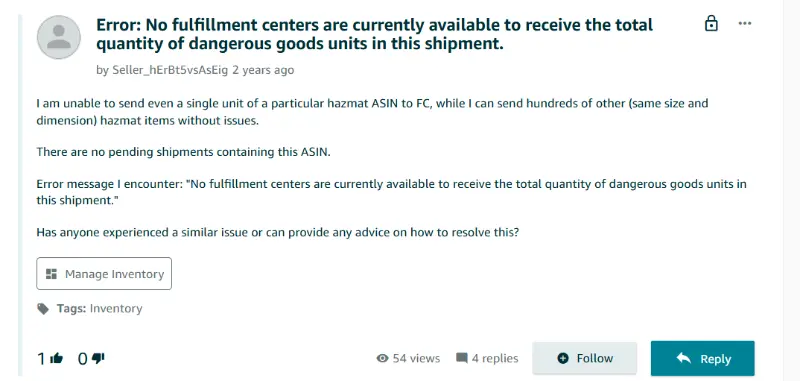
These experiences create the impression that hazmat fulfillment is centralized in one place. In reality, what sellers are running into is limited hazmat capacity, not a single warehouse. FBA inventory for hazardous products is managed across multiple FBA warehouses and FBA facilities, each with its own capacity constraints and specific requirements for storing dangerous goods.
How Hazardous Materials Space Actually Works Inside FBA
Hazmat inventory is typically stored inside regular Amazon fulfillment centers. To safely store hazardous materials, it is essential to follow proper hazmat packaging requirements that comply with regulations and prevent accidents.
Within those fulfillment centers, hazmat products are kept in segregated zones. Those zones are designed to meet safety, compliance, and insurance requirements, which means they cannot be expanded freely or mixed with standard inventory. Unlike standard fulfillment, hazmat storage is subject to strict limits on quantities and packaging to ensure safe handling and regulatory compliance.
A former Amazon operations employee familiar with fulfillment center design confirmed that hazmat is usually co-located with normal inventory, but the dedicated space is limited and tightly controlled. That space must comply with strict safety rules, and it represents a higher operational cost than standard shelving.
When space is limited and expensive, intake has to be managed carefully. Amazon cannot simply accept unlimited quantities of hazmat inventory without risking congestion or compliance issues. Limited quantities are enforced to ensure safe storage and handling within FBA facilities.
Why Hazmat Space Fills Up and Stays Full
Hazmat inventory often turns slower than standard goods. Hazmat items and other hazardous goods are subject to stricter storage and handling requirements, which can impact how quickly they are sold through the platform. Many dangerous goods categories have lower sales velocity or stricter storage requirements, which means units sit longer before selling.
Safety rules also reduce storage density. Products cannot always be stacked or positioned as tightly as non-hazmat inventory, and certain classes of goods must be separated.
Slower turnover means space does not free up quickly. When hazmat zones remain full for longer periods, Amazon must throttle new inbound shipments to avoid overfilling those areas.
That is when sellers start seeing limited destination options or temporary shutdown messages. The system is not broken. It is protecting constrained space, but it can still trigger shipping issues and carrier exceptions that sellers must resolve quickly. The consequence is not just inconvenience. It is reduced distribution flexibility.
The Real Limitation Is Distribution Flexibility
The biggest impact of limited hazmat space is reduced distribution flexibility. With standard inventory, Amazon can spread units across multiple regions to balance coverage.
With hazmat inventory, sellers may only be able to send units to the facility that currently has room. This directly affects how hazmat products are shipped, as inventory may only be shipped to specific fulfillment centers, which can limit nationwide coverage. That facility may be concentrated in one region of the country.
When inventory is concentrated geographically, nationwide coverage becomes harder to achieve cleanly. Replenishment planning becomes less predictable, and sellers lose some control over how inventory is positioned.
You are not placing inventory strategically. You are placing it wherever capacity allows.
Why It Feels Arbitrary
From a seller’s perspective, hazmat routing can feel random. Amazon does not provide visibility into hazmat capacity levels or allocation logic.
Capacity may fluctuate based on internal thresholds, safety reviews, or storage turnover. Because sellers cannot see those constraints, routing decisions appear inconsistent.
That lack of visibility is what fuels the rumor that there is only one hazmat warehouse. In reality, there may be multiple fulfillment centers with hazmat capability, but only a limited number of open slots at any given time.
What Hazmat Reveals About Control
Hazmat inventory exposes what happens when inventory placement is dictated by a single operator’s internal capacity constraints. When space tightens, flexibility narrows.
In FBA, sellers cannot activate alternative nodes, bring their own compliant warehouse online, or redirect routing strategy when hazmat zones fill up. They ship where space exists.
For most sellers, high-velocity products move through the system smoothly. But for regulated or slower-turning inventory, placement flexibility becomes strategic rather than automatic. The key issue is not central coordination. The key issue is whether sellers retain the ability to add nodes, diversify storage, or adjust routing when constraints appear.
Hazmat simply makes that distinction visible.
When inventory placement depends entirely on one operator’s internal capacity, flexibility becomes conditional rather than guaranteed, which is why some sellers explore Merchant Fulfilled Prime alternatives to FBA. For brands that carry regulated or slower-moving SKUs, adding additional fulfillment nodes alongside FBA can reduce exposure to single-network constraints.
FAQ
Does Amazon have only one hazmat warehouse?
No. Hazmat inventory is typically stored in segregated areas inside multiple fulfillment centers. However, available capacity may be limited at any given time, which can result in only one inbound destination appearing.
Why does FBA sometimes show only one hazmat destination?
When hazmat space is constrained, Amazon may direct inbound shipments to the facility with available capacity. Sellers do not choose from multiple options if only one location has open hazmat space.
What does “no fulfillment centers available” mean?
This message usually indicates that hazmat storage zones are temporarily full or restricted. Inbound shipments may resume once space becomes available.
Is it harder to achieve nationwide coverage with hazmat SKUs?
It can be. If hazmat inventory is concentrated in one region due to capacity limits, sellers may not achieve the same geographic distribution as standard inventory.
Written By:
Rinaldi Juwono
Rinaldi Juwono leads content and SEO strategy at Cahoot, crafting data-driven insights that help ecommerce brands navigate logistics challenges. He works closely with the product, sales, and operations teams to translate Cahoot’s innovations into actionable strategies merchants can use to grow smarter and leaner.
Turn Returns Into New Revenue
Related Articles
What Is Demand Planning? How It Impacts Inventory, Forecasting, and Profitability
Demand planning is the process of estimating future customer demand so that a business can align its inventory, procurement, and operations to meet that demand without carrying mor...

The Shipping Speed Paradox: Why DTC Brands Are Slowing Down
Everyone’s talking about faster delivery.

Why Cross-Border DTC Brands Are Moving Fulfillment Inside the US
Cross-border ecommerce fulfillment is the process of shipping ecommerce orders across national borders—often from warehouses outside the United States to U.
Is There Still a Warehouse Shortage? What Ecommerce Brands Are Missing

In this article
24 minutes
- Introduction to Warehouse Shortage Challenges
- Causes of Warehouse Shortages
- From Record Scarcity to 1.8 Billion Square Feet of New Supply
- Regional Markets Tell Two Very Different Stories
- Pandemic-Era Leases Have Become Expensive Traps
- Labor Is the Bottleneck That New Space Cannot Solve
- Why Adding Space Does Not Fix Fulfillment Cost Issues
- The Role of Technology in Warehouses
- How Brands Are Rethinking Warehouse Strategy Without New Leases
- Warehouse Management Best Practices
- Conclusion
- Frequently Asked Questions
The national warehouse crunch that paralyzed ecommerce supply chains from 2020 to 2023 has effectively ended. U.S. industrial vacancy rates climbed to 7.1% by Q4 2025, more than double the all-time low of 3.0% set in early 2022, according to Cushman & Wakefield. But this headline number masks a deeper, more stubborn problem: ecommerce brands aren’t struggling because they can’t find warehouse space, they’re struggling because space was never the real bottleneck. Labor shortages, shipping zone economics, rigid lease structures, and exploding last-mile costs now dominate the fulfillment equation. For brands that signed leases during the pandemic frenzy, the market correction has turned their real estate into an anchor rather than an asset.
Introduction to Warehouse Shortage Challenges
The warehouse industry is navigating a complex landscape marked by persistent warehouse space shortages, ongoing labor shortages, and escalating labor costs. These challenges ripple through the entire supply chain, driving up higher operational costs, causing delayed shipments, and ultimately impacting customer satisfaction for every category, from general merchandise to brands that require specialized food grade warehouse fulfillment. As e-commerce continues to fuel demand for rapid order fulfillment, many warehouses and distribution centers are under constant pressure to expand capacity and improve efficiency. However, the competition for warehouse workers is fierce, with companies offering increasingly competitive pay and benefits to attract and retain talent. Despite high demand, many warehouses struggle to maintain adequate staffing levels, leading to operational bottlenecks and increased costs. Effective inventory management and streamlined warehouse operations have become essential for companies seeking to stay competitive in this dynamic industry. The warehouse market is dynamic and evolving, with trends pointing to a growing need for flexibility and cost-effective solutions. The ability to adapt to these challenges is now a key differentiator for businesses operating in the warehouse and logistics sector.
Causes of Warehouse Shortages
Warehouse shortages stem from a combination of interrelated factors that challenge even the most prepared companies. The surge in e-commerce has dramatically increased demand for warehouse space, as businesses race to store more inventory closer to their customers for faster order fulfillment. However, this demand has outpaced the available supply of suitable facilities, especially in key markets. Labor shortages further complicate the situation, as many warehouses rely on temporary labor to fill gaps, which can lead to unpredictable staffing levels and operational inefficiencies. The struggle to retain staff is intensified by the need to offer competitive pay and benefits, as workers are often lured away by better opportunities elsewhere. To address these challenges, companies are increasingly turning to technology solutions such as automated storage and retrieval systems, which help reduce reliance on manual labor and improve efficiency. Staffing agencies also play a vital role in connecting warehouses with skilled personnel, helping to manage operations more effectively. Ultimately, overcoming warehouse shortages requires a multifaceted approach that balances investment in technology, competitive compensation, and strategic workforce management.
In recent years, developers have focused on constructing large warehouses in response to the eCommerce boom, which has contributed to a scarcity of smaller spaces, particularly in urban and suburban areas. This trend is especially pronounced in suburban areas, where land is more expensive and less available, leading to higher rent costs and lower tenant churn for smaller warehouse spaces. As a result, warehouses under 100,000 square feet now have a vacancy rate of just 3.9%, compared to 10.9% for larger warehouses, highlighting the significant shortage of smaller spaces available to lease. Additionally, the average size of new 3PL warehousing needs indicates a clear trend toward smaller footprints, driven by increased demand and attractive pricing dynamics.
From Record Scarcity to 1.8 Billion Square Feet of New Supply
The pandemic triggered an unprecedented warehouse land grab. E-commerce penetration surged, consumers stockpiled goods, and supply chain disruptions forced companies to hold more safety stock. Industrial vacancy plunged from 4.9% in early 2020 to an all-time low of roughly 3.0% in Q1 2022. Rents spiked 16% year-over-year in that same quarter. Developers responded with staggering construction: approximately 1.8 billion square feet of new industrial space was delivered across the U.S. between 2020 and 2025, more than the entire previous decade combined.
The correction arrived in 2023. A record 612 million square feet was delivered that year, more than 80% of it built speculatively, yet net absorption fell to just 295 million square feet. Over half the space built in 2023 remained available for lease at year-end. By 2024, net absorption dropped further to 170.8 million square feet, the lowest since 2011. Construction starts collapsed in response, with the under-construction pipeline falling 60% from its peak to roughly 270 million square feet by mid-2025.
Rent growth reflects this shift. After years of double-digit increases, annual rent growth slowed to 2.8% in 2024 and just 1.5% by Q4 2025, the weakest pace since early 2020. Roughly 40% of U.S. markets posted year-over-year rent declines in 2025, with the West Coast down 4.5% and the Northeast off 3.8%. One-third of markets still saw cumulative rent increases of more than 50% between 2020 and 2025, however, meaning the affordability damage from the boom years is already baked in for brands renewing leases now.
Regional Markets Tell Two Very Different Stories
The national average obscures a widening gap between oversupplied Sun Belt boom markets and stubbornly tight logistics hubs. Ecommerce brands choosing warehouse locations based on headline vacancy data risk landing in exactly the wrong market for their customer base.
Markets with excess space
Dallas-Fort Worth saw vacancy hit 9.2% to 11.6% after absorbing more than 115 million square feet of new deliveries since 2023. Phoenix is even more challenged, with overall vacancy at 10.7% to 11.8% and mid-sized warehouse availability exceeding 20%, a glut that could take three or more years to normalize. Savannah soared from a record-low 0.8% vacancy in 2022 to 10.8% to 11.7% after nearly 50 million square feet of deliveries. Memphis sits at roughly 12.7%, the highest in the South. Pennsylvania’s Lehigh Valley corridor saw Class A vacancy climb past 11% with negative net absorption.
Markets that remain genuinely tight
Chicago holds steady at roughly 4.7% vacancy in Q4 2025, with only 1.1% of inventory under construction and 64% of that pre-leased. Kansas City posted the lowest vacancy among major U.S. markets at 4.8%. Houston held at a healthy 6.1%. These markets absorb space steadily because they sit at the center of the country’s population and freight networks.
The split that matters most for ecommerce
The most critical structural gap is between big-box and small-bay space. Large-format warehouses of 300,000 or more square feet hit 10.6% vacancy at mid-year 2025 before settling to 9.8%, a clear oversupply. But small-bay space under 100,000 square feet, exactly what most mid-market ecommerce brands need, remains pinched at just 4.4% to 4.8% nationally, near pre-pandemic lows. The space that got built during the boom does not match the space most brands actually want. Finding a 20,000 to 80,000 square foot facility in a dense metro is still a real challenge.
Pandemic-Era Leases Have Become Expensive Traps
The typical U.S. industrial lease runs five to seven years, with the largest distribution deals averaging 8.2 years in 2025 according to CBRE. Annual rent escalations, which hovered at 2% to 3% before the pandemic, surged during 2021 and 2022. The share of leases carrying escalations above 3% jumped from 7.8% in 2019 to 39.6% in 2022. Current long-term deals carry an average escalation of 3.5% per year. Early termination penalties, when available at all, typically run six to twelve months of rent, plus unamortized tenant improvements and broker commissions. Most commercial warehouse leases contain no early termination clause whatsoever.
The math is punishing for brands that signed during the boom. Total occupancy costs increased 42.2% since 2019 according to Newmark, driven by rent, operating expenses up 19.6%, and insurance up 45%. CBRE found that rental rates on expiring five-year contracts are 25% higher on average compared to when they were signed. But for brands that locked in near the 2022 peak, current market rents have already fallen below their contracted rate. U.S. logistics rents dropped 4.5% year-over-year in 2025 according to Prologis, meaning those tenants are now paying above-market prices with years remaining on their leases.
Amazon’s experience is the most dramatic cautionary tale. The company doubled its fulfillment network in 24 months, leasing 370 million square feet by end of 2021, twice its pre-pandemic footprint. The overshoot contributed to $10 billion in excess costs in the first half of 2022 alone. Amazon subsequently tried to shed at least 14 million square feet through subleases and pullbacks. Pandemic-era lease terms on these spaces extend into 2030 and beyond.
Over 37% of all U.S. industrial leases expire by 2027, many signed at rates far below current market levels but others at 2021 and 2022 peaks. This looming wave of renewals will force difficult decisions on ecommerce brands: renew at rates that may not reflect where their customers actually are, or eat termination penalties and relocate, often prompting a search for order fulfillment case studies from leading 3PL providers to de-risk the next move.
Labor Is the Bottleneck That New Space Cannot Solve
Over 370,000 warehouse jobs sat unfilled in early 2025, a 15% increase from a year earlier. A Descartes survey of 1,000 supply chain leaders found 76% face notable labor shortages, with 37% describing conditions as high to extreme. Warehouse operations and transportation suffer the most. The biggest challenge for warehouse operations is the difficulty in hiring and retaining employees due to a highly competitive job market.
Annual turnover in warehousing runs 46% to 49%, roughly 50% higher than the national average for all industries. Amazon’s turnover rate reaches an estimated 150% annually, with 70% of new hires leaving within 90 days. This churn is extraordinarily expensive. High employee turnover is often due to competition for top talent, with employees leaving for better opportunities. The full cost of replacing a single warehouse worker, including separation, vacancy, recruiting, and ongoing training, averages roughly $18,600 per departure according to KPI Solutions. New hires take six to twelve weeks to reach full productivity. Warehouse labor shortages can lead to inefficiencies such as delayed shipments and fulfillment errors. Investing in employee retention strategies, such as competitive wages and ongoing training, is essential to manage labor shortages. Creating safer jobs in warehouses can help improve employee retention and reduce turnover rates.
Competitive pay, recognition, and clear advancement opportunities help transform warehouse and manufacturing roles into long-term careers. Recruiting from diverse backgrounds opens new doors to skilled and dependable talent, supporting talent development and building a more resilient workforce.
Wages have risen sharply but haven’t closed the gap. Amazon’s starting pay climbed to $22 or more per hour in September 2024, with total compensation exceeding $29 per hour. This forced the entire market upward: UPS warehouse workers negotiated starting pay of $21 per hour in their 2023 Teamsters contract, and Target and Walmart distribution centers reportedly match at $22 per hour. Average warehouse staff hourly rates climbed 48% between 2017 and 2024. While higher wages are a common strategy to address the warehouse labor shortage, they are not the sole solution, and hiring remains difficult due to the competitive labor market. Fulfillment costs spike 30% to 40% during peak seasons due to temporary staffing and overtime, with temp agency fill rates reaching only 70% to 80%. Flexible shifts and dynamic staffing pools can help companies manage labor shortages during peak seasons, and utilizing ecommerce order fulfillment services that outclass traditional 3PLs during peak periods can alleviate pressure on warehouse operations.
Deloitte projects the U.S. will need 3.8 million industrial workers over the next decade but faces a potential shortfall of 1.9 million people. Automation offers a partial solution, with 52% of warehouse operators planning investments over the next three years. But high upfront costs and the shortage of skilled technicians to maintain automated storage and retrieval systems mean relief is years away for most mid-market brands. Automation and technology can help warehouses operate with a reduced physical workforce during labor shortages, and investing in automation technologies can improve safety and stabilize labor needs. Investing in robotics, cobots, and predictive analytics reduces repetitive tasks and gives leaders better visibility into labor planning. Implementing robotics and automation technology helps protect warehouse operations by ensuring they can still function, even with a reduced workforce. Modern warehouse management systems can enhance worker morale by providing clear instructions and real-time feedback. Automation can reduce reliance on manual labor while improving inventory control and overall warehouse operations. The global warehouse automation market is projected to grow significantly, indicating a shift towards automated solutions in response to labor shortages. Companies that implement automation report better inventory turnover rates and enhanced customer satisfaction, especially when paired with an order fulfillment service where peer-to-peer beats old 3PLs. Technology and smart automation can reduce repetitive tasks and improve visibility into labor planning.
Modern warehouse management systems guide workers through order processes with clear instructions, touch screens, and real-time feedback, making workers more confident in their roles.
Shortages of qualified warehouse personnel are causing slower loading cycles and reduced efficiency, limiting warehouse capacity. Collaborating with trade schools and workforce programs can help develop future talent for warehouse operations.
Recently, changes in worker availability and preferences have further impacted labor shortages and workplace conditions in the supply chain.
The key operational reality for ecommerce founders is this: you can sign a new warehouse lease tomorrow and still not be able to staff it consistently. The warehouse labor shortage is not a problem that square footage solves.
Why Adding Space Does Not Fix Fulfillment Cost Issues
The most persistent misconception in ecommerce logistics is that warehouse rent drives fulfillment expense. In reality, rent represents just 3% to 6% of total fulfillment cost per order when outbound shipping is included. The dominant cost drivers are labor at 45% to 65% of warehouse operating costs and outbound shipping at 40% to 70% of total fulfillment cost. Last-mile delivery alone accounts for 53% of all shipping costs, averaging $10 per small urban package and up to $50 for large rural deliveries.
Shipping zone economics dwarf any rent savings. A 5-pound package shipped via FedEx Ground costs roughly $11.98 in Zone 2 (under 150 miles) but $18.42 in Zone 8 (over 1,800 miles), a 54% premium. For UPS the gap widens further. A brand shipping 1,000 packages per month primarily to customers in Zones 7 and 8 instead of Zones 2 and 3 faces over $100,000 in additional annual shipping costs. Cross-country shipments cost 40% to 60% more than regional deliveries.
Carrier rate increases compound the problem. UPS and FedEx have implemented 5.9% general rate increases for three consecutive years through 2026, well above the pre-pandemic norm of 3% to 4%. Surcharges for higher zones have jumped even further, and peak-season residential surcharges have climbed over 25%. USPS Parcel Select rates climbed 9.2% in 2024 with further increases planned.
Increased costs for storage and expedited shipping are compressing profit margins, especially for businesses operating with tight margins. Overcrowded warehouses can also lead to lower productivity and increased safety risks.
The implication is direct. A brand operating from a single West Coast warehouse reaches two-day ground delivery for only a sliver of the U.S. population. Adding a second warehouse doesn’t just reduce rent per order, it fundamentally restructures the shipping cost equation. Two strategically located fulfillment centers, for example Knoxville and Salt Lake City, can reach 96% of U.S. households within two days via ground shipping. Four nodes can provide one to two day delivery to 99.97% of the continental U.S. while cutting shipping costs 15% to 25%. That is a real savings number. A lease in a cheap Sun Belt market with 11% vacancy does not produce anything close to that.
The Role of Technology in Warehouses
Technology is rapidly reshaping how warehouses operate, offering powerful tools to optimize logistics operations, streamline inventory management, and reduce labor costs. Automated storage and retrieval systems are becoming standard in many warehouses, minimizing the need for manual labor and significantly improving accuracy and speed in inventory flow. These systems not only enhance productivity but also help mitigate the risks associated with labor shortages and high turnover. Advanced inventory management software enables companies to track stock levels in real time, optimize storage, and ensure efficient order processing. Data analytics and artificial intelligence are increasingly used to forecast demand, identify operational bottlenecks, and inform strategic decisions across the supply chain, including whether to rely on traditional 3PLs or a peer-to-peer fulfillment network versus 3PL. By embracing these technological advancements, companies can achieve greater efficiency, reduce operational costs, and position themselves for sustainable growth in a highly competitive market.
Innovation—through advancements like artificial intelligence, robotics, and shared logistics platforms—serves as a strategic driver for resilience, operational efficiency, and future growth in logistics.
How Brands Are Rethinking Warehouse Strategy Without New Leases
The rise of fractionalized space and spot warehousing is a direct response to the growing demand for flexible, attractively priced alternatives to traditional long-term leases. Flexible warehousing offers significant opportunities for optimization and enables companies to respond quickly to both short-term disruptions and long-term growth opportunities.
Rather than signing new leases, ecommerce brands are increasingly turning to asset-light fulfillment models. For many, this involves shifting from an in-house warehouse to a 3PL. The numbers suggest this is a structural shift, not a temporary workaround.
Third-party logistics networks
3PLs now handle fulfillment for 60% of ecommerce brands at least partially, with 37% fully outsourcing. The U.S. 3PL market reached $308 billion in 2024 and is projected to nearly double by 2033. For brands shipping under 1,000 orders per month, 3PLs typically cost 20% to 40% less than self-fulfillment thanks to negotiated carrier rates and shared infrastructure, and many sellers rely on top Amazon 3PL shipping companies for reliable fulfillment to capture these advantages. Third party logistics providers play a crucial role in managing inventories, distribution, and fulfillment, especially as the industry faces staffing challenges and market fluctuations. The average size of new 3PL warehousing needs indicates a trend toward smaller footprints.
The strategic advantage is not just cost, it is placement. A 3PL network with nodes in Chicago, Dallas, Atlanta, and Los Angeles reaches the entire U.S. population more efficiently than any single owned or leased facility, and brands evaluating partners should consider providers that support Amazon SFP-focused 3PL fulfillment services and follow a structured approach to choose the right 3PL company.
On-demand and flex warehousing
On-demand warehousing is projected to reach $26.2 billion by 2030 at a 15.3% annual growth rate. Platforms in this space operate networks of thousands of warehouse locations and can stand up new distribution capacity in two to four weeks versus three to nine months for traditional lease implementations. Pricing is consumption-based rather than fixed-lease, converting a long-term capital obligation into a variable operating expense. This model is particularly effective for managing peak season demand without the permanent overhead of excess space and is increasingly attractive for brands evaluating alternatives to traditional 3PL ecommerce fulfillment.
Shared and co-warehousing
Shared warehouse concepts provide small to midsize brands with month-to-month space, shared equipment, and fulfillment services at a fraction of dedicated facility costs. Marketplace sellers reduce warehouse fees an estimated 20% to 30% through shared infrastructure. These arrangements also sidestep the warehouse labor shortage problem, since staffing is handled by the operator, not the brand, making them especially compelling when paired with the best 3PL options for small businesses or a top 3PL for Amazon Seller Fulfilled Prime.
Distributed inventory as a competitive strategy
The brands gaining ground are not chasing the cheapest lease in an oversupplied Sun Belt market. They are reframing the question entirely, moving from “where can we find warehouse space?” to “where do our customers live, and how do we reach them in two days at the lowest total cost?” Analyzing order data by zip code and overlaying it against carrier zone maps reveals, in most cases, that the optimal warehouse footprint looks nothing like the single-facility model most brands start with. That analysis costs nothing, and when layered with a clear understanding of 3PL costs for ecommerce fulfillment, it becomes a powerful decision framework. Committing to the wrong lease costs years.
Warehouse Management Best Practices
Effective warehouse management is the cornerstone of a successful warehouse or distribution center. Implementing best practices such as ongoing training for staff ensures that the workforce remains skilled and adaptable to new technologies and processes. Optimizing inventory management is crucial for maintaining accurate stock levels, reducing excess inventory, and improving order accuracy. Leveraging technology to automate routine tasks and streamline operations can lead to significant gains in productivity and efficiency. Retaining staff through competitive pay and comprehensive benefits is essential, as a stable and experienced workforce directly contributes to operational excellence. Additionally, maintaining a safe and healthy work environment, managing equipment maintenance, and controlling transportation costs are all critical components of effective warehouse management, especially for retailers scaling on platforms like Shopify who must follow a guide to choosing the right Shopify order fulfillment option and choose the best 3PL for their store. By focusing on these areas, companies can reduce operational costs, improve lead times, and drive growth, ensuring their warehouses remain agile and responsive to market demands.
Conclusion
In summary, warehouses and distribution centers are facing a host of challenges, from labor shortages and warehouse space constraints to rising labor costs and evolving supply chain demands. To remain competitive, companies must invest in technology, prioritize staff retention, and implement robust inventory management and logistics operations. Adopting best practices and leveraging technological innovations can significantly enhance productivity, efficiency, and growth while keeping operational costs in check. The warehouse industry is in a state of constant evolution, requiring businesses to stay agile and responsive to shifts in market conditions and customer expectations. As e-commerce continues to drive demand for faster and more reliable fulfillment, optimizing warehouse operations and investing in skilled personnel will be key to long-term success. By proactively addressing these challenges, companies can position themselves at the forefront of the industry, ready to capitalize on new opportunities and navigate the complexities of the modern supply chain.
Frequently Asked Questions
Is there still a warehouse shortage in the United States?
No, not in the broad sense. National industrial vacancy reached approximately 7.1% by late 2025, more than double the historic low of 3.0% set in early 2022. Big-box space in markets like Dallas-Fort Worth, Phoenix, and Memphis is in clear oversupply. However, small-bay space under 100,000 square feet remains tight at 4.4% to 4.8% nationally, and several major logistics hubs including Chicago and Kansas City continue to see healthy demand with limited availability.
Why are ecommerce fulfillment costs still rising if warehouse space is more available?
Warehouse rent represents only 3% to 6% of total fulfillment cost per order. The dominant cost drivers are labor, which accounts for 45% to 65% of warehouse operating costs, and outbound shipping, which can represent 40% to 70% of total cost. Both have increased substantially. Carrier general rate increases of 5.9% per year through 2026, combined with surcharge escalation and the warehouse labor shortage, are pushing total fulfillment costs higher regardless of what is happening to lease rates.
What is the real constraint on warehouse operations today?
For most ecommerce brands, labor availability is the primary operational constraint. Over 370,000 warehouse jobs were unfilled in early 2025. Annual turnover runs 46% to 49% industry-wide, driving constant recruiting, training, and productivity losses. The cost of replacing a single warehouse worker averages roughly $18,600. A brand can sign a new lease in a market with plenty of available space and still struggle to staff it reliably.
How does warehouse location affect shipping costs?
Significantly. Carrier pricing is structured around shipping zones based on the distance between the origin warehouse and the delivery destination. A 5-pound package shipped via FedEx Ground from Zone 2 costs roughly 54% less than the same package shipped from Zone 8. A brand with its only warehouse on the West Coast will ship the majority of U.S. orders at Zone 5 through Zone 8 rates, paying substantially more per package than a brand with strategically placed nodes in the central U.S. For most ecommerce brands shipping 500 or more orders per month, this zone cost difference far exceeds any savings achievable through cheaper rent.
What is a shipping zone and why does it matter for order fulfillment?
Shipping zones are geographic bands that major carriers use to calculate delivery costs based on distance from the origin point. Zone 1 is the closest (under 50 miles) and Zone 8 is the farthest (over 1,800 miles). Every carrier, including UPS, FedEx, and USPS, applies higher rates to higher zones. Brands with inventory located far from their customers’ geographic concentration pay more per shipment on every single order, which compounds significantly at scale.
Should ecommerce brands sign warehouse leases in oversupplied markets to save on rent?
Not without running the full fulfillment cost model first. Cheap rent in an oversupplied market like Phoenix or Memphis may look attractive, but if that location results in a higher average shipping zone for your customer base, the shipping cost increase will likely exceed the rent savings by a wide margin. Labor availability in those markets is also not guaranteed to be better. The correct decision framework starts with analyzing where your customers are located, then working backward to the optimal warehouse placement, then evaluating what lease or third-party fulfillment arrangement makes sense in those locations.
What alternatives exist to signing a traditional warehouse lease?
The main alternatives are third-party logistics networks, which handle space and labor under a pay-per-order or storage-plus-fulfillment model; on-demand warehousing platforms, which offer consumption-based space access without multi-year commitments; and shared or co-warehousing arrangements, which provide month-to-month access to shared facilities and staff. Each removes the fixed-cost structure and long-term obligation of a direct lease, while offering faster setup and the ability to shift nodes as demand patterns change, which is especially important for channels like Wayfair that benefit from the best 3PL for Wayfair order fulfillment.
How long is a typical warehouse lease and what does early termination cost?
Most U.S. industrial leases run five to seven years. Large distribution center deals average 8.2 years. Early termination clauses are not standard, and when they do exist they typically require a penalty of six to twelve months of rent plus reimbursement of unamortized tenant improvements. Many leases offer no early exit at all, meaning brands that sign in the wrong location are effectively committed for the full term. This rigidity is one of the primary reasons asset-light fulfillment models have grown so rapidly among mid-market ecommerce brands.
Written By:
Rinaldi Juwono
Rinaldi Juwono leads content and SEO strategy at Cahoot, crafting data-driven insights that help ecommerce brands navigate logistics challenges. He works closely with the product, sales, and operations teams to translate Cahoot’s innovations into actionable strategies merchants can use to grow smarter and leaner.
Turn Returns Into New Revenue
Related Articles
What Is Demand Planning? How It Impacts Inventory, Forecasting, and Profitability
Demand planning is the process of estimating future customer demand so that a business can align its inventory, procurement, and operations to meet that demand without carrying mor...
Why 100% P2P Adoption Is the Wrong Goal
Peer-to-peer returns let customers send eligible returned items directly to other customers instead of routing every package back through the warehouse, cutting shipping and proces...
Walmart Officially Allows Amazon Multi-Channel Fulfillment (MCF)
Big news for multichannel sellers: Walmart now officially allows Amazon Multi-Channel Fulfillment (MCF), Amazon’s service for using its fulfillment network to ship orders from mult...
Amazon IPI Explained: What the Inventory Performance Index Really Measures

In this article
22 minutes
- Introduction to Amazon Inventory Performance
- The four core components and how they actually interact
- Why IPI is a trailing indicator, not a real-time control knob
- Excess inventory and sell-through mechanics in practice
- Stranded and unavailable inventory impact is disproportionate
- Storage limits and capacity planning implications
- Common myths that do not meaningfully improve IPI
- Practical, durable actions that actually move IPI
- Best Practices for Inventory Management
- Frequently Asked Questions
- Conclusion
Amazon’s Inventory Performance Index (IPI) is widely treated as a mysterious score that sellers must decode and game to avoid storage limits. In reality, IPI is a straightforward lagging indicator of inventory discipline across four core metrics: sell-through rate, excess inventory percentage, stranded inventory percentage, and in-stock rate. It does not respond to quick fixes or tactical tricks. It reflects operational patterns over rolling time windows, meaning the score you see today is driven by inventory decisions you made weeks or months ago. Sellers who understand this fundamental characteristic stop chasing score hacks and start building durable inventory management practices that improve IPI as a byproduct of running a healthier business. Being a successful Amazon seller involves understanding and utilizing various tools and strategies to enhance sales, reduce storage costs, and avoid account restrictions, starting with thorough market and product research to guide your decisions.
The score itself ranges from 0 to 1,000, with Amazon setting a minimum threshold (currently 450 for most sellers) that sellers must maintain their IPI above to avoid penalties and storage limits. Sellers below the minimum threshold face capacity restrictions that can constrain sales during peak season or product launches. Sellers above the threshold receive unlimited storage capacity, subject to standard storage fees. Optimizing IPI also allows brands to negotiate for more storage space within Amazon fulfillment centers. The consequences are operational, not punitive. Low IPI does not trigger account suspension or listing suppression. It restricts how much inventory you can send to Amazon’s fulfillment centers, which indirectly limits sales if you cannot restock fast-selling SKUs.
Introduction to Amazon Inventory Performance
The Amazon Inventory Performance Index (IPI) is a vital metric for any seller using Fulfillment by Amazon (FBA). The inventory performance index measures how efficiently you manage your FBA inventory over time, with a score ranging from 0 to 1,000. A high IPI score signals strong inventory performance, while a low score can lead to storage limits, higher storage fees, and even blocked shipments.
To maintain a good IPI score, sellers must pay close attention to excess inventory, stranded inventory, sell-through rates, and in-stock inventory levels. Each of these factors directly impacts your inventory performance index IPI, influencing both your operational flexibility and your bottom line. By actively managing these areas, you can avoid unnecessary penalties, reduce storage costs, and ensure you’re always ready to meet customer demand. Ultimately, a strong IPI score not only helps you avoid costly storage limits but also improves customer satisfaction by keeping your best products available and your inventory performance healthy.
The four core components and how they actually interact
Amazon calculates IPI using four weighted factors visible in the Inventory Performance Dashboard in Seller Central. While Amazon does not publish the exact weighting formula, the relative importance of each factor is evident from how score movements correlate with changes in each metric.
Sell-through rate measures the ratio of units sold to average units stored over a trailing 90-day period. The formula is: (units sold in last 90 days) divided by (average number of units on hand at an FBA warehouse over the last 90 days). A sell-through rate of 1.0 means you sold 100% of your average inventory in 90 days, or roughly 4 full inventory turns per year. Amazon targets a sell-through rate above 0.5 (two full turns per year). Rates below 0.3 indicate inventory is sitting idle and consuming storage space without generating sales. This metric carries heavy weight in the IPI calculation because it directly measures inventory productivity.
Excess inventory percentage identifies the portion of your FBA inventory that Amazon’s forecasting model predicts will take more than 90 days to sell at current sales velocity. If you have 1,000 units in stock and Amazon forecasts you will sell 100 units over the next 90 days, Amazon flags 900 units as excess (90% excess inventory). The calculation updates weekly based on recent sales trends and seasonality adjustments. Excess inventory drives higher storage fees because it occupies space longer, and Amazon penalizes it in the IPI score to incentivize sellers to reduce overstock through sales, promotions, or removal.
Stranded inventory percentage measures the portion of FBA inventory that has no active listing and cannot be sold. Common causes include suppressed listings (policy violations, restricted products, missing required attributes), closed listings, or inventory in unsellable condition awaiting removal decisions. Stranded inventory is dead weight. It incurs storage fees but generates zero revenue. Amazon heavily penalizes stranded inventory in IPI because it represents pure inefficiency. Even small amounts of stranded inventory (2 to 3% of total units) can drag down IPI scores meaningfully.
In-stock rate (also called FBA in-stock rate) tracks the percentage of time your top-selling SKUs had available inventory over the trailing 30 days. Amazon identifies your replenishable FBA SKUs that sold at least one unit in the last 60 days, then measures what percentage of days those SKUs were in stock. If you have 10 replenishable SKUs and 8 of them were in stock every day while 2 were out of stock for half the month, your in-stock rate is approximately 85%. This metric incentivizes availability. Stockouts on best-sellers hurt IPI because they represent lost sales and missed revenue, both of which Amazon wants to minimize.
These four factors interact in ways that create tradeoffs. Reducing excess inventory by removing slow-moving stock improves excess inventory percentage but may temporarily reduce sell-through rate if you remove units that had some residual sales velocity. Increasing in-stock rate by sending more inventory can improve availability but may increase excess inventory if demand forecasts are wrong. The optimization challenge is balancing these tensions to maintain high sell-through, low excess, zero stranded inventory, and consistent availability. Effective inventory planning is essential for balancing these four factors and maintaining optimal IPI scores.
Why IPI is a trailing indicator, not a real-time control knob
The single most important characteristic of IPI that sellers misunderstand is its time lag. IPI reflects inventory performance over rolling 90-day windows (for sell-through and excess) and 30-day windows (for in-stock rate). Changes you make today will not move the score immediately. They will gradually influence the score as old data ages out of the calculation window and new data ages in.
If you fix all stranded inventory today, your stranded inventory percentage drops to zero immediately. But your IPI score will not jump instantly because the other three factors (sell-through, excess, in-stock) are still calculated over trailing periods. If your sell-through rate has been 0.25 for the past 90 days and you increase sales velocity today, it will take weeks for the improved sales rate to raise the 90-day average meaningfully.
This lagging characteristic means IPI cannot be “gamed” in the sense that sellers can make a quick change and see an immediate score boost. The sellers who maintain consistently high IPI (above 600) are the ones who built inventory disciplines that produce good metrics over time: regular sales velocity, accurate demand forecasting that prevents overstock, immediate resolution of stranded inventory, and proactive restocking to avoid stockouts. Using accurate sales forecasts and aligning inventory levels with expected sales helps prevent both overstock and understock situations, both of which impact your IPI score. These are operational habits, not tactics.
Sellers who wait until their IPI drops below the threshold and then scramble to “fix” it are fighting the time lag. Even if they take correct actions (remove excess inventory, fix stranded listings, increase sales), the score will take 4 to 8 weeks to reflect those changes fully. During that period, storage limits remain in place, constraining their ability to restock and grow.
Excess inventory and sell-through mechanics in practice
Excess inventory is the most misunderstood IPI component because Amazon’s forecasting model operates as a black box. Sellers see the excess inventory percentage in the dashboard but do not see the underlying sales forecast or how Amazon calculates 90-day supply.
Amazon’s forecast is based on recent sales velocity (heavily weighted toward the last 30 days), adjusted for seasonality, promotional activity, and broader category trends. If a SKU sold 30 units in the last 30 days, Amazon might forecast 90 units over the next 90 days (assuming stable velocity). If you have 200 units in stock, Amazon flags 110 units as excess (55% excess). If sales accelerate and you sell 50 units in the next 30 days, Amazon’s forecast will increase, and the excess classification will shrink.
The practical implication is that excess inventory is dynamic, not static. Sellers can reduce excess inventory through three levers: increasing sales velocity (promotions, advertising, pricing adjustments), reducing inventory levels (removal orders, liquidation), or waiting for sales to catch up to inventory naturally. The fastest path is increasing sales velocity because it simultaneously improves sell-through rate and reduces excess inventory percentage. Excess stock can lead to increased storage costs and negatively impact inventory health, so identifying and reducing excess stock is crucial.
Removing inventory is a last resort because it incurs removal fees, generates no revenue, and reduces the absolute inventory level that the sell-through rate denominator uses (which can temporarily hurt sell-through if the removed units had any sales velocity). The exception is truly dead inventory (zero sales in 90+ days, discontinued products, seasonal items post-season). That inventory should be removed immediately because it drags down IPI with no upside. Aged inventory (stock held for over 365 days) can incur long-term storage fees and should be proactively managed to avoid unnecessary surcharges. Out-of-season products can be managed through outlet deals to quickly reduce overstock, or by shifting surplus into Amazon AWD bulk storage for lower-cost holding.
Sell-through rate optimization requires balancing inventory inflow with outflow. Sellers who send large replenishment shipments every 8 to 12 weeks create spiky inventory levels that reduce average sell-through. Sellers who send smaller, more frequent shipments (every 3 to 4 weeks) smooth inventory levels and maintain higher sell-through rates. This is operationally more complex but improves IPI and reduces storage fees by keeping average inventory lower. Monitoring products with the lowest sell-through helps identify underperforming SKUs so you can take action. Low sell-through rates can hurt inventory health and increase storage costs, so improving these rates is essential. Maintaining a healthy sell-through rate on Amazon is key to qualifying for better IPI scores. The FBA sell-through rate is a key metric for assessing inventory turnover and sales efficiency.
Stranded and unavailable inventory impact is disproportionate
Stranded inventory represents a category of failure that Amazon penalizes heavily in IPI because it is entirely within the seller’s control and has no legitimate business justification. Inventory becomes stranded when listings are suppressed, closed, or removed from search due to policy violations, missing attributes, restricted ASINs, or incorrect categorization. The inventory is physically in Amazon’s warehouse, incurring storage fees, but cannot be sold.
The operational fix is straightforward but requires active monitoring. Sellers should check the “Fix Stranded Inventory” button in the Inventory Performance Dashboard at least weekly. Amazon flags stranded inventory and provides specific resolution actions (relist the product, complete missing attributes, remove the inventory, open a case to resolve a policy issue). Most stranded inventory issues can be resolved within 24 to 48 hours if addressed immediately.
The IPI impact of even small amounts of stranded inventory is disproportionate. A seller with 10,000 total units and 200 stranded units (2% stranded) can see their IPI drop by 50 to 100 points depending on the other factors. This is because stranded inventory contributes nothing positive (no sales, no availability) while imposing costs (storage fees, wasted capacity). Amazon’s algorithm treats it as dead weight.
Unavailable inventory (inventory in damaged, defective, or customer-damaged condition) has a similar effect. This inventory cannot be sold until the seller creates a removal order or Amazon disposes of it. Programs like Amazon FBA Grade and Resell can help recover value from eligible returns, but sellers should configure automatic removal for unsellable inventory to prevent it from accumulating and dragging down IPI.
Storage limits and capacity planning implications
IPI’s operational consequence is storage capacity limits. Sellers with IPI below 450 face volume-based storage limits measured in cubic feet. The limit varies by seller and fluctuates based on historical sales performance and seasonal demand, but it typically ranges from 10 to 50 cubic feet for small sellers and up to several hundred cubic feet for high-volume sellers. Sellers above 450 IPI have unlimited storage capacity (subject to standard storage fees).
Storage limits constrain growth in two ways. First, they prevent sellers from sending enough inventory to fulfill demand during peak season (Q4, Prime Day, category-specific events). If a seller’s storage limit is 100 cubic feet and their peak inventory requirement is 200 cubic feet, they cannot stock adequately and will experience stockouts, lost sales, and reduced in-stock rate (which further hurts IPI in a negative feedback loop). Preparing well in advance with a structured peak holiday season operations plan and determining how much stock to keep in inventory requires careful demand forecasting and ongoing monitoring to avoid both overstocking and stockouts.
Second, storage limits prevent sellers from launching new products or expanding their catalog because each new SKU consumes storage capacity. A seller at or near their storage limit must choose between maintaining stock depth on existing best-sellers or adding new SKUs. This forces tradeoffs that limit strategic flexibility.
The capacity planning implication is that sellers should manage IPI proactively to maintain scores above 450 at all times, not just when limits are about to be imposed. Maintaining healthy inventory levels is crucial for operational flexibility and helps avoid unnecessary storage fees and shifting FBA storage-type limits that affect your IPI strategy. Amazon reviews IPI scores and adjusts storage limits quarterly (typically weeks before the start of each quarter). A seller whose IPI drops to 440 in mid-March may find their Q2 storage limit reduced in April, constraining their ability to restock for Q2 demand. Effective inventory management is essential for maintaining a healthy seller account and avoiding issues that can impact sales and account standing.
Common myths that do not meaningfully improve IPI
Several widely circulated tactics are believed to improve IPI but have minimal or no impact in practice. Understanding what does not work prevents wasted effort.
Removing small amounts of slow-moving inventory to “boost the score” has negligible impact unless the inventory being removed represents a large percentage of total excess units. Removing 50 units from a 10,000-unit inventory does not move the excess inventory percentage meaningfully. The effort is better spent increasing sales on those units through promotions.
Sending inventory to Amazon and immediately removing it to increase “inventory turnover” is ineffective and costly. This tactic assumes that higher turnover (calculated as units shipped in divided by units removed out) improves IPI. It does not. IPI measures units sold to customers, not units cycled through the warehouse. Removal orders incur fees and generate no revenue.
Manipulating listings to temporarily increase sales velocity during the IPI calculation window (for example, running deep discounts for a few days to spike sales) has minimal durable impact because IPI uses 90-day trailing averages. A 3-day sales spike raises the 90-day average by less than 5%, which translates to a negligible IPI movement. Sustainable sales velocity improvements over weeks or months are required to move IPI meaningfully.
Focusing only on stranded inventory while ignoring excess and sell-through will not raise IPI above thresholds. Stranded inventory is important, but it is only one of four factors. Sellers with zero stranded inventory but 60% excess inventory and 0.2 sell-through rate will still have low IPI scores.
Practical, durable actions that actually move IPI
The operational changes that improve IPI durably are the same changes that improve overall inventory health, reduce storage costs, and increase profitability. This is not coincidental. Amazon designed IPI to incentivize behaviors that benefit both the seller and the platform, including closely analyzing your FBA returns to reduce preventable losses.
Increase sales velocity on slow-moving SKUs through targeted advertising, promotions, bundling, or pricing adjustments. A SKU with 100 units in stock and 10 units sold per month (0.33 sell-through rate) that increases to 20 units sold per month (0.67 sell-through rate) improves both sell-through rate and excess inventory percentage. This is the highest-leverage action available.
Reduce replenishment lead times and order smaller, more frequent shipments to smooth inventory levels and reduce average inventory on hand. Instead of sending 1,000 units every 10 weeks, send 250 units every 2.5 weeks. The total quantity is the same, but average inventory is lower, sell-through is higher, and excess inventory is reduced. Monitoring FBA storage fees is also crucial—keeping an eye on these fees helps prevent penalties and manage restock limits effectively.
Implement weekly monitoring of stranded and unavailable inventory and resolve issues within 48 hours. Set a recurring calendar reminder to check the “Fix Stranded Inventory” button every Monday. This prevents small issues from accumulating into large IPI drags.
Improve demand forecasting accuracy to prevent overstock and understock. Use Amazon’s demand forecasting tools, third-party inventory management software, or manual analysis of sales trends to align inventory levels with expected demand. Overstock drives excess inventory. Understock drives stockouts and low in-stock rate. Both hurt IPI.
Discontinue or liquidate dead inventory (zero sales in 90+ days, end-of-life products, seasonal items post-season) immediately rather than letting it sit in FBA warehouses. Create removal orders, donate inventory through Amazon’s programs, or use liquidation services. Dead inventory is a guaranteed IPI drag with no recovery path.
Maintain in-stock rates above 90% on replenishable SKUs by setting reorder points based on lead time and safety stock calculations. Stockouts hurt sales, reduce IPI, and create negative feedback loops where lost sales reduce forecasted demand, which reduces future inventory allocations.
Best Practices for Inventory Management
Achieving and maintaining a high IPI score requires disciplined inventory management and a proactive approach to your FBA inventory. Start by regularly monitoring your inventory levels and using the inventory performance dashboard to identify and address stranded inventory before it becomes a problem. Maintaining a balanced inventory level is crucial—too much excess inventory can drag down your IPI score and lead to higher long-term storage fees, while too little can result in stockouts and missed sales opportunities.
To reduce excess inventory, analyze your sales data to identify slow-moving SKUs and take action through targeted promotions, price adjustments, or removal orders. Tools like Seller Labs SKU Economics can help you pinpoint low-velocity products and make data-driven decisions to optimize your inventory performance. Always prioritize keeping your best-selling items in stock, as Amazon rewards sellers who consistently meet customer demand with higher IPI scores and better visibility.
By implementing these inventory management best practices—reducing excess inventory, fixing stranded inventory promptly, and aligning stock levels with forecasted demand—you can lower storage fees, improve your IPI score, and increase your sales velocity. The result is a healthier, more profitable Amazon business that’s well-positioned to meet customer needs.
Frequently Asked Questions
What is Amazon’s Inventory Performance Index (IPI) and why does it matter?
Amazon’s Inventory Performance Index (IPI) is a score from 0 to 1,000 that measures FBA inventory management efficiency across four metrics: sell-through rate, excess inventory percentage, stranded inventory percentage, and in-stock rate. IPI matters because sellers below the threshold (currently 450) face storage capacity limits measured in cubic feet, constraining how much inventory they can send to fulfillment centers. This restricts sales during peak seasons and limits catalog expansion. Sellers above 450 receive unlimited storage capacity subject to standard fees. IPI is a lagging indicator calculated over rolling 90-day windows, not a real-time score.
How is Amazon IPI score calculated and what are the four components?
Amazon calculates IPI using four weighted factors: (1) Sell-through rate = units sold in last 90 days divided by average inventory over 90 days (target above 0.5); (2) Excess inventory percentage = portion of inventory forecasted to take 90+ days to sell at current velocity; (3) Stranded inventory percentage = portion of inventory with no active listing and cannot be sold; (4) In-stock rate = percentage of days top-selling replenishable SKUs were available over last 30 days. Amazon does not publish exact weights, but sell-through and excess inventory carry the heaviest influence. All metrics use trailing time windows (30-90 days).
Why does my Amazon IPI score not improve immediately after I make changes?
IPI is a lagging indicator calculated over rolling 90-day windows (for sell-through and excess inventory) and 30-day windows (for in-stock rate). Changes made today gradually influence the score as old data ages out and new data ages in. If you fix stranded inventory today, that component improves immediately, but sell-through and excess metrics reflect the last 90 days of performance. Even correct actions (removing excess inventory, increasing sales, fixing stranded listings) take 4-8 weeks to fully impact the score as the trailing average updates. This is why IPI cannot be “gamed” with quick fixes.
What is excess inventory on Amazon and how do I reduce it?
Excess inventory is the portion of FBA inventory that Amazon’s forecasting model predicts will take more than 90 days to sell at current sales velocity. If you have 200 units in stock and Amazon forecasts you will sell 90 units over the next 90 days, 110 units are flagged as excess (55%). Reduce excess inventory through three levers: (1) Increase sales velocity via promotions, advertising, or pricing adjustments (fastest method, also improves sell-through); (2) Reduce inventory levels via removal orders or liquidation (last resort, incurs fees); (3) Wait for sales to catch up naturally. Truly dead inventory (zero sales in 90+ days) should be removed immediately.
What is stranded inventory and why does it hurt IPI so much?
Stranded inventory is FBA inventory with no active listing that cannot be sold, typically due to suppressed listings (policy violations, missing attributes), closed listings, or restricted ASINs. It sits in Amazon warehouses incurring storage fees but generates zero revenue. Amazon heavily penalizes stranded inventory in IPI because it represents pure inefficiency entirely within seller control. Even 2-3% stranded inventory can drop IPI by 50-100 points. Complement this with tactics to protect listings from suppression, hijackers, and stockouts. Fix stranded inventory by checking the “Fix Stranded Inventory” button in Seller Central weekly and resolving issues within 24-48 hours (relist products, complete missing attributes, remove inventory, resolve policy issues).
What is a good Amazon IPI score and what happens if I’m below the threshold?
A good IPI score is above 450, which is Amazon’s current threshold for unlimited storage capacity. Scores above 600 indicate excellent inventory health. Sellers below 450 face volume-based storage limits (measured in cubic feet) that constrain how much inventory they can send to fulfillment centers. This restricts sales during peak season (Q4, Prime Day), prevents adequate restocking of best-sellers, and limits catalog expansion. Low IPI does not trigger account suspension or listing suppression, but storage limits indirectly limit sales. Amazon reviews IPI quarterly and adjusts storage limits weeks before each quarter starts.
How can I improve my Amazon sell-through rate to raise IPI?
Improve sell-through rate (units sold in last 90 days divided by average inventory) through: (1) Increase sales velocity on slow-moving SKUs via targeted advertising, promotions, bundling, or pricing adjustments; (2) Reduce average inventory levels by sending smaller, more frequent replenishment shipments (e.g., 250 units every 2.5 weeks instead of 1,000 units every 10 weeks); (3) Discontinue or liquidate dead inventory (zero sales in 90+ days) immediately; (4) Improve demand forecasting accuracy to prevent overstock. Target sell-through above 0.5 (two full inventory turns per year). Rates below 0.3 indicate idle inventory consuming storage without generating sales.
What actions actually improve IPI versus myths that don’t work?
Actions that work: (1) Increase sales velocity on slow-moving SKUs through promotions/advertising; (2) Send smaller, more frequent shipments to smooth inventory levels; (3) Fix stranded inventory within 48 hours via weekly monitoring; (4) Improve demand forecasting to prevent overstock/understock; (5) Remove dead inventory immediately; (6) Maintain 90%+ in-stock rates on replenishable SKUs. Myths that don’t work: (1) Removing small amounts of slow inventory (negligible impact unless large percentage of total); (2) Sending inventory then immediately removing it to “boost turnover” (IPI measures sales, not warehouse cycling); (3) Running short-term sales spikes (90-day averages dilute 3-day spikes); (4) Focusing only on stranded inventory while ignoring excess and sell-through.
Conclusion
In summary, effective inventory management is the foundation for maintaining a high IPI score, reducing storage fees, and delivering excellent customer satisfaction on Amazon. By following best practices—such as monitoring inventory levels, reducing excess inventory, and promptly addressing stranded inventory—you can improve your inventory performance and stay ahead of storage limits.
Regularly tracking your IPI score and taking swift action on slow-moving, excess, or stranded inventory is essential for sustaining healthy inventory performance. Leveraging tools like Seller Labs Restock app and SKU Economics can help you forecast demand, avoid stockouts, and reduce excess inventory, making it easier to manage your FBA inventory efficiently.
Ultimately, a strong focus on inventory management not only helps you reduce costs and avoid penalties but also positions your business for greater sales velocity and long-term success in the Amazon marketplace. By prioritizing inventory health and customer satisfaction, you can achieve a consistently high IPI score and build a more profitable, resilient Amazon business.
Written By:
Rinaldi Juwono
Rinaldi Juwono leads content and SEO strategy at Cahoot, crafting data-driven insights that help ecommerce brands navigate logistics challenges. He works closely with the product, sales, and operations teams to translate Cahoot’s innovations into actionable strategies merchants can use to grow smarter and leaner.
Turn Returns Into New Revenue
Related Articles
What Is Demand Planning? How It Impacts Inventory, Forecasting, and Profitability
Demand planning is the process of estimating future customer demand so that a business can align its inventory, procurement, and operations to meet that demand without carrying mor...
The Shipping Speed Paradox: Why DTC Brands Are Slowing Down
Everyone’s talking about faster delivery.
Why Cross-Border DTC Brands Are Moving Fulfillment Inside the US
Cross-border ecommerce fulfillment is the process of shipping ecommerce orders across national borders—often from warehouses outside the United States to U.
What Is Expedited Shipping on Amazon (And Why It’s Often Misunderstood)
In this article
21 minutes
- What Expedited Shipping Means on Amazon
- The Operational Mechanics Behind Expedited Shipping
- Expedited Shipping Versus Standard and Two-Day Delivery
- The Cost Structure Behind Faster Delivery Promises
- Inventory Placement Determines Whether Expedited Shipping Works
- When Expedited Shipping Improves Conversion and When It Hurts Margin
- Operational Risks of Promising Faster Delivery
- Frequently Asked Questions
Expedited shipping on Amazon is one of the most frequently misunderstood mechanics in ecommerce fulfillment. Expedited shipping is a method of shipping that ensures goods reach their destination faster than standard delivery, typically guaranteeing delivery within one or two days—often as overnight or 2-day delivery. In contrast, standard delivery is a more conventional, cost-effective shipping option that can take anywhere from 3 to 10 days, and is generally less expensive than expedited shipping. Expedited shipping is generally more expensive due to its faster delivery times, but it is one of several delivery methods available to customers. Customers expect fast and reliable shipping options, so offering an affordable expedited delivery option can help online stores meet customer expectations and reduce cart abandonment.
Sellers assume that selecting a faster carrier service at the shipping label stage will result in faster delivery to the customer. In most cases, it will not. The delivery speed promise Amazon displays to shoppers is determined by inventory location, fulfillment node proximity to the destination, cutoff times, and order processing latency long before a shipping service is selected. By the time a seller chooses between standard ground and expedited shipping, the delivery outcome has already been locked in by upstream operational decisions the seller may not even be aware of.
This distinction matters because sellers routinely overspend on expedited carrier services, believing they are improving customer experience, when in reality they are paying for speed that inventory placement already made impossible to deliver. Understanding what expedited shipping actually controls versus what it cannot change is the difference between strategic shipping spend and wasted margin.
Amazon’s delivery promise is not the same as your shipping service
When a customer places an order on Amazon, the product listing displays an estimated delivery date range. This estimate is Amazon’s delivery promise to the shopper. It is calculated based on the customer’s location, the item’s inventory location, historical delivery performance data, carrier transit times, and current network capacity. The delivery promise is what the customer sees and expects.
The shipping service is the carrier method used to transport the package from the fulfillment center to the customer’s address (UPS Ground, USPS Priority Mail, FedEx Express, and similar). For Fulfillment by Amazon (FBA) sellers, Amazon selects the shipping service automatically based on internal fulfillment optimization logic. For seller-fulfilled orders, the seller chooses the shipping service when purchasing the shipping label. Expedited shipping is a delivery option that promises faster shipping speeds compared to standard shipping options, and is one of several delivery methods available.
The critical insight is that Amazon’s delivery promise is not derived from the shipping service. It is derived from the fulfillment node’s distance to the customer. If the inventory is located in a fulfillment center 200 miles from the customer, Amazon will promise delivery in 1 to 2 days using standard ground shipping. If the same item is stored 2,000 miles away, Amazon might promise delivery in 3 to 5 days even if the seller uses expedited shipping, because the transit time required exceeds what expedited services can compress. Expedited shipping cost is generally higher than standard shipping due to faster delivery times and priority handling.
This is why sellers often pay for two-day or overnight shipping only to see the delivery promise remain unchanged. The delivery window was already set by where the inventory lives relative to where the customer is, and upgrading the carrier service cannot overcome that distance. Clear communication about the cost of expedited shipping helps build trust and reduces cart abandonment.
Inventory placement determines speed before shipping service matters
Amazon’s fulfillment network operates on proximity-driven fulfillment logic. When a customer places an order, Amazon’s system identifies which fulfillment center holds that SKU and is closest to the delivery address. The order is routed to that node for picking, packing, and shipping. If the seller uses FBA and has distributed inventory across multiple fulfillment centers through Amazon’s Inbound Placement Service, Amazon can route the order to a nearby node and deliver quickly using ground shipping. Distributing inventory across multiple fulfillment centers can reduce shipping times and costs for domestic deliveries, making it easier to offer expedited shipping options like same-day, next-day, or two-day guarantees.
If the seller only has inventory in a single fulfillment center on the opposite coast, every order to the distant half of the country requires long-haul transit. No expedited carrier service can reduce a 2,500-mile shipment to same-day delivery. The physics of distance set a floor on delivery time that carrier speed cannot bypass.
For seller-fulfilled orders, the constraint is even tighter. The seller’s warehouse location is fixed. If a California-based seller ships to a New York customer, the package must travel approximately 2,800 miles. Standard ground takes 5 to 7 business days. Upgrading to expedited two-day service might cut that to 3 days, but it will not match the 1 to 2 day delivery promise that an FBA seller with East Coast inventory can offer using ground shipping at a fraction of the cost. Outsourcing order fulfillment to a third-party logistics provider (3PL) can be a cost-effective solution for optimizing shipping methods and reducing delivery times, as 3PLs can leverage multiple locations and carrier discounts to improve order fulfillment efficiency.
The operational takeaway is that inventory placement is the primary lever for delivery speed. Shipping service selection is a secondary lever that only matters within the transit time window that geography has already established. Choosing the right shipping methods and fulfillment strategies is key to meeting customer expectations for fast domestic deliveries.
Cutoff times and order processing latency eat into delivery windows
Even when inventory is located close to the customer, delivery speed is constrained by when the order is processed and when the carrier picks up the package. Timely order pickup is crucial for expedited orders, as it ensures that the fast shipping options, such as two-day or next-day delivery, can be met. Amazon enforces strict cutoff times for same-day and next-day delivery promises. An order placed after the cutoff time, even by minutes, typically shifts the delivery promise by a full day.
For FBA sellers, Amazon handles order processing and generally achieves same-day shipment for orders placed before the cutoff (usually between 12 PM and 2 PM local time depending on the fulfillment center). For seller-fulfilled orders, the seller is responsible for processing the order, picking and packing the item, and handing it to the carrier within the handling time window specified in the seller’s settings. If the seller’s handling time is set to 2 business days, Amazon’s delivery promise automatically adds 2 days before transit time is even calculated.
This is where many sellers lose delivery speed without realizing it. A seller-fulfilled merchant who sets a 2-day handling time and uses standard ground shipping will show a delivery promise of 5 to 8 days for a cross-country order (2 days handling plus 3 to 6 days transit). Upgrading to expedited shipping might reduce transit time to 2 days, but the delivery promise still shows 4 to 6 days (2 days handling plus 2 days transit). The seller paid extra for expedited shipping but only compressed the delivery window by 1 to 2 days because handling time consumed the advantage.
Failing to optimize order processing and order pickup can result in a negative delivery experience, which may impact customer loyalty and increase cart abandonment rates. Expedited shipping can help reduce cart abandonment rates and build customer loyalty by providing a fast and reliable delivery experience.
Reducing handling time to 0 or 1 day has a larger impact on delivery speed than upgrading shipping service, and it costs nothing.
FBA versus seller-fulfilled creates different expedited shipping dynamics
For FBA sellers, expedited shipping is largely irrelevant as a cost decision because Amazon controls shipping service selection. Amazon’s algorithm chooses the cheapest carrier service that meets the delivery promise. If ground shipping from a nearby fulfillment center delivers in 2 days, Amazon uses ground shipping. If the nearest inventory is far from the customer and ground shipping would miss the delivery promise, Amazon upgrades to expedited or express shipping automatically and absorbs the cost difference.
FBA sellers do not pay per-shipment carrier costs. They pay fulfillment fees that are tiered by size and weight, and those fees are the same regardless of which carrier service Amazon uses. Expedited shipping is usually the most expensive delivery option retailers offer, and expedited shipping cost is influenced by factors such as package weight. The seller’s only leverage over delivery speed is influencing where Amazon places inventory through the Inbound Placement Service and maintaining adequate stock levels so Amazon can distribute inventory closer to demand centers.
For seller-fulfilled orders, the seller pays the actual carrier shipping cost per label. This creates a direct tradeoff between shipping cost and delivery promise. A seller who consistently uses expedited shipping to meet aggressive delivery promises will spend significantly more per order than a seller who uses standard shipping with strategically located inventory or shorter handling times. There is an extra cost associated with expedited shipping, and requiring a minimum spend threshold can help offset these costs. Offering free expedited shipping for orders above a minimum spend can incentivize customers to increase their order size, raising the average order value.
The faster you want something delivered, the more your carrier is going to charge you, making expedited shipping typically more expensive than standard shipping.
The cost difference is substantial. A 5-pound package shipped from Los Angeles to New York costs approximately $8 to $12 via USPS Priority Mail (2 to 3 day service) versus $30 to $45 via FedEx or UPS expedited two-day service. Sellers who rely on carrier speed instead of operational speed are often spending three to four times more per shipment than necessary.
When expedited shipping does not improve delivery speed
There are specific scenarios where paying for expedited shipping produces no improvement in the delivery promise Amazon shows to the customer. Expedited shipping often comes with more guarantees than standard shipping options, such as dedicated delivery times. Recognizing these scenarios prevents wasted shipping spend.
If the order is placed after the daily cutoff time, expedited shipping cannot move the delivery date earlier because the package will not ship until the next business day regardless of carrier service. The delivery promise already accounts for this delay.
If the seller’s handling time setting is 2 days or more, the delivery promise is dominated by processing time, not transit time. Upgrading from 5-day ground transit to 2-day expedited transit reduces total delivery time by only 3 days, but the customer still waits 2 additional days for the seller to process the order. The marginal benefit of expedited shipping is diluted by handling time.
If the item is located in a fulfillment center very close to the customer (same metro area, within 100 to 150 miles), standard ground already delivers in 1 to 2 days. Expedited shipping offers no additional speed because ground transit is already fast enough to meet or exceed the delivery promise.
If the destination is rural or remote and subject to extended delivery area surcharges, expedited shipping may still take longer than expected because the carrier’s service level commitments do not apply to those areas. A two-day expedited service might take three to four days to a rural address, and the seller has paid a premium for a service level the carrier did not deliver. The shipping speed and delivery options available to customers can vary based on the carrier and the specific expedited service used.
Benefits of Expedited Shipping Options
Expedited shipping options deliver significant advantages for both ecommerce businesses and their customers. By offering expedited delivery, online retailers can meet rising customer expectations for faster delivery times, which is crucial in today’s competitive ecommerce landscape. When customers know they can receive their orders sooner, they’re less likely to abandon their carts, leading to higher conversion rates and reduced cart abandonment.
For customers, expedited shipping means access to delivery options like priority mail express, overnight delivery, and two-day shipping. These expedited shipping services are especially valuable for time-sensitive purchases, such as gifts or urgent supplies, and can transform a standard shopping experience into one that builds customer loyalty.
Offering a range of expedited shipping options, including same-day delivery, next-day delivery, and two-day delivery, allows businesses to tailor their delivery method to different customer needs and budgets. For online retailers, this flexibility can be a key differentiator, especially when competing with larger marketplaces or brands that already offer fast shipping.
Expedited shipping options can also help businesses manage customer expectations more effectively. By clearly presenting delivery estimates and shipping costs at checkout, retailers can build trust and give shoppers confidence in their purchase. In many cases, the availability of expedited shipping can be the deciding factor that turns a browsing customer into a buyer, making it an essential part of a modern ecommerce shipping strategy.
How sellers can reduce delivery time without paying for expedited shipping
The operational solution to faster Amazon delivery is not paying for faster carrier services. It is optimizing the variables Amazon uses to calculate delivery promises in the first place.
For seller-fulfilled orders, the biggest levers are: (1) Reducing handling time to 0 or 1 day through same-day order processing and carrier pickups; (2) Using regional fulfillment centers or 3PLs to position inventory closer to customers (West Coast and East Coast facilities cover most U.S. customers within 1 to 3 days ground); (3) Multi-carrier rate shopping to identify which carrier delivers fastest to each zone at the lowest cost; (4) Ensuring orders placed before cutoff time ship the same day.
Sellers can also ship expedited orders by partnering with multiple carriers such as FedEx, UPS, and USPS, and by optimizing order fulfillment processes to offer same-day, two-day, or next-day shipping options that meet customer expectations and stay competitive while still complying with Amazon Seller Fulfilled Prime (SFP) guidelines.
These operational changes deliver 1 to 3 day ground shipping nationwide at $8 to $12 per package versus $30 to $45 for expedited services.
For FBA sellers, the levers are different because Amazon controls shipping service selection. Amazon’s Inbound Placement Service, Amazon AWD, and inventory distribution recommendations exist to position inventory closer to customers. Sellers who send all inventory to a single fulfillment center force Amazon to ship long distances, which increases the delivery promise and increases the likelihood Amazon will upgrade to expedited shipping at the seller’s indirect cost through higher fulfillment fees.
Using regional carriers or regional fulfillment partners can also compress delivery windows without paying for national expedited services. A seller with West Coast customers might partner with a 3PL in California and an East Coast 3PL in New Jersey, splitting inventory between the two. Orders route to the nearest facility and ship via ground, achieving 1 to 3 day delivery nationwide without expedited carrier costs, making third-party logistics ecommerce fulfillment a compelling alternative to relying solely on Amazon FBA.
Multi-carrier rate shopping compares the actual cost and transit time across carriers for each destination and selects the best option per shipment. Some USPS services deliver faster than UPS Ground to certain zones at lower cost. Without rate shopping, sellers default to a single carrier and miss these opportunities. Understanding 3PL ecommerce fulfillment costs and selecting the best 3PL partner for platforms like Shopify are key steps in building a cost-effective multi-node, multi-carrier strategy.
The operational reality of Amazon expedited shipping
Expedited shipping on Amazon is a service-level upgrade at the carrier layer. It is not a delivery speed upgrade at the customer promise layer unless all upstream variables (inventory location, handling time, cutoff time, carrier pickup schedule) are already optimized. Sellers who treat expedited shipping as the primary tool for faster delivery are solving the wrong problem.
The correct framing is that delivery speed is an operational outcome determined by fulfillment geography and process efficiency. Shipping service selection is a cost-optimization decision within the constraints that geography and process have already established. A seller with same-day handling and inventory positioned in two or three regional fulfillment nodes can deliver faster using standard ground than a seller with two-day handling and single-location inventory can deliver using expedited shipping, and the former will spend 40 to 60 percent less per shipment doing it. Using multiple carriers can help offer the fastest domestic service and a cost-effective solution, especially for customers who shop online and expect rapid, affordable delivery options.
Frequently Asked Questions
What does expedited shipping mean on Amazon?
Expedited shipping on Amazon refers to faster carrier services (USPS Priority Mail, FedEx Two-Day, UPS Second Day Air) that reduce transit time compared to standard ground shipping. Expedited shipping is often used interchangeably with express delivery, but express delivery is typically faster and considered a premium service. Expedited shipping can also include package tracking, allowing customers to monitor their shipment’s progress. However, the delivery promise Amazon shows customers is determined by inventory location, fulfillment center proximity to the destination, handling time, and cutoff times before the shipping service is selected. For programs like Amazon Seller Fulfilled Prime (SFP), these dynamics are even more critical because sellers must meet Prime-level delivery promises through their own operations. For FBA sellers, Amazon chooses the shipping service automatically. For seller-fulfilled orders, sellers choose the service when purchasing labels. Expedited shipping only improves delivery speed when inventory placement and handling time are already optimized.
Why does upgrading to expedited shipping not always make Amazon delivery faster?
Amazon’s delivery promise is calculated based on where inventory is stored relative to the customer’s location, not the shipping service used. Expedited shipping cost is generally higher than standard shipping due to the need for faster delivery and priority handling. If inventory is 2,000+ miles from the customer, upgrading from 5-day ground to 2-day expedited only compresses transit by 3 days, but the delivery promise may still be 4-6 days due to distance. Additionally, if handling time is set to 2 days, the seller loses 2 days before the package even ships, diluting the benefit of faster transit. When inventory is nearby (within 100-150 miles), ground already delivers in 1-2 days, making expedited shipping unnecessary.
How do FBA sellers control expedited shipping costs on Amazon?
FBA sellers do not pay per-shipment carrier costs because Amazon selects shipping services automatically and absorbs the cost difference. FBA sellers pay fixed fulfillment fees based on size and weight regardless of carrier service used. The only way FBA sellers influence delivery speed and indirectly control shipping costs is by using Amazon’s Inbound Placement Service to distribute inventory across multiple fulfillment centers closer to customers. When inventory is positioned regionally, Amazon uses cheaper ground shipping to meet delivery promises instead of upgrading to expensive expedited services.
Additionally, outsourcing order fulfillment to a third-party logistics provider (3PL) for small businesses can help FBA sellers leverage better shipping options and discounts, further optimizing logistics and shipping strategies for expedited services.
What is the difference between handling time and shipping time on Amazon?
Handling time is the number of business days between when a customer places an order and when the seller ships the package to the carrier. Shipping time (transit time) is how long the carrier takes to deliver the package after pickup. Amazon’s delivery promise includes both. Different shipping methods, such as standard, expedited, and express, impact the overall delivery time by offering varying speeds and costs.
For seller-fulfilled orders, if handling time is set to 2 days and ground shipping takes 5 days, the total delivery promise is 7 days. Reducing handling time to 0 or 1 day has a larger impact on delivery speed than upgrading shipping service, and it costs nothing.
When does expedited shipping actually improve Amazon delivery times?
Expedited shipping improves delivery times only when: (1) Inventory is located far from the customer (forcing long transit) and standard ground would miss the delivery promise; (2) Handling time is already optimized to 0-1 days so transit time is the remaining variable; (3) The order is placed well before the daily cutoff time so the package ships the same day; (4) The destination is not rural or remote where expedited service level commitments don’t apply. In these scenarios, upgrading from 5-day ground to 2-day expedited can compress the delivery promise by 2-3 days, but at 3-4x the shipping cost.
How can seller-fulfilled Amazon merchants reduce delivery times without paying for expedited shipping?
Seller-fulfilled merchants can reduce delivery times by: (1) Reducing handling time to 0 or 1 business day through same-day order processing and daily carrier pickups; (2) Using regional fulfillment centers or 3PLs to position inventory closer to customers (West Coast and East Coast facilities cover most U.S. customers within 1-3 days ground); (3) Multi-carrier rate shopping to identify which carrier delivers fastest to each zone at the lowest cost; (4) Ensuring orders placed before cutoff time ship the same day.
Sellers can also ship expedited orders by partnering with multiple carriers such as FedEx, UPS, and USPS, and by optimizing order fulfillment processes to offer same-day, two-day, or next-day shipping options that meet customer expectations and stay competitive while still complying with Amazon Seller Fulfilled Prime (SFP) guidelines.
These operational changes deliver 1-3 day ground shipping nationwide at $8-12 per package versus $30-45 for expedited services.
Does Amazon Prime require expedited shipping for sellers?
Amazon Prime does not require sellers to use expedited carrier services. Prime’s two-day delivery promise is achieved through inventory placement in fulfillment centers near customers and same-day order processing, not through expedited shipping.
Prime does not require priority delivery or express shipping; instead, it relies on operational efficiency and strategic inventory placement to meet delivery promises, and programs like the updated Seller Fulfilled Prime requirements make these operational standards explicit for merchants.
FBA sellers automatically qualify for Prime because Amazon positions their inventory across the fulfillment network and uses ground shipping for most deliveries. Seller-fulfilled Prime (SFP) requires sellers to meet delivery promises through their own operations (0-day handling, regional inventory, ground shipping), not by paying for expedited services. Prime delivery speed is an operational outcome, not a carrier service requirement.
What shipping services count as expedited on Amazon for seller-fulfilled orders?
For seller-fulfilled orders, expedited shipping typically includes: USPS Priority Mail (2-3 days), USPS Priority Mail Express (1-2 days overnight), FedEx Two Day, FedEx Express Saver (3 days), UPS Second Day Air, and UPS Next Day Air. Standard shipping includes USPS Ground Advantage, UPS Ground, and FedEx Ground (3-7 days depending on distance). Expedited shipping can also include package tracking, allowing products customers to monitor their shipment’s progress. The key distinction is transit time: expedited services deliver in 1-3 days regardless of distance, while standard ground varies by zone. However, Amazon’s delivery promise is based on total time (handling plus transit), so expedited transit only helps if handling time is already minimized.
Written By:
Rinaldi Juwono
Rinaldi Juwono leads content and SEO strategy at Cahoot, crafting data-driven insights that help ecommerce brands navigate logistics challenges. He works closely with the product, sales, and operations teams to translate Cahoot’s innovations into actionable strategies merchants can use to grow smarter and leaner.
Turn Returns Into New Revenue
Related Articles
What Is Demand Planning? How It Impacts Inventory, Forecasting, and Profitability
Demand planning is the process of estimating future customer demand so that a business can align its inventory, procurement, and operations to meet that demand without carrying mor...
Walmart Officially Allows Amazon Multi-Channel Fulfillment (MCF)
Big news for multichannel sellers: Walmart now officially allows Amazon Multi-Channel Fulfillment (MCF), Amazon’s service for using its fulfillment network to ship orders from mult...

Why Small Ecommerce Brands Are Winning with AI (While Enterprises Struggle)
Conventional wisdom says large companies should dominate AI adoption.