Why Returns Need to Go Forward, Not Back
In this article
 21 minutes
- Returns Did Not Break Because Retailers Failed
- What the Industry Got Wrong About Consumer Expectations
- Why This Moment Is Different
- The Turning Point in the Returns Process Is Routing Logic
- What Peer-to-Peer Returns Process Actually Changes
- What Peer-to-Peer Actually Represents
- The Strategic Choice Ahead for Customer Loyalty
- Closing
- Frequently Asked Questions
The future of ecommerce returns will not be decided by better software or bigger warehouses. It will be decided by whether the industry is willing to question the assumption that has governed reverse logistics since the beginning: that returned goods must travel backward through the supply chain before they can move forward again.
With the rapid rise of online shopping, return rates have surged, creating new challenges for ecommerce retailers. According to the National Retail Federation, nearly 30% of all online purchases are returned, compared to just 8.9% in physical stores, and in 2023, total returns for the retail industry amounted to $743 billion in merchandise. These numbers align with broader benchmarks on the average ecommerce return rate and reflect the structural forces behind the rise of e-commerce return rates.
That assumption made sense once. It no longer does. And the evidence is not subtle.
Returns Did Not Break Because Retailers Failed
This is the part most industry conversations skip.
There is a comfortable narrative in retail operations that returns became a problem because brands got too generous, or moved too fast, or failed to anticipate scale. That framing is wrong, and it matters that it is wrong, because misdiagnosing the cause leads to misaligned solutions.
Returns did not break because retailers executed poorly. They broke because the system they were built on no longer fits reality. Returns cost merchants significant amounts—reports estimate that returns cost merchants $100 for an ecommerce order, with much of the stock thrown away, donated, or sold off to liquidators, highlighting how ecommerce return rates affect profit margins.
The original return model was designed for a specific set of conditions. Returns were built for low volume, human-paced decision-making, cheap labor, invisible waste, and centralized infrastructure. Every assumption embedded in warehouse-centric reverse logistics depended on those conditions holding.
Modern commerce operates under none of them.
SKU counts exploded. Consumer expectations hardened around instant refunds and frictionless experiences. Ecommerce penetration normalized, then plateaued, while return rates stayed elevated. Fraud scaled alongside volume. Labor costs rose. Sustainability became a reporting requirement, not a PR gesture. And the economics of routing every return through a centralized distribution center quietly became untenable at scale, especially as returns fraud and refund fraud amplified the financial impact. The eCommerce returns market is projected to reach $644 billion by 2026, driven by the increasing number of online shoppers and rising customer expectations regarding returns, making it critical for merchants to develop a clear returns strategy to optimize returns and control costs.
Understanding why returns were never designed for ecommerce scale is the first step toward understanding why surface-level fixes keep falling short. The returns process was an episodic function retrofitted onto an industrial reality it was never meant to absorb.
Make Returns Profitable, Yes!
Cut shipping and processing costs by 70% with our patented peer-to-peer returns solution. 4x faster than traditional returns.
See How It WorksWhat the Industry Got Wrong About Consumer Expectations
The industry recognized the problem. The response, however, was structural preservation dressed up as innovation.
Over the past decade, retailers and vendors pursued five primary strategies. They added software layers. They expanded warehouses. They consolidated carriers. They tightened policies. And they shifted risk to customers.
Each of these bought time. None changed the direction of the system.
Returns Management Systems improved the customer experience at the front end. Self-serve portals, branded return flows, policy automation, and analytics dashboards all represent genuine progress on UX. But they route returned items back to the same warehouses, through the same labor queues, with the same markdown exposure waiting at the end. A better on-ramp to a broken road is still a broken road.
Scale was supposed to help. The logic was intuitive: more volume should produce lower unit costs, more warehouse efficiency, better resale outcomes. The warehouse-centric return loop does not behave that way. Returns suffer from diseconomies of scale. Higher volume increases inbound congestion, makes labor harder to staff and manage, amplifies fraud exposure, and slows the inventory velocity that determines recovery value. By the time total U.S. retail returns reached $890 billion in 2024, the highest level on record, scale had proven it was not the solution. It was an accelerant.
Carrier consolidation followed the same pattern. UPS acquiring Happy Returns and its drop-off return network was the clearest signal that the industry was betting on convenience and physical reach rather than structural redesign. Drop-off networks improved the customer experience at the front of the returns process. Items still funneled back into centralized facilities. The cost structure remained.
Policy tightening, charging return fees, shortening windows, restricting eligible categories, transferred some pain from retailer to consumer. That is a real lever, and its normalization by brands like Zara and H&M demonstrated that consumers will adapt when the entire market moves together, even as free returns increasingly come to an end. However, clear and flexible return policies are crucial for building customer trust and avoiding negative reviews, as poor return experiences can quickly erode confidence and damage reputation. In fact, more than half of online shoppers have decided against making a purchase due to a company’s poor return policy, highlighting the importance of flexible and reasonable return policies in building customer loyalty. But tighter policies reduce return volume at the margins. They do not change the economics of the returns that still happen.
The result, across all of these approaches, is the same: a system that has been optimized repeatedly without being changed fundamentally.
Why This Moment Is Different
The forces now converging on returns are not cyclical. They are structural, and they are arriving simultaneously.
Platforms are making returns visible and punitive. Amazon introduced product-level visibility on frequently returned items and seller penalties tied to excessive return rates. This is not just a policy change. It is a signal that returns are becoming a reputational variable, not just an operational cost. Consumer behavior is being shaped by this visibility in ways that will compound over time.
Retailers are normalizing return fees. What began as a cautious experiment by a handful of major apparel brands has become an industry pattern. Consumers who once would have churned over a return fee now accept them as a standard part of the ecommerce returns process. That expectation reset is durable, and it signals that the social contract around free returns has been renegotiated.
Carriers are consolidating without lowering cost. FedEx launched Easy Returns in 2025, joining UPS in the race to own return entry points. The pattern is clear: carriers are competing for first-mile control, not for structural cost reduction. More drop-off locations do not eliminate the warehouse step. They extend the foyer.
Regulators are targeting waste and emissions. France has banned the destruction of unsold goods. The EU has moved against fashion landfilling. The SEC has signaled that Scope 3 emissions disclosures, which include reverse logistics, are coming for U.S. companies. Extended Producer Responsibility frameworks are spreading. For global brands, these are not future risks. They are current compliance requirements.
Consumers are recalibrating expectations. The same shoppers accepting return fees are also paying attention to sustainability. Research consistently shows that a majority of consumers say environmental impact influences purchasing decisions. Returns that visibly generate waste are a brand risk that grows over time, not one that fades.
Boards are asking harder questions. Returns now appear in conversations about margin durability, working capital efficiency, Scope 3 liabilities, and fraud exposure. The question has shifted from “how do we manage return costs?” to “why are return costs rising faster than revenue, and which portion of this is actually controllable?”
Returns have a significant impact on profitability for online retailers, with retailers typically losing 10% to 20% of the merchandise value on returns. This loss complicates pricing and discount strategies and puts additional pressure on operational efficiency, raising hard questions about the true cost and sustainability of free returns. To address these challenges, online retailers must invest in the right technology—such as ERP, OMS, and inventory management systems—to streamline returns processes and control costs. AI-driven automation is also shaping the future of ecommerce returns by reducing high logistics costs and helping meet rising customer expectations for seamless, sustainable experiences.
Taken together, these forces tell a clear story. The old model is not just inefficient. It is unstable. Instability of this kind does not resolve through incremental adjustment. It resolves through structural change.
Convert Returns Into New Sales and Profits
Our peer-to-peer returns system instantly resells returned items—no warehouse processing, and get paid before you refund.
I'm Interested in Peer-to-Peer ReturnsThe Turning Point in the Returns Process Is Routing Logic
Every solution covered above, from returns software to carrier drop-off networks to policy tightening, attempts to reduce pain without changing the core assumption. The assumption is that returned items must travel backward through the supply chain before they can re-enter the market.
That assumption is the problem.
The turning point is not better tooling, stricter rules, or additional warehouse capacity. The turning point is changing routing logic itself.
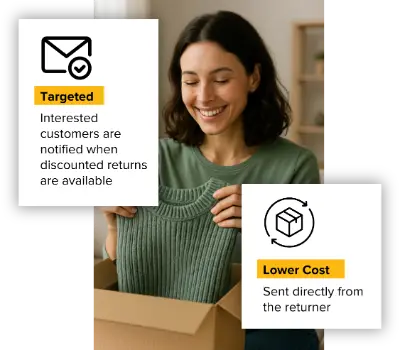
Peer-to-peer returns challenge the most fundamental constraint in reverse logistics by inverting the direction of flow. Instead of routing returned goods back to a warehouse for intake, inspection, repackaging, and eventual resale, P2P forwards eligible items directly from the returning customer to the next buyer. The return stops moving backward. It becomes a forward-moving transaction.
Automation streamlines handling return requests and issuing return labels, allowing customers to quickly download labels and ship items directly to the next buyer. This not only improves efficiency and customer satisfaction but also helps get items back on virtual shelves faster. Machine learning can optimize where returned goods are sent, minimizing transportation costs and improving inventory levels by ensuring returned products are routed to the most appropriate locations. These technologies help optimize returns by making the process more effective, efficient, and profitable.
The mechanical shift is straightforward. A buyer initiates a return through a standard branded portal. The system evaluates eligibility based on SKU type, condition thresholds, return reason, and demand signals. If the item qualifies, a “Like New” listing is generated on the same product page as the new item, priced at a modest discount. The returner receives a label addressed to the next buyer, not to a warehouse. Tracking confirms delivery. Refund is issued. Inventory, financials, and order records update automatically.
What changes is where the item goes. Everything else, the branded portal, the policy logic, the carrier infrastructure, the customer communication, stays the same.
What Peer-to-Peer Returns Process Actually Changes
When routing changes, the consequences are not incremental. They are categorical.
Entire cost layers disappear. There is no inbound dock. No receiving labor. No inspection queues. No re-shelving. No redundant inbound shipment. In a traditional returns flow, every returned item accumulates cost at each stage of the reverse journey. In fact, returns can drain up to two-thirds of an item’s original value, affecting not only shipping and restocking but also causing inventory disruptions and customer dissatisfaction. In a P2P flow, those stages do not exist for eligible items. The cost is not reduced. It is removed.
Inventory velocity improves. In traditional flows, items wait days or weeks while they move through intake and inspection before becoming available for resale. During that time, seasonal demand decays and markdown pressure builds. In P2P, items move immediately to the next buyer. Value is captured once, intentionally, not eroded over time through repeated discounts. Improved inventory levels and product quality, supported by better product descriptions and enhanced product listings, can reduce returns and enhance customer satisfaction. Providing customers with detailed product information and gathering feedback helps improve product quality and reduce returns. AI can also analyze customer data to improve product descriptions and sizing charts, reducing misfit rates and further minimizing returns.
Fraud opportunities shrink. Traditional returns create fraud exposure at every handoff. Wardrobing, item swapping, and empty box scams all exploit the opacity and delay built into multi-step warehouse processing. When a return travels point-to-point, with refunds tied to confirmed delivery, the attack surface collapses. There is no anonymous warehouse queue where conditions cannot be verified. Fewer handoffs mean fewer cracks to exploit.
Waste declines. A traditional return travels twice before reaching the next buyer: outbound to the original customer, back to the warehouse, and often a third time to a resale or liquidation channel. P2P removes one full shipping leg and the associated packaging. Across millions of returns, the reduction in emissions and material waste is substantial and aligns with broader strategies for supporting eco-friendly ecommerce returns.
Sustainability becomes measurable, not rhetorical. Scope 3 emissions reporting, which increasingly includes reverse logistics, becomes a tractable problem when shipping legs are eliminated by design rather than optimized at the margins. ESG disclosures gain specificity. Regulatory narratives gain credibility. Consumer-facing sustainability claims become verifiable.
This is not optimization. It is structural realignment. The distinction matters because optimization preserves the underlying system while extracting incremental efficiency. Structural realignment changes what the system does by default.
No More Return Waste
Help the planet and your profits—our award-winning returns tech reduces landfill waste and recycles value. Real savings, No greenwashing!
Learn About Sustainable ReturnsWhat Peer-to-Peer Actually Represents
There is a risk of misframing peer-to-peer returns as a product feature or a policy configuration. That framing is both inaccurate and strategically unhelpful.
Peer-to-peer is not a feature. It is not a tool. It is not a policy tweak.
It represents a different way of thinking about what returns are and where they belong in the commerce cycle. In the traditional model, returns are a reversal, a transaction going backward, generating cost and consuming time before value can be recovered. In the P2P model, returns are forward-moving transactions, recoverable value flows, and shared accountability events between the returning customer, the next buyer, and the brand.
Returns become strategic infrastructure rather than operational cleanup. Optimizing returns in this way and crafting the perfect ecommerce returns program can drive long term profitability and provide a competitive advantage by reducing operational costs and enhancing customer satisfaction. Offering store credit as a resolution option can help retain customer loyalty and appeal to future customers, especially when used to address return fraud or clarify policies. Additionally, a clear and comprehensive returns policy that transparently explains fees and offers multiple options can reduce lost sales by setting realistic expectations and improving the overall customer experience.
That distinction has practical implications. It means the question facing logistics and operations teams is not “how do we process returns faster?” It is “how do we change where eligible returns go so that processing becomes unnecessary?” The question facing finance leaders is not “how do we reduce cost per return by a few dollars?” It is “how do we eliminate entire cost categories for the majority of our returns volume?” The question facing board members is not “what are our return metrics this quarter?” It is “do our returns flow in a direction aligned with how modern commerce actually works?”
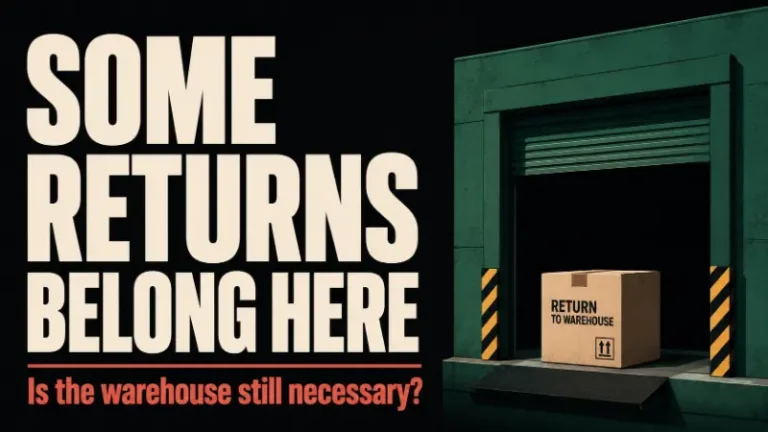
There is also an important constraint embedded in this framing. P2P returns coexist with warehouses. They respect constraints. They do not pretend to solve everything.
Fragile goods that require professional repackaging still route through traditional flows. Regulated categories with chain-of-custody requirements remain warehouse-dependent. Defective items still need verification and root-cause analysis. End-of-season merchandise without downstream demand is a liquidation case, not a P2P case.
In practice, roughly 60% of returns across most ecommerce operations are viable P2P candidates. The remaining 40% continue through existing reverse logistics channels. Warehouses do not disappear. They become specialized exception handlers rather than default endpoints. That is a meaningful shift in what warehouses are for, not an elimination of what they do.
The credibility of P2P as a model rests precisely on this restraint. A system that acknowledges its boundaries is one that can be implemented with discipline.
The Strategic Choice Ahead for Customer Loyalty
Every retailer now faces a decision, whether made explicitly or by default through inaction.
Option one is to continue absorbing return losses and hope that incremental fixes keep pace with escalating costs, fraud, regulation, and competitive pressure. This means continued investment in returns software that improves UX without changing economics, warehouse capacity that scales costs alongside volume, carrier relationships that optimize convenience without eliminating structural waste, and policy adjustments that transfer pain without resolving it. Protecting margin in this scenario requires careful management of shipping costs and return shipping, as these expenses can significantly erode profits—especially considering that the cost of processing an online return averages 21% of an order’s value.
Option two is to redesign returns as a system that reflects how commerce actually works today. That means auditing return flows against fully loaded cost structures, identifying the subset of SKUs and categories where P2P economics deliver the clearest advantage, piloting with controlled scope to generate evidence rather than assumptions, and building the guardrails, condition standards, and fraud controls that make the model trustworthy at scale. Improving efficiency through technology investments and leveraging data analytics to understand customer behavior are critical to optimizing returns and reducing unnecessary costs.
Doing nothing is not neutral. Doing nothing is a decision to let costs, fraud, and waste compound.
Return losses do not stay constant while the organization evaluates alternatives. Every year of delay locks in avoidable cost, increases regulatory exposure, normalizes inefficient behavior, and weakens competitive position relative to operators who have already begun the transition. Structural problems do not self-correct. They intensify.
The companies that act early will define the standard. Those that wait will inherit it on worse terms.
For CFO-level evaluation of what this transition means for gross margin and capital efficiency, the core question is not whether returns are expensive. That has been established. The question is whether the organization is structurally equipped to reduce that expense by eliminating cost categories rather than managing them. For board-level framing, the question is whether returns are treated as a strategic capability or as a tolerated liability. Those two framings produce very different investment decisions.
Traditional Returns Are Ending
Ecommerce built a returns system for a smaller internet. Today it’s collapsing under scale. Warehouses can’t absorb the volume, costs keep rising, and retailers are quietly tightening policies. This article explains why the old model is failing and what replaces it.
Read the Returns BibleClosing
Returns have been treated as a back-office problem for long enough that the assumption calcified. They are not a back-office problem. They are a test of whether ecommerce infrastructure can evolve without breaking under its own weight.
The scale is no longer deniable. The economics are no longer manageable through incremental improvement. The regulatory environment is no longer optional. The consumer expectations are no longer stable. The fraud exposure is no longer containable through reactive detection.
Peer-to-peer returns do not promise perfection. They offer something more valuable: a credible path out of a system that no longer works. One that changes direction rather than adding complexity. One that reduces cost by eliminating stages rather than optimizing them. One that turns returns from a structural liability into a structural advantage for the operators willing to rethink the routing.
A hassle-free returns process creates a positive experience, keeps customers happy, and encourages future purchases. According to a survey, 96% of shoppers are more likely to purchase again if returns are hassle-free, showing that a smooth return process can encourage customer loyalty with an exceptional returns program.
Returns don’t need to go back. They need to go forward.
Frequently Asked Questions
What does it mean to say the future of ecommerce returns requires structural change rather than optimization?
Optimization improves how the existing system performs. Structural change alters what the system does by default. The current warehouse-centric returns model can be optimized through better software, more efficient labor, and improved analytics, but the core cost drivers: two shipping legs, intake labor, inspection, repackaging, and markdown delay, remain in place regardless of how well the front end is managed. Structural change means changing routing logic so that a significant portion of returns never enter that loop at all. This includes offering flexible options such as online returns, mail-in returns, and in-store returns, where customers can return items in store regardless of their initial purchase channel (for example, buy online, return in store), enhancing convenience and reducing costs.
Why have returns management software platforms not solved the cost problem?
Returns Management Systems have meaningfully improved the customer experience and process visibility on the front end of the returns process. What they have not changed is where returned items go. In almost every case, RMS platforms still route eligible returns back to a warehouse, a 3PL, or a centralized inspection facility. The expensive steps: inbound freight, receiving labor, repackaging, restocking, and markdown exposure, remain intact. Better tooling accelerates volume into the same reverse flow. It does not remove the flow. However, many platforms now offer self-service portals for online returns, allowing customers to initiate returns, download shipping labels for mail-in returns, and track status—reducing customer service inquiries by up to 50%.
How does peer-to-peer returns work mechanically?
A buyer initiates a return through a standard branded portal. The system evaluates the item’s eligibility based on SKU type, condition, return reason, and demand signals. If eligible, a “Like New” listing is generated at a modest discount. The returning customer receives a shipping label addressed to the next buyer rather than to a warehouse. Tracking confirms delivery to the new buyer, the returner is refunded, and all inventory and financial records update automatically. The warehouse intake step is eliminated for that transaction.
Which product categories are well suited to peer-to-peer returns?
Apparel, footwear, and accessories are high-fit candidates because they carry stable resale value, tolerate consumer packaging, and generate high return rates with predictable demand. Durable home goods and non-fragile consumer items are medium-fit. Fragile goods, regulated categories such as cosmetics or medical devices, defective or damaged items, and end-of-season merchandise with limited remaining demand are not well suited. P2P is a hybrid strategy. The goal is not to route 100% of returns peer-to-peer but to identify the majority of recoverable volume where the model delivers clear advantage.
What happens to the 40% of returns that do not qualify for peer-to-peer?
They continue through existing reverse logistics channels. Warehouses do not disappear under a P2P model. They become specialized exception handlers for defective, damaged, regulated, or otherwise non-recoverable items rather than the default endpoint for all returns. The operational shift is in what warehouses are responsible for, not whether they exist.
Why is fraud exposure lower in a peer-to-peer returns model?
Traditional returns create fraud opportunities at every handoff. Wardrobing, item swapping, and empty box scams all depend on the opacity and delay built into multi-step warehouse processing. In a point-to-point flow where refunds are tied to confirmed delivery and items never pass through anonymous warehouse queues, the attack surface shrinks materially. Fewer touchpoints mean fewer opportunities to exploit gaps in condition verification.
Is the normalization of return fees by major retailers a sign that the old model is breaking?
Yes. Zara, H&M, Anthropologie, J.Crew, and others introducing paid return fees is not primarily a revenue strategy. It is a signal that the economics of free returns have become unsustainable across the industry. Consumer backlash was widely predicted and largely did not materialize, which indicates that the expectation reset is durable. The entire market moving together on fees shows that tolerance for absorbing full return costs has reached its limit, even if the structural problem underneath those costs has not yet been addressed. For low-value items, retailers are increasingly offering returnless refunds, allowing customers to keep or donate the item. At the same time, shoppers may face increased friction for returns, such as fees or mandatory use of specific drop-off locations.
How is technology being used to improve the returns process?
Retailers are leveraging self-service portals for online returns, enabling customers to initiate returns, print shipping labels for mail-in returns, and track their return status—reducing customer service inquiries by 50%. Augmented Reality (AR) tools are being used to help customers visualize products before purchasing, which has led to a 20% to 40% decrease in return rates for brands using AR. High quality images, especially in Amazon A+ Content, also help customers better understand products, reducing incorrect sizing issues and overall return rates. AI is increasingly used to create dynamic, personalized return experiences, automate return eligibility, provide instant refunds, and suggest personalized exchanges. AI also scans for return fraud, such as item swapping or serial returners, by assigning risk scores to transactions, and analyzes customer data to improve product descriptions and sizing charts, further reducing misfit rates and returns due to incorrect sizing.
Written By:

Manish Chowdhary
Manish Chowdhary is the founder and CEO of Cahoot, the most comprehensive post-purchase suite for ecommerce brands. A serial entrepreneur and industry thought leader, Manish has decades of experience building technologies that simplify ecommerce logistics—from order fulfillment to returns. His insights help brands stay ahead of market shifts and operational challenges.
Turn Returns Into New Revenue
Related Articles

How to Introduce P2P Returns Without Breaking CX
Introducing peer-to-peer returns without breaking customer experience is mostly a change-management and trust-design problem, not a technology problem.

Why P2P Requires a Different Mental Model
Introduction Most people misunderstand peer-to-peer returns for the same reason: they evaluate the system through warehouse-first assumptions.
When Warehouse Returns Still Make Sense
A serious returns strategy does not pretend one path fits every return.
Amazon Discover Unmet Demand: What Sellers Should Know

In this article
17 minutes
Amazon has added a Discover Unmet Demand view inside the Amazon Product Opportunity Explorer that surfaces search clusters where shoppers are clicking but converting below the expected benchmark for that category and price range. This view helps sellers analyze what Amazon customers are searching for and clicking on, uncovering product opportunities by highlighting areas where shoppers are searching but not finding what they want. The premise is straightforward: if people are searching, clicking, and not buying, something they want is not available or not well represented. Find those gaps and fill them.
That premise is not wrong. But it is incomplete in ways that matter economically. Low conversion is a signal, not a diagnosis. The difference between a signal that points toward a real market gap and one that points toward weak intent, broad browsing, or demand that cannot be profitably served is precisely the judgment that the tool does not provide. For example, shoppers may be clicking on certain clicked products but not purchasing them, indicating unmet demand or issues with the current offerings. That judgment is now the real differentiator, not access to the dashboard.
What the Feature Actually Shows
Product Opportunity Explorer has existed for several years as a way for sellers to explore search term clusters, review counts, sales velocity, and conversion patterns within Amazon’s category structure. The Discover Unmet Demand view is a filtered lens on top of that data, surfacing clusters where the click-to-purchase ratio falls below what Amazon’s systems expect given the category and price point. The tool categorizes products into niches, which are defined as collections of search terms and products that represent specific customer needs, and niche metrics are updated weekly. Sellers can analyze multiple niches to compare demand and competition across different product categories.
The intent is to highlight places where demand is being expressed but not fulfilled to an adequate standard, helping reveal what customers are looking for but not finding. Sellers can use the tool to identify unmet customer demand by analyzing niche metrics, example niches, and detailed information about product categories, which complements broader Amazon market and product research strategies focused on understanding demand, competition, and profitability. The tool helps sellers identify opportunities by revealing where customers are looking for products that are not being met. In theory, a seller looking at these clusters is seeing a prioritized list of where shoppers searched, found something close to what they wanted, clicked on it, and did not buy. The interpretation Amazon is implicitly offering is: this is where you might win.
That interpretation requires much more scrutiny than the dashboard provides, but the tool does provide valuable insights into customer search behavior and market gaps.
Make Returns Profitable, Yes!
Cut shipping and processing costs by 70% with our patented peer-to-peer returns solution. 4x faster than traditional returns.
See How It WorksWhy Low Conversion Is Easy to Misread
Conversion below benchmark is a compound outcome. It reflects the interaction between what shoppers were actually looking for, what listings were available, what prices were presented, and whether purchase intent existed in the first place. Analyzing what customers are searching for and the individual search terms they use can help sellers understand whether low conversion is due to unmet demand or simply weak intent. Each of those factors tells a different story about whether a gap is real and commercially actionable, and it’s crucial to look for clear signals that indicate genuine market gaps rather than weak or misleading intent.
Broad queries with weak intent produce low conversion structurally and do not indicate a product opportunity. A search term like “gifts for him under $50” generates enormous click volume across dozens of categories. Shoppers are browsing, not buying. They have not decided what they want. They may not buy anything on this session. Low conversion on a query like this is not evidence that no product meets the need. It is evidence that the need is not well-formed enough to close a transaction.
A seller who sees a high-volume, low-conversion cluster built around gift-oriented or exploratory searches and interprets it as an unmet demand opportunity is solving the wrong problem. No product, regardless of how well positioned, will convert exploratory browsing into a purchase reliably. The intent is simply not there to close.
Category-level browsing masquerading as product-level intent appears frequently in the data. A shopper searching “kitchen storage” is not necessarily looking for a specific product they cannot find. They may be early in a longer purchase journey, comparing options, or satisfying curiosity. The low conversion that results does not mean the category is underserved. It may mean the query is functioning as navigation rather than purchase intent. However, when high search volume is paired with poor conversion on specific individual search terms, it can indicate prospective niches where the products customers want are not being met. In these cases, knowing how many reviews a product has is essential for evaluating both the level of competition and the depth of customer feedback, helping sellers assess whether the demand is truly unmet or simply underserved.
Demand that exists but cannot be profitably served is a distinct failure mode that the tool cannot identify. Imagine a cluster of search terms indicating that shoppers want a specific combination of features at a specific price point. The conversion is low because current listings do not match the combination. A seller might read this as a product development opportunity. But the reason no listing matches the combination may be that it is economically impossible to produce at the price point shoppers expect. The demand is real. The gap is real. The commercial opportunity is not. Analyzing customer reviews, especially 1-star to 3-star reviews, can reveal pain points and unmet needs, helping sellers understand if the gap is due to unserviceable demand or fixable product shortcomings. At the same time, a high number of positive reviews can indicate strong product quality and a competitive market, which may raise the barrier for new entrants. Negative review mining can also reveal recurring phrases that indicate unmet consumer needs across multiple brands, signaling broader market demands.
This is the most consequential version of the misread. A seller who invests in sourcing, development, or inventory based on a signal that reflects economically unserviceable demand has made a capital allocation mistake that the data itself did not warn them about. Even when using lower-cost bulk storage options like Amazon AWD bulk storage and auto-replenishment, misunderstanding true demand can lock capital into inventory that will never turn profitably.
The Overcrowding That Follows Better Tools
Here is a dynamic that every Amazon seller using Amazon’s own demand signals should think carefully about. Leveraging up-to-date data and data-driven insights is crucial for Amazon sellers to stay ahead of the competition when using the Discover Unmet Demand feature. In fact, in 2024, 89% of Amazon sellers used AI-driven tools for advanced product research and optimization, up from 62% in 2023, highlighting the growing importance of data analysis for identifying market gaps. These AI-driven tools help sellers accelerate product research, enabling them to quickly identify high-potential products, source efficiently, and stay ahead of market competition, especially when paired with ongoing educational webinars on Amazon and ecommerce strategy.
When Amazon surfaces a Discover Unmet Demand view inside a widely used seller tool, the set of sellers reviewing those clusters is not small. Product Opportunity Explorer has been promoted through Seller Central, through Amazon’s seller education webinars, and across the seller community for years. Sophisticated Amazon sellers have been using it. Agencies have been using it. The Discover Unmet Demand overlay makes the lowest-conversion clusters more findable and easier to act on, which means more sellers will act on the same signal simultaneously. Sellers closely monitor growth and growth trends—such as increases in search volume, sales, and niche demand—to identify emerging opportunities before they become crowded.
A search cluster that appears to represent a gap today may be crowded with new product launches within two to three quarters of the feature gaining adoption. The apparent whitespace fills in. Conversion remains low because the category is now competitive rather than under-supplied. The sellers who launched into it are now in a commodity battle, not a gap market.
This is the contrarian read on better marketplace tools: they democratize intelligence in ways that reduce the durable advantage of that intelligence. When everyone sees the same signal, the signal leads to the same response, which produces crowding rather than differentiation. Monitoring growth trends can help sellers anticipate when a niche is about to become saturated, particularly around events like Prime Day where Prime Day order preparation and fulfillment choices can determine whether increased demand translates into profit or erodes margin. The sellers who benefit are those who move fastest, execute most cleanly, or bring something to the market that cannot be instantly replicated by the next seller who reads the same dashboard. Many successful Amazon sellers believe that understanding unserved niches offers a faster route to profitability, as fewer listings target these demands and increase search visibility.
Convert Returns Into New Sales and Profits
Our peer-to-peer returns system instantly resells returned items—no warehouse processing, and get paid before you refund.
I'm Interested in Peer-to-Peer ReturnsWhat Operational Follow-Through Actually Requires
Assuming a seller identifies a cluster that reflects genuine unmet demand with real commercial intent and a serviceable price point, these steps are critical for building a successful business on Amazon. The tool’s work is done at that point. Everything that creates actual competitive advantage happens in what follows.
Sourcing and product development require lead time, supplier relationships, and capital commitment. A seller who identifies an opportunity in January and can source, develop, and list a product by March has a window before the cluster becomes crowded. A seller who identifies the same opportunity but needs nine months of sourcing time is entering a different competitive environment.
Inventory positioning determines whether a launched product can meet the demand it captures. Utilizing historical sales volume helps sellers understand seasonality and informs inventory management strategies, ensuring stock levels align with expected demand fluctuations. Choosing the right products to sell based on data-driven insights is essential for maximizing inventory efficiency and sales performance. A product that starts to convert well and runs out of stock within weeks of launch loses its momentum at the worst possible moment. Amazon’s ranking algorithms favor consistent availability. A new listing that goes out of stock loses the rank gains it earned and has to rebuild from a lower position. For more on how inventory positioning affects fulfillment economics, the patterns around Amazon’s holiday peak order fulfillment fee increases are relevant context for how rising shipping and handling costs interact with margin on new product launches.
Pricing and positioning at launch require a view of the existing competition in the cluster, not just the gap that the tool surfaced. Tracking sales history, units sold, and sales rank—such as those shown on Amazon’s Best Sellers, Movers & Shakers, and New Releases lists—enables sellers to forecast the potential success of new products and understand current market trends. Evaluating how many products are already in the niche helps assess competition and market saturation, informing pricing and positioning strategies. For some sellers, programs like Amazon Seller Fulfilled Prime (SFP) also change the pricing and positioning equation by trading FBA fees for direct control over fast shipping performance. A seller entering a cluster because conversion is low needs to understand whether the current listings are low-converting because they are priced wrong, because they have poor imagery, because they have no reviews, or because the product is genuinely inadequate. The answer determines whether a well-executed listing at the right price can win, or whether the cluster is structurally difficult regardless of listing quality. Predictive analytics using historical sales data and machine learning can also help forecast emerging trends before they saturate the market, giving sellers a competitive edge.
Merchandising and bundling can create differentiation where product parity otherwise exists. A cluster where individual items convert poorly may convert better for a thoughtfully designed bundle that solves a use case more completely than any single product in the category. Protecting those differentiated bundles from search suppression, listing hijackers, and stockouts requires proactive Amazon listing protection and stockout prevention practices that go beyond the initial product idea. That bundling decision requires judgment about the shopper’s underlying need, which is not visible in the conversion data alone.
Identifying opportunities through effective product research and operational follow-through is ultimately about discovering profitable niches and high potential products to sell. This approach enables sellers to strategically grow their business by targeting segments with strong demand and growth prospects.
Better Dashboards Do Not Create Better Decisions
The Discover Unmet Demand view is a more targeted version of the same type of signal that product research tools have been surfacing for years. Search volume, click patterns, conversion rates, and competitive density are not new data points. What changes is the accessibility of those signals directly inside Seller Central, without needing a third-party tool or a custom data pull. Leveraging resources such as Amazon’s analytics tools, webinars, seller communities, and advanced platforms with customizable filters allows sellers to gain visibility into customer frustration and prevailing search trends, making it easier to identify unmet demand and generate new product ideas from data-driven insights.
Accessibility is valuable. However, a truly data-driven approach is essential for effective product research and decision-making. The distance between having a signal and making a good decision based on it has not shrunk. That distance is filled by category expertise, customer understanding, supplier relationships, capital allocation discipline, and execution speed. None of those things are delivered by a dashboard, and many sellers ultimately need a scalable order fulfillment network for Amazon and multichannel sales to translate good product decisions into reliable delivery performance.
The pattern that plays out repeatedly when platforms give sellers more data is that the data creates the illusion of reduced uncertainty. A seller who sees a low-conversion cluster and interprets it as a validated opportunity has not done less work than before the tool existed. They have done less obvious work, which is not the same thing. The evaluation steps that convert raw demand data into a confident sourcing decision should include analyzing product listings—especially bullet points, images, and specifications—to identify gaps and improve differentiation.
This is the operational judgment problem that surfaces in agentic commerce contexts as well. Better automated signals surface more information faster, but the quality of decisions made from that information still depends on the judgment of the operator interpreting it. Access to better tools raises the floor of what sellers can see. It does not raise the ceiling of what they can execute. Optimizing your Amazon store for visibility and growth, and ensuring your product listings use clear bullet points to quickly convey product value, are crucial steps for success.
No More Return Waste
Help the planet and your profits—our award-winning returns tech reduces landfill waste and recycles value. Real savings, No greenwashing!
Learn About Sustainable ReturnsThe Practical Filter Before Acting on This Data
For sellers who want to use Discover Unmet Demand responsibly, the filter before acting on any cluster is a series of questions the tool cannot answer.
Is the search intent in this cluster transactional or exploratory? Can you tell from the query structure and the click patterns whether shoppers have a specific product in mind or are browsing? If the intent is exploratory, pass.
Is the demand servable at the price point the search data implies? Do the products shoppers are clicking reflect a price expectation that leaves room for healthy margin after sourcing, fulfillment, advertising, and Amazon fees? Given current shipping cost and carrier surcharge pressures, this question carries more weight than it did in lower-cost fulfillment environments. Additionally, monitoring seasonal trends can help optimize inventory positioning and stock levels to better match demand fluctuations throughout the year.
Why are current listings converting poorly? Is it poor images, weak copy, missing reviews, incorrect price positioning, or a genuinely absent product type? Monitoring customer feedback and customer preferences—such as analyzing reviews and what shoppers are searching for—can help identify market gaps, new niches, and unmet demand. Monitoring customer reviews, especially negative ones, can reveal repeated suggestions for product improvements, indicating broader unserved market needs. If the answer is execution problems in current listings rather than an absent product, a better-executed listing wins without requiring a new product development cycle.
How long will it take to bring a product to market, and how many other sellers have access to the same signal? If sourcing takes six months and the cluster is prominently featured in a widely used seller tool, the competitive landscape in that cluster will be meaningfully different by the time a new product is ready to list. Consider timing your launch around upcoming events or micro-holidays that can drive demand in certain niches.
A seller who works through those questions honestly will pass on most of the clusters that Discover Unmet Demand surfaces. That is not a failure of the tool or of the seller. It is what responsible demand signal interpretation looks like. In competitive or emerging categories, using sponsored products ads can help increase visibility for new product launches and attract targeted traffic, while alternative fulfillment strategies—such as peer-to-peer fulfillment networks to overcome Amazon inventory limits or broader peer-to-peer order fulfillment models beyond FBA—can ensure that demand you do pursue can actually be served profitably.
Frequently Asked Questions
What is Amazon’s Discover Unmet Demand feature?
Discover Unmet Demand is a view inside Amazon’s Product Opportunity Explorer that highlights search clusters where shoppers are clicking on products but converting below the expected benchmark for that category and price range. Amazon positions it as a way for sellers to identify gaps in the product selection.
Does low conversion on a search cluster mean there is a real market gap?
Not necessarily. Low conversion can reflect weak purchase intent, exploratory browsing, overly broad queries, price expectations that make the demand unserviceable, or competitive issues with existing listings rather than an absent product type. Interpreting the signal requires additional analysis that the tool does not provide.
What are the most common mistakes sellers make with this data?
The most common mistakes are acting on clusters driven by exploratory rather than transactional intent, confusing poor listing execution by current sellers with a product-level gap, and underestimating how quickly other sellers respond to the same signals from the same tool, turning apparent whitespace into a crowded launch environment.
How does a seller know if an unmet demand signal is worth pursuing?
The evaluation requires checking whether purchase intent is transactional, whether the demand is servable at a margin-positive price point after all costs, why current listings are converting poorly, and how much time is required to bring a competitive product to market relative to how quickly the cluster will attract other sellers.
Does having access to better Amazon data create a competitive advantage?
Access to the data creates a potential advantage, but realizing it requires the judgment to interpret signals correctly, the supplier relationships to act quickly, and the operational discipline to execute at the right inventory level and price point. When many sellers have access to the same data, the advantage shifts toward those who interpret and execute better, not those who simply found the feature first.
How does this tool connect to broader fulfillment and operational decisions?
A product launch decision driven by demand data requires inventory commitment, sourcing lead time, and fulfillment cost modeling before it is complete. A seller who identifies a genuine demand gap but cannot bring product to market profitably given their current sourcing and shipping cost structure has not identified an opportunity. They have identified a situation that requires better operational infrastructure before it becomes one.
Written By:

Rinaldi Juwono
Rinaldi Juwono leads content and SEO strategy at Cahoot, crafting data-driven insights that help ecommerce brands navigate logistics challenges. He works closely with the product, sales, and operations teams to translate Cahoot’s innovations into actionable strategies merchants can use to grow smarter and leaner.
Turn Returns Into New Revenue
Related Articles
How to Introduce P2P Returns Without Breaking CX
Introducing peer-to-peer returns without breaking customer experience is mostly a change-management and trust-design problem, not a technology problem.
Why P2P Requires a Different Mental Model
Introduction Most people misunderstand peer-to-peer returns for the same reason: they evaluate the system through warehouse-first assumptions.
When Warehouse Returns Still Make Sense
A serious returns strategy does not pretend one path fits every return.
Why Shopify’s Subscription Payment Change Could Hurt Reactivation
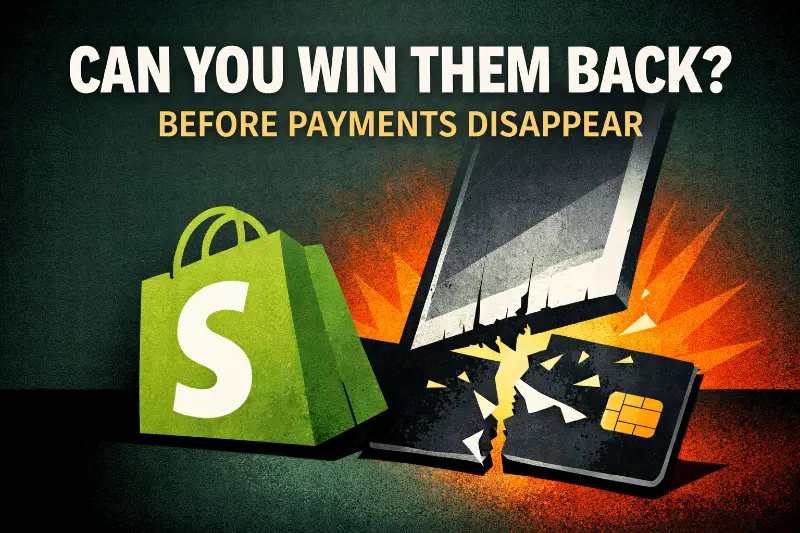
Shopify changed how subscription payment information is handled at cancellation. When a customer cancels a subscription, their payment details, including credit card information, are now deleted after 24 hours. Shopify will delete all payment details from the account, ensuring that no card information remains linked to the subscription or payment profile. Customers can access their account to view or update their payment method at any time. If that customer decides to return after the window closes, they have to re-enter their payment information from scratch. Shopify does not allow updating details on an existing card; instead, customers must add a new payment method if their card details change. The frictionless reactivation path that previously existed, where a former subscriber could be brought back with minimal steps, is now shorter and more conditional.
The coverage of this change has mostly framed it as a billing workflow update or a security improvement. Both characterizations are plausible. Neither one addresses what actually matters for merchants operating subscription businesses on Shopify.
The real issue is behavioral. This change compresses the window in which a merchant can recover a canceling customer before the relationship becomes significantly harder to restart. Users can manage their payment method by signing into their customer account and accessing subscription details. And when that window shrinks, the downstream effect is not just on reactivation flows. It is on the quality of the merchant’s retention behavior during that compressed window, and on what it exposes about the health of the relationship that was there before the cancellation happened.
The 24-Hour Window and What It Changes
Before this change, payment details persisted after a subscription cancellation. A customer who canceled but had their information stored could be reactivated through a single click or confirmation, without re-entering a card number. That path was convenient for the customer and operationally simple for the merchant. Win-back campaigns could work on longer timelines because the friction of returning was low.
The 24-hour deletion window changes the economics of that timeline. A merchant now has a brief period in which a canceled customer can be recovered with low friction intact. After that window closes, the customer must re-enter payment information to restart, which is a meaningful friction increase. If a payment card is removed, the subscription will continue to bill according to its existing schedule, and the user will be notified by email summarizing their active subscriptions. Some portion of customers who might have reactivated passively will not complete the re-entry step. The effective recovery rate on post-24-hour win-back campaigns drops for behavioral reasons entirely separate from offer quality or messaging relevance.
For subscription-heavy brands, this matters more than it might appear. Subscription businesses are often built on the assumption that a certain percentage of cancellations are soft churns, customers who paused for budget reasons, life circumstances, or momentary dissatisfaction, who will return without significant intervention if the path back is easy. The 24-hour window does not eliminate those customers as potential reactivations. It increases the effort required from them and from the merchant to close the return. Users will receive a notification if their payment card is removed.
Make Returns Profitable, Yes!
Cut shipping and processing costs by 70% with our patented peer-to-peer returns solution. 4x faster than traditional returns.
See How It WorksWhat Happens Inside the Compressed Window
The following are typical merchant responses to a shorter recovery window: compressing their save and reactivation strategy into that window. More urgency, more messaging, more offers, all concentrated into 24 hours of communication after a cancellation.
That sounds like a reasonable adaptation. In practice it often produces worse outcomes than it prevents.
Rushed save flows created in response to a compressed timeline tend to be noisier and less personalized than well-designed retention communication. A merchant whose save strategy was built for a longer win-back arc is not going to build a better 24-hour version overnight. They are going to take the same elements, compress the timeline, and increase the volume. The customer who just canceled receives multiple messages, often multiple emails, in a short window. The pressure reads as desperation rather than value.
Discounting under time pressure is the most common lazy response to a tightened reactivation window. If the standard tool for win-back is a discount offer, and the window to deploy it is now 24 hours instead of several weeks, the offer gets sent faster and at higher urgency. The customer learns to expect a discount when they cancel, which trains churn behavior rather than reversing it. Customers who would have stayed without an offer now learn to cancel and wait for one.
Customer messaging density in the 24-hour window can cross into a territory that harms the brand relationship rather than repairing it. Merchants often send multiple emails within this period. A customer who canceled because they felt the subscription was no longer relevant to their life does not typically need three emails and two SMS messages in the same day to be persuaded otherwise. What they need is a reason to reconsider, delivered in a way that respects the relationship. Time pressure rarely produces that. It produces noise.
Lower-quality win-back strategy is the downstream result when merchants optimize for speed rather than substance. The 24-hour window does not create the conditions for thoughtful, segmented retention communication. It creates the conditions for a reactive campaign designed to avoid losing payment details, which is a different objective than actually understanding why a customer left and whether the brand can credibly address that.
The Contrarian View: This Exposes What Was Already Broken
Here is the argument that matters more than the tactical implications of the 24-hour window.
For merchants whose reactivation strategy was primarily working because re-entry was frictionless, the Shopify subscription payment change does not create a new problem. It surfaces an existing one.
A subscription that a customer is canceling is a relationship that has already failed to demonstrate enough value to be worth keeping. Customers can manage their subscription contract directly through the store or shop interface, where they have the ability to update payment methods, modify products, change product quantity, and adjust delivery frequency. Modifying these aspects of the subscription contract also updates the billing frequency. The fact that some percentage of those customers came back when reactivation was effortless does not mean the merchant had a retention strategy. It means they had a frictionless pathway. Those are not the same thing. One is built on the quality of the product and the relationship. The other is built on reducing the activation energy required to return.
When the platform removes that frictionless pathway, the merchants who are most exposed are the ones who were relying on it as a retention mechanism rather than as a nice-to-have convenience. Their numbers will look worse after this change. But the change did not make their business worse. It made visible something that was already weak.
The merchants least affected by this change are those who had built the relationship well enough before cancellation that a customer returning later is willing to re-enter their payment information. That is not a high bar. It is the bar for having a subscription product the customer actually values. If the customer values the product but had a timing or budget issue, they will come back and they will fill in a card number. The willingness to take that small step is a signal of relationship quality that frictionless reactivation was previously masking.
What Strong Post-Purchase Design Actually Protects
The Shopify subscription payment change is a small instance of a larger dynamic: platform dependency creates exposure whenever the platform changes its surface, and the merchants most exposed are those whose business model depends on specific platform behaviors rather than on the quality of the customer relationship. Merchants can use the Shopify admin to access the Subscriptions section of the billing page, where Shopify will show the active subscriptions. Users can click a link to navigate directly to the subscription management page from the billing page to view or modify their subscription details.
This connects to the pattern visible in agentic commerce shifts and in how marketplaces and platforms reshape merchant economics through interface and workflow changes rather than through explicit fee increases. The merchant whose retention relied on frictionless reactivation was not paying attention to where the leverage actually sat. The leverage was with the platform, not with the relationship.
Strong post-purchase relationship design is the structural hedge against this kind of exposure. A customer who feels well-served, whose expectations were set accurately, whose questions were answered without friction, and who trusts the brand to deliver consistently, is a different kind of subscription risk than a customer who stayed subscribed because canceling and returning was roughly symmetrically effortless.
The post-purchase communication design, including onboarding sequences for new subscribers, milestone acknowledgments, product education, proactive status communications, and an exceptional returns program that builds loyalty, is what builds the relationship that makes reactivation less dependent on frictionless payment mechanics. Merchants who have invested in that communication layer are less affected by the 24-hour deletion because their customers were never primarily staying out of inertia.
For subscription brands that also manage fulfillment complexity and broader supply chain obstacles they need to overcome, there is an additional compounding pressure worth noting. A customer who cancels partly because of a delivery experience problem is not a candidate for a 24-hour win-back no matter how the payment handling works. The underlying delivery and fulfillment cost pressures that affect the post-purchase experience, including decisions about whether to lean on programs like Amazon’s Buy with Prime for DTC brands or alternative peer-to-peer fulfillment networks that respond to the Amazon Prime effect, are a separate but related set of forces that shape whether subscription customers stay or leave in the first place. Addressing those operational fundamentals is upstream of any retention window conversation.
Convert Returns Into New Sales and Profits
Our peer-to-peer returns system instantly resells returned items—no warehouse processing, and get paid before you refund.
I'm Interested in Peer-to-Peer ReturnsWhat Merchants Should Actually Do
The practical response to the Shopify subscription payment change is not to build a better 24-hour save flow. The save flow matters, but it is the last line of defense, not the primary strategy.
A key step is ensuring the store owner performs changes to payment methods to avoid potential service interruptions. If a primary payment method fails, Shopify will attempt to charge any backup payment methods on file, so adding a backup payment method is recommended. Multiple payment methods can be managed by designating one as the main method in the payment settings. Users can add a new payment method, such as PayPal, in the billing section of the Shopify admin. Charges for third-party apps are billed separately but usually use the same primary billing method set for the Shopify store. To manage payment methods, use the Shopify admin go navigation (e.g., Apps > Subscriptions), select the contract associated with your subscription, and edit the payment methods section in your account settings. You can switch payment methods for your subscription contracts, and Stripe integration may be involved in updating or creating new payment methods. Support resources are available for troubleshooting payment method issues, including those related to Stripe, just as evaluating fulfillment partners such as Cahoot vs. ShipMonk for scalable order fulfillment or broader order fulfillment services for ecommerce companies is part of reducing operational friction.
The response is to invest in the relationship quality that makes the 24-hour window less consequential in the first place.
That means building onboarding communication that helps new subscribers understand the full value of what they have subscribed to, before they reach a point of considering cancellation. It means designing pause and defer options that give customers a lower-friction exit than cancellation, capturing the intent to return without requiring the full exit and re-entry cycle. It means segmenting the subscriber base by engagement signals and identifying at-risk subscribers before they reach the cancellation decision, rather than after.
For the 24-hour window itself, a simple, non-pressured single communication that acknowledges the cancellation, offers a genuine reason to reconsider without urgency or excessive discounting, and makes the path to return clear and easy is better than multiple messages attempting to manufacture urgency. The goal is to make the brand present and accessible, not to recreate the pressure of a time-limited offer.
For customers who do not return within the window, a longer-arc win-back sequence that focuses on product updates, new offerings, relevant reasons to reconsider, and convenient touchpoints such as thoughtfully designed returns and exchanges through solutions like Happy Returns’ reverse logistics network can still convert them when paired with an order fulfillment strategy that acts as a profit driver. The friction of re-entering payment information is real, but it is not prohibitive for a customer who genuinely wants to return. Addressing that step explicitly, by making the re-entry process as clear and simple as possible, removes the technical barrier without requiring the brand to panic-message in the first 24 hours.
Frequently Asked Questions
What is the Shopify subscription payment change?
Shopify changed how payment details are handled when a customer cancels a subscription. Users can manage their Shop Pay subscriptions and payment methods by signing in to their account through a web browser, including on a mobile device. Payment information is now deleted 24 hours after cancellation. Customers who want to reactivate after that window closes must re-enter their payment details, whereas previously their stored information remained available.
Why does the 24-hour deletion window matter for merchants?
It shortens the window in which a merchant can recover a canceling customer without requiring them to re-enter payment information. After 24 hours, any reactivation attempt involves more friction for the customer, which reduces the likelihood that soft churns, customers who might have returned naturally, will complete the return.
What is the biggest mistake merchants make in response to this change?
Compressing their entire save strategy into the 24-hour window with more urgency, more messaging, and more discounting. This approach tends to produce lower-quality retention behavior that harms the brand relationship rather than repairing it, and trains customers to cancel in anticipation of a discount offer.
How does strong post-purchase communication reduce exposure to this change?
Customers who have had a high-quality post-purchase experience, including clear communication, accurate expectations, and genuine perceived value, are more willing to re-enter payment details when they want to return. The 24-hour window is less consequential for merchants whose subscribers stayed because of product and relationship quality rather than frictionless inertia.
Is this change specific to Shopify Subscriptions or does it affect third-party subscription apps?
The change affects how Shopify handles subscription payment contracts at the platform level. The specific behavior for third-party subscription apps may vary depending on how they integrate with Shopify’s payment infrastructure. Merchants using apps built on Shopify’s native subscription APIs are most directly affected.
Should merchants prioritize win-back campaigns within the 24-hour window?
A single, calm, non-pressured communication within the window is appropriate. Stacking multiple messages with escalating urgency is likely to produce worse outcomes than saying nothing because it signals desperation and may damage the relationship further. The window is an opportunity for a clear, low-pressure acknowledgment rather than a compressed retention campaign.
Written By:
Rinaldi Juwono
Rinaldi Juwono leads content and SEO strategy at Cahoot, crafting data-driven insights that help ecommerce brands navigate logistics challenges. He works closely with the product, sales, and operations teams to translate Cahoot’s innovations into actionable strategies merchants can use to grow smarter and leaner.
Turn Returns Into New Revenue
Related Articles
How to Introduce P2P Returns Without Breaking CX
Introducing peer-to-peer returns without breaking customer experience is mostly a change-management and trust-design problem, not a technology problem.
Why P2P Requires a Different Mental Model
Introduction Most people misunderstand peer-to-peer returns for the same reason: they evaluate the system through warehouse-first assumptions.
When Warehouse Returns Still Make Sense
A serious returns strategy does not pretend one path fits every return.
Peer-to-Peer vs Warehouse Returns: A Structural Comparison
In this article
13 minutes
- Warehouse Returns Are Built Around a Centralized Reverse Logistics Loop
- Peer-to-Peer Returns Are Built Around Forward Routing
- This Is an Architecture Decision, Not a Workflow Tweak
- Convenience Can Improve the Experience Without Changing the System
- Once Routing Changes, Everything Else Changes With It
- Not Every Return Needs the Same Path
- Conclusion
- Frequently Asked Questions
Most returns content compares portals, labels, and drop-off options. The more important question is where the inventory goes next. Peer-to-peer returns and warehouse returns are not two slightly different versions of the same process. They are different routing systems, and that difference changes transport, labor, recovery speed, fraud exposure, and markdown risk.
That distinction matters because ecommerce returns are large enough to shape operating strategy, not just post-purchase workflow. Average ecommerce return rates are high enough that the approved source pack uses NRF and Happy Returns data showing that retailers estimated 16.9% of annual sales would be returned in 2024, totaling $890 billion. In 2025, total retail returns are estimated to reach $849.9 billion, with 19.3% of online sales expected to be returned, highlighting the significant impact of returns on ecommerce businesses. At that scale, routing is not a minor process preference. It determines how many shipping legs, queue points, labor touches, and resale delays get built into the system before optimization even starts.
Make Returns Profitable, Yes!
Cut shipping and processing costs by 70% with our patented peer-to-peer returns solution. 4x faster than traditional returns.
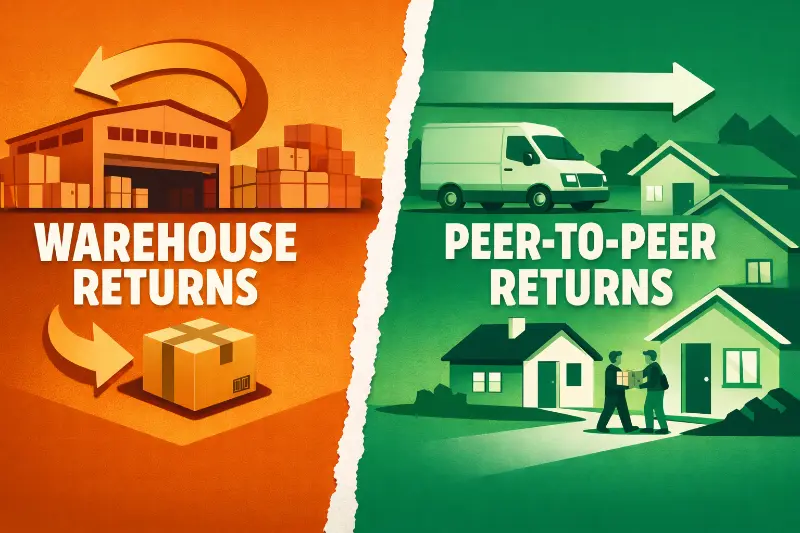
See How It WorksIn the traditional warehouse-centric return loop, ecommerce returns are sent back to a brand or warehouse processing center, where items are inspected, restocked, and eventually resold. This process adds extra steps, costs, and delays, amplifying the true cost of “free” returns for retailers. In contrast, peer-to-peer returns allow the original buyer to ship the item directly to a new customer, bypassing the processing center entirely, which reduces costs, speeds up refunds, and improves sustainability.
Warehouse Returns Are Built Around a Centralized Reverse Logistics Loop
Traditional returns start from one assumption: the item needs to go back to a warehouse, return center, or DC before it can re-enter commerce. That creates the familiar reverse flow: the customer initiates the return, the item ships backward into the network, it enters centralized intake, it gets inspected, then it is repackaged, restocked, liquidated, or disposed. That is the logic behind the warehouse-centric return loop.
The important point is not that warehouses sometimes execute returns badly. It is that inbound shipping, centralized labor, queue time, and resale delay are built into the model itself, which is why a high ecommerce return rate can erode profit margins through reverse logistics costs. Two shipping legs are unavoidable. Labor is unavoidable. Delay is unavoidable. Markdown exposure is unavoidable. In this architecture, value recovery happens only after the item travels backward, waits, gets touched, and gets processed. The cash flow impact is similar to operating a bank account that constantly loses value through fees and delays, draining resources. Compared to the safety and predictability of bank deposits, traditional returns expose retailers to more risk and uncertainty, with no federal insurance or guarantees. The slow and costly nature of traditional returns is much like the low yields of traditional savings accounts—inefficient and uncompetitive compared to modern alternatives. Additionally, traditional return processes can take several weeks for customers to receive their refunds, which negatively impacts satisfaction. In contrast, peer-to-peer returns can reduce costs associated with return shipping, warehouse labor, and customer service, making the process more efficient than traditional returns.
Peer-to-Peer Returns Are Built Around Forward Routing
Peer-to-peer returns start from a different assumption. Drawing a parallel to peer p2p lending, peer to peer lending, peer lending, marketplace lending, and lending platforms, which use online platforms to connect individual lenders directly with individual borrowers, peer-to-peer returns leverage online platforms to connect returners directly with the next customer. Instead of treating the warehouse as the default destination, the system checks whether the return is eligible to move directly to the next buyer. Much like loan listings in social lending, where individual lenders review and fund requests from individual borrowers, peer-to-peer returns enable a direct connection between the returner and the next customer, bypassing traditional intermediaries.
In the approved framing for what peer-to-peer returns are, the customer still initiates the return through a branded experience, but an eligible item is rerouted, not reprocessed. A like-new or open-box listing can be created, and the returner uses a shipping label to send the item directly to the next customer instead of back to centralized intake. This process allows customers to ship returned items directly to new buyers, bypassing the warehouse, which reduces costs and speeds up the resale process. Additionally, peer-to-peer returns enhance sustainability by reducing carbon emissions and packaging waste associated with traditional return logistics, as items are forwarded directly to new customers.
That sounds like a simple change, but it is not a cosmetic one. It changes where the item goes next, how many handoffs it experiences, how quickly it can be resold, and which cost layers disappear altogether. For the detailed mechanics, see how peer-to-peer returns actually work. The point here is narrower: peer-to-peer returns are a forward-moving routing model for eligible inventory.
Convert Returns Into New Sales and Profits
Our peer-to-peer returns system instantly resells returned items—no warehouse processing, and get paid before you refund.
I'm Interested in Peer-to-Peer ReturnsThis Is an Architecture Decision, Not a Workflow Tweak
This is the center of the comparison. Most teams frame returns decisions around refund timing, portal design, label convenience, or drop-off experience. Those choices matter, but they sit on top of a more consequential design choice: does returned inventory move backward to a centralized intake node, or can eligible inventory move forward to the next buyer? That routing assumption is what changes cost, speed of recovery, inventory velocity, and fraud surface area, especially as ecommerce return rates continue to rise—much like how peer to peer investing decisions impact risk, liquidity, and returns for investors.
A returned shirt makes the difference easy to see. In a warehouse model, it ships back to a return center, waits for intake, gets checked, gets rebagged or restocked, and only then has a chance to re-enter demand. In a peer-to-peer model, that same eligible shirt can move directly from the returner to the next buyer with no inbound warehouse handling at all. The item did not change. The route did. That is why the system changed with it.
This routing decision parallels the way investors approach peer-to-peer lending platforms, where individual and institutional investors lend money directly to borrowers, bypassing traditional financial institutions and traditional banks. Investors must assess credit risk, liquidity risk, and the risks involved—such as borrower defaults—when evaluating loan offers and deciding how to allocate money across loans. Just as investors can spread capital across multiple loans to mitigate the impact of borrower defaults and align with their risk tolerance and financial goals, brands must make informed decisions about routing to balance higher returns, attractive returns, and lower risk in their returns process.
Peer-to-peer lending platforms match lenders with borrowers, assess borrower creditworthiness, and assign risk grades that determine interest rates. These platforms offer attractive interest rates and higher returns compared to traditional loans or savings accounts, but also come with higher risk, especially since many loans are unsecured and not government-insured, meaning loss of capital is possible. P2P loans are fixed-income assets with defined interest rates and repayment schedules, making them less volatile than stocks, but liquidity risk remains since investments are often tied up for 3–5 years unless a secondary market is available. Economic downturns can increase borrower defaults, impacting net returns. The regulatory landscape is also fragmented, with some states limiting or prohibiting peer-to-peer investing.
Ultimately, just as investors in peer-to-peer lending must weigh the risks and benefits of lending money to borrowers—considering factors like good credit, business loans, personal loans, lower interest rates, and the ability for the borrower to repay—brands must evaluate whether backward or forward routing best aligns with their operational risk tolerance and financial objectives. Both models require careful risk management and a clear understanding of the potential for higher returns versus the risks involved.
Convenience Can Improve the Experience Without Changing the System
This is where modern returns conversations often get confused. Better portals, easier labels, and box-free drop-off can improve the customer experience and boost customer satisfaction by making returns less of a hassle, but they do not fundamentally change the inventory path. Customers prefer a return process that is quick and easy, as they dislike the hassle of traditional return methods that involve printing labels and waiting for refunds, which is why many brands focus on streamlining return labels and digital alternatives. Peer-to-peer returns can improve customer satisfaction by providing a quicker and more convenient process, allowing customers to receive refunds faster than traditional methods. That is why returns software doesn’t actually fix returns. Software improves intake, not routing. Convenience does not equal structural change.
The source pack gives concrete examples. UPS acquired Happy Returns’ reverse logistics network in 2023, and FedEx launched FedEx Easy Returns in 2025. Those are meaningful signals that the market is investing in faster, easier return entry. But they are also evidence that the industry is still strengthening collection and reverse logistics infrastructure, not necessarily escaping it. The point is not that convenience is unimportant. The point is that modern returns convenience and modern returns redesign are not the same thing. Peer-to-peer returns can significantly reduce shipping costs and eliminate return shipping and restocking fees, which can average 20% of revenue for ecommerce businesses. Additionally, by forwarding items directly to new customers, peer-to-peer returns help reduce packaging waste and lower the carbon emissions associated with traditional return logistics, enhancing sustainability efforts.
Amazon’s “frequently returned” visibility adds another signal. Returns are no longer just a back-room operating issue. They are visible enough to influence the shopping experience itself. That does not prove peer-to-peer is the right answer for every category. It does show that the old model is under pressure in ways shoppers can increasingly see.
No More Return Waste
Help the planet and your profits—our award-winning returns tech reduces landfill waste and recycles value. Real savings, No greenwashing!
Learn About Sustainable ReturnsOnce Routing Changes, Everything Else Changes With It
The cost difference starts with routing. In a warehouse model, backward movement creates inbound transport, intake labor, queue-driven delay, avoidable rehandling, and repeated markdown exposure by design. In a forward-routing model, eligible items can skip warehouse intake, redundant shipping, and some of the labor tied to centralized inspection and restocking. As many retailers reassess whether free returns are still sustainable, routing becomes a first-order lever. For ecommerce businesses, especially ecommerce brands and small business owners, peer-to-peer returns can significantly reduce costs by eliminating return shipping and restocking fees, which can average 20% of revenue. This model also allows for faster resale of returned items, as products can be sold directly to new customers without going through traditional return processing, thus improving cash flow. In fact, ecommerce businesses can resell returned items quickly, often at 85-95% of retail value, without incurring additional shipping and handling costs. Additionally, peer-to-peer returns enhance sustainability efforts and reduce environmental impact by lowering carbon emissions and packaging waste associated with traditional return logistics, as items are forwarded directly to new customers instead of being shipped back to warehouses. That is the basic logic behind the hidden economics of a return and the economics of peer-to-peer returns.
Time is the hidden destroyer here. The approved source pack is explicit that teams underestimate returns when they flatten them into an average and ignore how costs stack across shipping, labor, delay, markdown pressure, and fraud exposure. Time destroys value in reverse logistics because every extra queue pushes recovery farther away from fresh demand. Delay creates markdown drag.
Routing also changes control. A warehouse-centric model creates more handoffs and more opacity. A shorter chain changes the fraud equation because accountability is clearer when fewer parties touch the item. It also changes the role of the warehouse. Once selective forward routing exists, the warehouse stops being the default destination for everything and becomes an exception handler for the returns that truly need centralized processing, while lighter-weight tools like a returns management solution such as Return Prime can focus on policy, routing rules, and customer communication instead of owning all the physical logistics.
Not Every Return Needs the Same Path
A credible comparison has to say this plainly: not every SKU belongs in peer-to-peer. Fragile items, defective items, regulated goods, and timing-sensitive returns may still need warehouse handling. That is the hybrid reality, and it is why where peer-to-peer returns don’t work matters as much as the upside case.
The point is not to replace warehouses with ideology. The point is to stop sending every return through the same expensive path by default. Peer-to-peer is most credible as a selective structural layer for eligible inventory, while warehouses continue to handle exceptions, defects, and non-qualifying items. Warehouses still matter, just not for every return. That is the practical middle ground.
Traditional Returns Are Ending
Ecommerce built a returns system for a smaller internet. Today it’s collapsing under scale. Warehouses can’t absorb the volume, costs keep rising, and retailers are quietly tightening policies. This article explains why the old model is failing and what replaces it.
Read the Returns BibleConclusion
When operators say they want a better returns process, they usually mean a better front door. But the real comparison starts after the customer clicks return. Warehouse returns optimize the backward loop. Peer-to-peer returns reroute eligible items out of it. One model tries to manage transport, labor, delay, and markdown exposure more efficiently. The other changes the route so some of those layers never appear in the first place. That is why this is not a portal decision. It is an architecture decision. And it is also why returns need to go forward, not back.
Frequently Asked Questions
Are peer-to-peer returns just another kind of returns portal?
No. A portal can exist in either model. The structural difference is what happens after return initiation. In a warehouse model, the item goes back to centralized intake. In a peer-to-peer model, an eligible item can be rerouted directly to the next buyer.
Do peer-to-peer returns replace warehouses?
No. The approved model is explicitly hybrid. Warehouses still matter for defective, fragile, regulated, or timing-sensitive returns. Peer-to-peer is a selective structural layer for eligible inventory, not a universal replacement.
Why doesn’t box-free drop-off solve the same problem?
Because easier return entry is not the same as changing the inventory route. The source pack uses UPS and Happy Returns plus FedEx Easy Returns as evidence that convenience infrastructure is improving even while reverse logistics infrastructure remains central.
What kinds of returns are best suited for peer-to-peer?
The approved framing centers peer-to-peer on eligible, resellable items that can move forward as like-new or open-box inventory. Damaged, highly fragile, regulated, or otherwise unsuitable items are better candidates for warehouse handling.
Why does routing matter so much economically?
Because routing determines which costs exist at all. Backward movement adds transport, labor, queue time, and delay. Forward movement can remove some of those layers before optimization begins. That is why the gap starts with path design, not just better processing after the item has already come back.
Written By:
Manish Chowdhary
Manish Chowdhary is the founder and CEO of Cahoot, the most comprehensive post-purchase suite for ecommerce brands. A serial entrepreneur and industry thought leader, Manish has decades of experience building technologies that simplify ecommerce logistics—from order fulfillment to returns. His insights help brands stay ahead of market shifts and operational challenges.
Turn Returns Into New Revenue
Related Articles
How to Introduce P2P Returns Without Breaking CX
Introducing peer-to-peer returns without breaking customer experience is mostly a change-management and trust-design problem, not a technology problem.
Why P2P Requires a Different Mental Model
Introduction Most people misunderstand peer-to-peer returns for the same reason: they evaluate the system through warehouse-first assumptions.
When Warehouse Returns Still Make Sense
A serious returns strategy does not pretend one path fits every return.
Does UPS Deliver on Saturdays? UPS Weekend Delivery Explained

In this article
14 minutes
- Yes, UPS Delivers on Saturdays
- Saturday Delivery Is Not the Same as Universal Weekend Delivery
- Does UPS Deliver on Sunday?
- Which UPS Services Offer Saturday Delivery?
- Does UPS Ground Deliver on Saturday?
- How Much Does UPS Saturday Delivery Cost?
- Does UPS Offer Saturday Pickup?
- How Late Does UPS Deliver on Saturday?
- UPS vs. FedEx, USPS, and Amazon Weekend Delivery
- What Saturday Delivery Means for Ecommerce Sellers
- Weekend Delivery Depends on Fulfillment, Not Just the Carrier
- How Cahoot Helps Sellers Compete on Fast Delivery
- How to Check Whether Your UPS Package Will Arrive Saturday
- The Bottom Line on UPS Saturday Delivery
- Frequently Asked Questions
Yes, UPS delivers on Saturdays for many residential and commercial packages. UPS says it offers Monday through Saturday delivery service for residential and commercial parcels, but standard UPS delivery does not run on Sunday. UPS delivers packages on weekends, especially to meet the needs of e commerce businesses, as the demand for faster shipping in online retail continues to grow. Most packages are generally delivered by 8 p.m., though the final delivery time can vary by route, package volume, weather, holidays, and destination.
For consumers, the answer is simple: UPS Saturday delivery is available for many packages, but you should check your tracking number for the latest details. For ecommerce sellers, the bigger question is whether UPS delivers on weekends is particularly relevant for e commerce operations aiming to meet customer expectations, while also considering if Saturday delivery actually helps you improve the customer promise without creating unnecessary shipping costs, operational stress, or missed expectations at checkout.
Yes, UPS Delivers on Saturdays
UPS does deliver on Saturdays, and Saturday delivery is now part of many UPS weekend delivery options. This can include ground residential delivery packages, commercial parcels, and certain air services, depending on the selected service, destination, package weight, and shipper settings.
That does not mean every UPS package will arrive on Saturday. Availability can vary by location, service level, whether the destination is a residential address or business address, and how UPS defines a business day for the specific service. A package moving through UPS Ground, UPS 2nd Day Air, Next Day Air, UPS SurePost, or another service may have different Saturday delivery rules.
The best way to confirm whether a specific UPS package will arrive on Saturday is to check the tracking number. UPS tracking is the source of truth for a live shipment because it reflects the selected service, current scan history, destination, and final delivery status.
Saturday Delivery Is Not the Same as Universal Weekend Delivery
A common mistake is assuming that “UPS weekend delivery” means UPS delivers every package on both Saturday and Sunday. That is not how it works.
UPS offers Saturday delivery for many shipments, but Sunday delivery is not standard. UPS’s weekend delivery page says UPS offers Monday through Saturday delivery for residential and commercial parcels and that there are no Sunday deliveries. UPS’s weekend services primarily focus on Saturday deliveries, with limited or no standard Sunday service.
That distinction matters. If a customer asks whether UPS delivers on weekends, the short answer is: yes, UPS delivers on Saturdays, but standard UPS Sunday delivery is not available. If a package is urgent, the shipper may need a special service or a different delivery option rather than assuming it can arrive on Sunday.
Does UPS Deliver on Sunday?
For standard UPS delivery, no. UPS does not generally deliver on Sunday. Most UPS locations are not open for standard deliveries on Sunday, and UPS open hours typically cover Monday through Saturday.
There may be edge cases involving urgent services, special arrangements, final-mile partnerships, or nonstandard delivery situations, but those should not be treated as normal UPS Sunday delivery. Consumers should check tracking details. Ecommerce sellers should never promise Sunday delivery at checkout unless the selected service specifically supports it.
This is especially important for ecommerce brands because shoppers often compare UPS, FedEx, USPS, and Amazon orders without understanding that each carrier has different weekend delivery rules. If your checkout promise says an order will arrive “this weekend,” customers may interpret that as Saturday or Sunday. Your carrier selection may not support that.
Slash Your Fulfillment Costs by Up to 30%
Cut shipping expenses by 30% and boost profit with Cahoot's AI-optimized fulfillment services and modern tech —no overheads and no humans required!
I'm Interested in Saving Time and MoneyWhich UPS Services Offer Saturday Delivery?
Saturday delivery can depend on the UPS service used, the destination, and whether the shipment qualifies. UPS lists Saturday delivery as available for services such as UPS 2nd Day Air and UPS 3 Day Select on its domestic shipping services page.
Here is a practical overview:
| UPS Service | Saturday Delivery Notes |
| UPS Ground | Saturday ground deliveries may be available for many residential packages, depending on location, destination, and service eligibility. |
| UPS 2nd Day Air | Saturday delivery may be available depending on the selected service and destination. UPS lists Saturday delivery as available for UPS 2nd Day Air. |
| UPS Next Day Air | Saturday delivery may be available for time sensitive shipments in eligible areas. Shippers should confirm availability and any additional fees during label creation. |
| UPS SurePost | SurePost deliveries may involve USPS for final delivery, making weekend and even Sunday delivery possible in some cases. SurePost is an exception among UPS services, as its integration with USPS allows for some weekend and Sunday deliveries, depending on USPS weekend schedules and the destination. |
| UPS Express Critical | Designed for urgent deliveries and special shipping needs. This may be relevant for urgent shipments, but it is not the same as standard Saturday ground delivery. |
The main point: do not assume Saturday delivery applies just because UPS transports the package. Confirm the selected service, destination, and delivery options before promising a Saturday arrival.
Does UPS Ground Deliver on Saturday?
UPS Ground can deliver on Saturday in many cases, especially for residential deliveries. In fact, ground residential deliveries on Saturdays are often included at no additional cost for eligible addresses. However, eligibility depends on the shipment, destination, and service availability.
For shoppers, this means a UPS Ground package may arrive Saturday, but it is not something to guess from the service name alone. Check tracking.
For ecommerce sellers, this matters because Saturday ground deliveries can sometimes improve delivery speed without paying for a more expensive air service. If a Friday shipment can reach a nearby residential customer on Saturday by ground, that may be more cost-effective than upgrading every order to UPS 2nd Day Air.
But this only works if the seller’s fulfillment process supports it. If the order misses the warehouse cutoff, sits unprocessed until Monday, or cannot be picked up on Saturday, the theoretical Saturday delivery advantage disappears.
How Much Does UPS Saturday Delivery Cost?
UPS Saturday delivery cost can vary. The final cost may depend on the selected service, package weight, destination, residential or commercial delivery type, shipper account settings, and whether Saturday delivery is included or added as an option. For many ground residential deliveries, there is no additional cost for Saturday delivery, but other UPS services may incur extra fees for Saturday service.
Some Saturday delivery options may be included for certain services or regions, while others may involve additional fees. That is why sellers should confirm the final cost during label creation, rate shopping, or checkout configuration rather than relying on a blanket rule.
For ecommerce brands, the cost question should be broader than “Does UPS charge extra for Saturday delivery?” The better question is:
Does Saturday delivery help us meet a faster delivery promise at a cost that still protects margin?
Sometimes the answer is yes. Sometimes the added fee or required service upgrade makes the order unprofitable. The right choice depends on shipping costs, package weight, destination, order value, customer expectations, and available carrier options, and whether expedited shipping options actually improve the overall economics.
Looking for a New 3PL? Start with this Free RFP Template
Cut weeks off your selection process. Avoid pitfalls. Get the only 3PL RFP checklist built for ecommerce brands, absolutely free.
Get My Free 3PL RFPDoes UPS Offer Saturday Pickup?
Yes, UPS offers Saturday pickup options. UPS says it offers Saturday package car pickup services, which can help businesses that want to move orders into the shipping process before Monday. UPS offers Saturday pickups for various services, and customers can schedule a UPS pickup on Saturdays depending on their location and service requirements.
Saturday pickup is different from Saturday delivery. A package can be delivered on Saturday even if the seller does not use Saturday pickup. Likewise, a seller may want Saturday pickup so weekend orders begin moving sooner, even if final delivery happens the following week.
This distinction is important for ecommerce sellers. If your warehouse closes Friday afternoon and does not process orders again until Monday, Saturday delivery alone may not help your customers. To make weekend delivery useful, you may also need weekend ecommerce order fulfillment services, Saturday pickup, accurate cutoff times, and carrier services that match your delivery promises.
UPS Store hours and pickup availability can vary by location, so customers and sellers should check local details before assuming a drop-off or pickup option is open on Saturday.
How Late Does UPS Deliver on Saturday?
UPS says most packages are generally delivered by 8 p.m.
That does not mean every Saturday package will arrive at the same time. Delivery times depend on driver route, destination, service level, package volume, weather, holidays, and operational conditions. A package marked “out for delivery” may still arrive later in the day.
For a specific package, the tracking number is the best place to check. If the shipment has a guaranteed delivery commitment, tracking and service details should show the relevant information. If the package does not have a specific guaranteed delivery time, customers should avoid assuming it will arrive in the morning or early afternoon.
UPS vs. FedEx, USPS, and Amazon Weekend Delivery
Consumers often search UPS weekend delivery alongside FedEx Home Delivery, USPS weekend delivery, Priority Mail, and Amazon orders because weekend delivery expectations have changed. Many shoppers now expect packages to move or arrive on Saturdays, and some expect Sunday delivery as well. Saturday delivery and pickup services are most widely available in major metropolitan areas, where demand and logistical efficiency are highest.
But carriers do not all operate the same way.
FedEx, USPS, Amazon, and UPS each have different delivery services, pickup rules, final delivery networks, and weekend coverage. USPS may deliver certain mail and packages on weekends. Amazon orders may arrive on weekends depending on the fulfillment network and local delivery capacity. FedEx Home Delivery has its own residential delivery model.
For ecommerce sellers, the lesson is simple: do not build checkout promises around assumptions. Build them around the actual carrier service, customer location, fulfillment cutoff, and delivery estimate, whether you’re managing your own store or relying on marketplaces like those that benefit from fast eBay fulfillment.
What Saturday Delivery Means for Ecommerce Sellers
Saturday delivery can be a real advantage for ecommerce brands, especially Shopify merchants using dedicated fulfillment services, but only when the operation behind it is ready.
For example, Saturday delivery can help reduce the Friday-to-Monday delivery gap. A package shipped on Friday may be able to reach certain residential customers on Saturday instead of waiting until Monday. That can improve customer satisfaction, reduce “Where is my order?” tickets, and make a brand’s delivery promise more competitive.
Saturday delivery can also help with time sensitive shipments. If a customer needs an item before the weekend, a seller may be able to use UPS Saturday delivery options or specialized Amazon SFP 3PL fulfillment services instead of automatically upgrading to the most expensive urgent delivery service.
But there is a hard truth here: carrier availability does not fix weak fulfillment execution.
If inventory is too far from the customer, if orders are not picked and packed quickly, if cutoff times are unrealistic, or if the wrong service is selected at label creation, Saturday delivery will not save the customer experience. It may only add cost.
Weekend Delivery Depends on Fulfillment, Not Just the Carrier
Many ecommerce sellers focus on whether UPS, FedEx, or USPS can deliver on Saturday. That is only one part of the shipping process.
To use Saturday delivery effectively, a seller needs to answer several operational questions, especially if they also sell on marketplaces with strict fast-shipping standards such as Walmart’s TwoDay and ThreeDay delivery requirements:
- Is the inventory close enough to the customer for ground delivery to arrive on Saturday?
- Can the warehouse process Friday and weekend orders fast enough?
- Is Saturday pickup available?
- Does the checkout promise account for weekends and holidays?
- Are customer support teams prepared to explain Saturday and Sunday delivery differences?
- Does the selected service support the promised delivery date?
- Are additional fees worth the customer experience benefit, and do you have proof from fulfillment service reviews that your partners can consistently deliver on those promises?
This is where distributed fulfillment can make a meaningful difference. When inventory is placed closer to customers, more orders can reach buyers quickly by ground. Leveraging specialized order fulfillment services for ecommerce companies can reduce the need to pay extra for air services and make fast delivery more affordable.
How Cahoot Helps Sellers Compete on Fast Delivery
Cahoot does not control UPS delivery days, and Saturday delivery is ultimately determined by the carrier, service, destination, and shipment details.
Where Cahoot can help is in the fulfillment strategy behind the shipment. Ecommerce brands need more than a carrier that offers Saturday delivery. They need ecommerce fulfillment software that supports inventory placement, order routing, fulfillment execution, and shipping choices that make fast delivery practical and cost-aware.
With a smarter fulfillment network and multi-carrier shipping software for ecommerce, sellers may be able to reach more customers in fewer days, use ground services more effectively, reduce unnecessary expedited shipping costs, and set more accurate delivery expectations at checkout. That is the operational advantage: not simply knowing that UPS delivers on Saturdays, but building a fulfillment process that can use weekend delivery without damaging margins.
Scale Faster with the World’s First Peer-to-Peer Fulfillment Network
Tap into a nationwide network of high-performance partner warehouses — expand capacity, cut shipping costs, and reach customers 1–2 days faster.
Explore Fulfillment NetworkHow to Check Whether Your UPS Package Will Arrive Saturday
If you are waiting for a UPS package, follow these steps:
- Check your UPS tracking number.
- Review the selected service.
- Look at the estimated delivery date.
- Confirm whether the destination is eligible for Saturday delivery.
- Watch for updates such as “out for delivery” or “delivery attempted.”
- Contact UPS or the shipper if the shipment is urgent.
If you are an ecommerce seller, check Saturday delivery availability during label creation or rate shopping. Do not rely on a general rule. Confirm the service, destination, final cost, and any added charge before presenting Saturday delivery as an option to customers, and make sure your multi-carrier shipping software accurately reflects those options.
The Bottom Line on UPS Saturday Delivery
UPS does deliver on Saturdays for many residential and commercial packages. Saturday delivery may apply to UPS Ground, air services, and other UPS delivery options depending on the shipment, destination, and selected service.
But UPS Saturday delivery is not the same as universal weekend delivery. Standard UPS Sunday delivery is not available, Saturday pickup is separate from Saturday delivery, and the final cost can vary.
For consumers, the best move is to check the tracking number. For ecommerce sellers, the better move is to build a fulfillment operation that can use Saturday delivery intelligently: close inventory, realistic cutoffs, accurate checkout promises, and carrier choices that balance speed with cost.
FAQs About UPS Saturday Delivery
Does UPS deliver on Saturdays?
Yes, UPS delivers on Saturdays for many residential and commercial packages. Availability depends on the selected service, destination, package type, and shipper settings.
Does UPS deliver on Sundays?
Standard UPS delivery does not usually run on Sunday. UPS says it offers Monday through Saturday delivery service for residential and commercial parcels and that there are no Sunday deliveries.
Does UPS Ground deliver on Saturday?
UPS Ground may deliver on Saturday for many residential packages, depending on the shipment and destination. Check the tracking number or confirm availability during label creation.
Does UPS 2nd Day Air deliver on Saturday?
UPS lists Saturday delivery as available for UPS 2nd Day Air, but availability can depend on destination and shipment details.
How much does UPS Saturday delivery cost?
UPS Saturday delivery cost can vary based on service, package weight, destination, account settings, and whether Saturday delivery is included or added. Check UPS rates during label creation or contact UPS for the final cost.
Does UPS offer Saturday pickup?
Yes, UPS offers Saturday pickup options, including Saturday package car pickup services. Pickup availability can vary by location and business setup.
What is the latest time UPS delivers on Saturday?
UPS says most packages are generally delivered by 8 p.m. Actual delivery times can vary by route, volume, weather, service, and destination.
Can ecommerce sellers offer Saturday delivery at checkout?
Yes, but only if the selected carrier service, destination, fulfillment cutoff, pickup schedule, and delivery estimate support it. Sellers should avoid promising Saturday delivery unless they can confirm availability and cost.
Is Saturday delivery guaranteed?
Not always. Some services may include specific delivery commitments, while others provide estimated delivery windows. Check the selected service and UPS tracking details for the most accurate information.
Written By:
Rinaldi Juwono
Rinaldi Juwono leads content and SEO strategy at Cahoot, crafting data-driven insights that help ecommerce brands navigate logistics challenges. He works closely with the product, sales, and operations teams to translate Cahoot’s innovations into actionable strategies merchants can use to grow smarter and leaner.
Turn Returns Into New Revenue
Related Articles
How to Introduce P2P Returns Without Breaking CX
Introducing peer-to-peer returns without breaking customer experience is mostly a change-management and trust-design problem, not a technology problem.
Why P2P Requires a Different Mental Model
Introduction Most people misunderstand peer-to-peer returns for the same reason: they evaluate the system through warehouse-first assumptions.
When Warehouse Returns Still Make Sense
A serious returns strategy does not pretend one path fits every return.
Amazon’s New Coupon Display Changes How Shoppers Perceive Value

In this article
11 minutes
Within the broader e-commerce landscape, Amazon stands out as a platform that continually enhances its features to improve the customer experience and requires business adaptability from sellers. Amazon is currently testing a new coupon display that shows the final price after the coupon is applied, rather than just the discount amount or percentage. This new format aims to simplify the shopping experience by allowing customers to see the exact price they will pay without needing to calculate the discount themselves. Most brands see this update as a positive change, as it simplifies price comparison for customers and could improve click-through rates and conversions. Official updates about such changes are communicated through Seller Central, Amazon’s hub for managing seller accounts and accessing important information.
The coverage of this change has mostly focused on the mechanics: how to set up coupons, whether to adjust coupon budgets, whether Prime Exclusive Discounts behave differently. That framing treats the update as an interface tweak with some operational implications.
That framing is too narrow. This is an economics shift disguised as a display change. And the sellers who do not understand the difference will misread the consequences for months.
What the Coupon Badge Was Actually Doing
Before getting into what changes, it is worth being precise about what the green coupon badge was doing for sellers who used it.
The badge was not just communicating a discount. It was doing psychological work at the point of attention, before a shopper had made any conscious decision to engage with the listing. A green badge showing “15% off with coupon” in search results functioned as a visual cue that interrupted the scroll, signaled deal availability, and created a moment of perceived value without requiring the shopper to read a word of copy or evaluate anything about the product itself. Research indicates that the presentation of discounts significantly influences consumer behavior and conversion: ‘cents-off’ coupons allow shoppers to see their savings clearly without calculations, while ‘percent-off’ coupons may require mental computation, which can deter some buyers.
That is the behavioral mechanism behind it. Shoppers do not consciously process every element of a search results page. They respond to signals. A green discount badge is a strong signal that something has changed about a price. It activates loss aversion and deal-seeking behavior that is largely automatic. The shopper clicks not because they compared the listing carefully but because the badge told them there was a deal to investigate. A survey revealed that many shoppers prefer seeing their total savings rather than just the final price after a discount, suggesting that familiarity with traditional coupon formats can impact how likely they are to convert.
For many sellers, that badge was doing a significant portion of the click-through lift on promoted or organic listings. It was not a supplement to a strong listing. For weaker listings, it was the primary conversion mechanism at the top of the funnel. The visibility and clarity of coupon displays can significantly affect click-through and conversion rates, as clearer pricing tends to facilitate faster shopper decision-making and helps more shoppers convert.
Let AI Optimize Your Shipping and Boost Profits
Cahoot.ai software selects the best shipping option for every order—saving you time and money automatically. No Human Required.
See AI in ActionWhen the Cue Weakens, the Work Shifts
When the percentage-off badge is replaced by final price presentation, the buying cue changes in a specific and consequential way.
A final product price requires a reference point to be meaningful. A shopper looking at a price of $27.49 does not know whether that is a good deal without knowing the regular price, what competitors charge, or what they expected to pay. The percentage-off badge eliminated that cognitive step. It said, in effect, this is cheaper than it usually is. That was legible in under a second.
Showing the final product price allows shoppers to understand the cost without performing mental math, making it easier to evaluate value. It is also important for shoppers to compare the final price to the recent lowest price to ensure they perceive value and to remain compliant with Amazon’s pricing policies.
A final price says, this is the price. That is not valueless information, but it requires more cognitive processing. The shopper has to compare, recall, or estimate. Shoppers who were converting on the badge alone, responding to the visual cue without deeper evaluation, now have to do more work. Some of them will not bother.
This is how marketplace surface changes reshape economics without changing a single fee structure. The shopper experience shifts, behavior changes, and the conversion math for many listings moves without a single policy document announcing it—even as Amazon FBA fees continue to increase and put additional pressure on margins.
Who Loses the Most When the Badge Fades
Not every seller is equally affected. The impact depends on what the listing was actually doing for itself before the badge was available.
Low-differentiation commodity products are most exposed. If two listings in a category are functionally identical, and one had a green badge driving click-through, that seller was winning on the cue rather than on the product. When both listings present at a final price with no badge cue, the decision logic shifts. Shoppers now evaluate more deliberately: images, reviews, review count, seller history, shipping speed, and listing copy all matter more. A commodity listing without strong fundamentals was already fragile. Losing the coupon cue makes that fragility visible.
Listings with weak imagery or thin copy were partially compensated by the badge. A product image that is not quite right for the category, a title that is functional but not compelling, a bullet point structure that is adequate but not strong: all of these weaknesses are more exposed when the conversion aid at the top of the funnel disappears. The shopper who clicked on the badge and converted despite a weak listing interior is now less likely to click at all.
New sellers and new ASINs building review velocity through coupon promotions will see less efficient use of that tactic. Strategic coupon setup and running coupons have been key for generating early traction, but this is now affected by new eligibility requirements. As of March 2024, products must have a sales history and a discount price lower than the Was Price to be eligible for a coupon. Amazon now requires a verified sales history, and the coupon price must be lower than the product’s recent lowest price to ensure authenticity. This means new ASINs cannot immediately leverage coupons for launch, impacting their ability to drive initial demand and review velocity—making pre-launch Amazon Vine reviews an increasingly important alternative for early social proof. When planning coupon setup and running coupons, sellers must also consider inventory, stock, and demand planning, as increased coupon visibility can drive higher demand and risk stockouts if inventory is not managed properly.
Established listings with strong reviews and differentiated positioning are the least affected. Their conversion drivers were never primarily the badge. Shoppers click on them because of social proof, brand recognition, or clear category positioning. The coupon badge was incremental upside for these listings, not load-bearing infrastructure.
The Misdiagnosis Problem
Here is where the operational risk compounds. Many sellers who see performance decline after this display change will not correctly identify the cause.
They will look at their advertising data first. They will see that CTR dropped and CPC stayed flat or increased, meaning they are spending the same amount to generate fewer clicks. The first instinct will be to adjust bids, change keywords, refresh ad creative, or restructure campaign structure. Some of that work may produce marginal improvement. None of it addresses the actual problem.
The actual problem is that the listing was relying on a marketplace-provided conversion cue that is no longer working the same way. The fix is not in ad management. It is in listing fundamentals: imagery, title, copy, reviews, and offer design. But sellers who are primarily optimizing ads will not see that. They will spend months chasing a performance problem with the wrong tool. Without a plan and the use of analytics tools, sellers risk flying blind—making decisions without the data-driven insights needed to adapt to changes in coupon display and performance.
This is a version of the broader pattern that applies whenever platforms change their surfaces. The change creates a new environment. Sellers who understand what the environment was doing for them can adapt. Sellers who did not understand the mechanism cannot diagnose the shift accurately—just as many misread the impact of Amazon’s “Frequently Returned Item” badge on shopper trust and listing performance.
ShipStation vs. Cahoot: 21x Faster, Real Results
Get the inside scoop on how a leading merchant switched from ShipStation to Cahoot—and what happened next. See it to believe it!
See the 21x DifferenceThe Contrarian View: The Badge Was a Crutch
It is worth saying explicitly what the badge enabled at scale. For many sellers, it subsidized weak listing quality. A product with mediocre imagery, ordinary copy, and a modest review count could punch above its weight in click-through by posting a visible discount. The badge was effectively doing positioning work that the listing itself was not doing.
In that sense, the change is not only a threat to sellers. It is a correction toward quality. Listings that earn clicks because they are genuinely differentiated and well-presented will now compete more effectively against listings that were winning on coupon-badge visibility alone. The Amazon marketplace has always had a stated preference for better customer experience and stronger product quality. A display environment that forces shoppers to evaluate more deliberately, and forces sellers to earn clicks on fundamentals, is directionally consistent with that. As surface-level promotional cues become less effective, optimizing for profit and maintaining healthy margins is increasingly important. Sellers must track and adjust their strategies to protect profitability as fee structures and coupon display changes impact both margins and overall profit, using pricing strategies that keep free shipping profitable as a model for balancing customer appeal with unit economics.
Sellers who have invested in strong content, clear value communication, and genuine product differentiation have less to fear from this change than the short-term performance data might initially suggest. Their click-through may dip slightly as the overall environment adjusts. But the relative competitive advantage of their fundamentals increases.
What Marketplace Surface Changes Mean at a Structural Level
The coupon display shift is one instance of a pattern that operators should expect to encounter repeatedly. Marketplaces do not only extract value from sellers through fee increases and policy changes. They also reshape the economics of selling through surface changes that alter how value is communicated, how decisions are made, and what capabilities produce results.
In this evolving landscape, marketing strategies—including the use of promos, deals, best deals, and lightning deals—are increasingly influenced by changes in Amazon’s fee model and performance metrics. Starting June 2, 2025, Amazon will introduce a performance-based coupon fee structure, replacing the previous flat fee of $0.60 per unit sold with a coupon. Under this new fee model, sellers will pay a flat fee plus a percentage of the total sales amount for coupon-discounted products, which can significantly impact profit margins, especially for higher-priced items—just as the holiday peak FBA order fulfillment fee did in prior years. This structure favors low-to-mid-priced items and high-volume coupon campaigns. Sellers can now also prevent coupon stacking, allowing them to better control promotional costs and optimize their promo strategies.
Sales performance is now a critical factor in determining the cost-effectiveness of coupons and deals. The effectiveness of marketing campaigns, including PPC (pay-per-click) advertising, is closely tied to how well coupons and promos are integrated. Optimizing PPC campaigns with targeted coupon offers can improve advertising efficiency, boost conversion rates, and support overall sales performance, just as thoughtful marketing strategies for making free shipping profitable can turn cost centers into acquisition levers.
The shift toward agentic commerce and AI-assisted purchasing is the most consequential version of this pattern on the horizon. When shopping agents filter, rank, and select products on behalf of consumers, the visual and emotional cues that badges and promotional signals provide become irrelevant. The product has to communicate value through structured data, reviews, pricing consistency, and fulfillment reliability, because there is no human attention span scanning a results page for a green badge or evaluating which order fulfillment model best meets fast-shipping expectations. The coupon display change is a small step in that same directional pressure.
Brands that are operationally dependent on a single platform’s interface choices are inherently exposed to these shifts. The coupon badge today, something else tomorrow. Each change recalibrates who benefits. Sellers with strong fundamentals across imagery, copy, reviews, pricing, and fulfillment—along with resilient fulfillment strategies like using Seller Fulfilled Prime to fight rising FBA fees—tend to benefit from changes that reduce the effectiveness of surface-level shortcuts. Sellers whose performance is built on those shortcuts tend to suffer.
Margin pressure from surface changes compounds the margin pressure that comes from rising shipping costs, carrier surcharge increases, and hidden Amazon FBA fees that many sellers overlook. The sellers who weather this environment are not the ones with the most aggressive promotional tactics. They are the ones with the tightest operational fundamentals, the cleanest cost structures, and the most durable product positioning.
Cut Costs with the Smartest Shipping On the Market
Guranteed Savings on EVERY shipment with Cahoot's AI-powered rate shopping and humanless label generation. Even for your complex orders.
Cut Costs TodayWhat to Do Now
The practical response to the coupon display change is not to abandon coupons. Coupons still affect price presentation in search results and still provide some conversion signal. The response is to stop treating the coupon badge as a substitute for listing quality. Instead, sellers should plan each campaign carefully, establish specific objectives—such as boosting sales or increasing brand awareness—and allocate a specific coupon budget to manage costs and maximize promotional impact.
Audit your highest-traffic ASINs for listing fundamentals. Are the main images hero-quality for the category, or are they functional but not compelling? Does the title communicate a clear positioning and include relevant keywords to maximize visibility, or is it a keyword string? Do the bullet points engage the target customer and address actual buying concerns, or do they describe features the customer was not asking about? Is the review count and rating where it needs to be relative to category competition?
For new ASINs, build the listing quality before leaning on promotional mechanics to drive initial velocity. Use keyword-rich titles, engaging bullet points, and high-quality images to maximize visibility and conversion rates for products with coupons. Coupons and early promotions can supplement momentum on a strong listing. They cannot generate durable traction on a weak one.
For established ASINs where performance declines after this change, resist the instinct to immediately adjust advertising. Audit the listing first. If the listing fundamentals are weak, fix those before spending more on ads to drive more traffic to an unconverted page. Additionally, track sales and units sold to evaluate the effectiveness of your coupon campaigns, and consider A/B testing coupon values to determine whether a dollar-off or percentage-based discount drives stronger conversions for your product. Leverage marketing channels such as social media, email marketing, and paid ads to generate more traffic and further boost sales.
Frequently Asked Questions
What is the Amazon coupon display change?
Amazon appears to be testing a change in how coupon savings are presented on product listings. Some listings are showing the final price more prominently instead of the green percentage-off badge that was previously common in search results. The change affects how visible discount cues are to shoppers scanning results.
Why does the coupon display change matter for sellers?
The green coupon badge was a visual conversion cue that triggered deal-seeking behavior before shoppers consciously evaluated a listing. When that cue is less visible, shoppers have to process more information to determine if a price represents value. Listings that relied on the badge to drive click-through may see weaker performance without changing anything about their advertising or pricing.
Does removing the badge cue hurt all Amazon sellers equally?
No. Sellers with strong listing fundamentals, including high-quality imagery, differentiated positioning, and strong review counts, are less affected because their conversions were not primarily driven by the badge. However, this change is particularly impactful for certain groups, especially those who relied heavily on the coupon badge for click-through—such as sellers with weaker listings or commodity products that used the badge as a primary click-through driver.
How should sellers respond to this change?
The priority is auditing listing fundamentals: imagery, title clarity, copy quality, and review strength. Sellers who improve these elements reduce their dependency on surface-level promotional cues. Adjusting advertising without improving listing quality is likely to produce diminishing returns.
Is this change permanent or a test?
Based on available reporting, this appears to be a test that Amazon is running on some listings and categories. The full scope and permanence of the change have not been announced. However, the directional trend of platforms moving toward final price presentation and reducing explicit promotional badges reflects broader commerce interface patterns, and sellers should prepare for this environment regardless of how the specific test resolves.
What does this mean for using Amazon coupons going forward?
Coupons remain a valid promo tool on Amazon and still affect pricing presentation in results. As one type of promo available to sellers, coupons should be integrated into a broader promotional strategy. The change affects how prominently the discount cue is displayed, not whether coupons work at all. The practical implication is that coupons should be viewed as one element of a complete listing strategy rather than as a standalone conversion mechanism.
Written By:
Rinaldi Juwono
Rinaldi Juwono leads content and SEO strategy at Cahoot, crafting data-driven insights that help ecommerce brands navigate logistics challenges. He works closely with the product, sales, and operations teams to translate Cahoot’s innovations into actionable strategies merchants can use to grow smarter and leaner.
Turn Returns Into New Revenue
Related Articles
How to Introduce P2P Returns Without Breaking CX
Introducing peer-to-peer returns without breaking customer experience is mostly a change-management and trust-design problem, not a technology problem.
Why P2P Requires a Different Mental Model
Introduction Most people misunderstand peer-to-peer returns for the same reason: they evaluate the system through warehouse-first assumptions.
When Warehouse Returns Still Make Sense
A serious returns strategy does not pretend one path fits every return.
Why P2P Returns Are Not “Recommerce”

In this article
16 minutes
- Introduction to P2P Returns
- Recommerce Usually Means Used Goods
- P2P Returns Preserve Like-New Inventory
- Think Fitting Room, Not Flea Market
- Logistics and Operations: How P2P Returns Work in Practice
- Why the Distinction Matters for Trust and Margin
- Environmental Benefits of P2P Returns
- P2P Can Coexist With Recommerce, But It Is Not Recommerce
- The Mental Model That Actually Fits
- Frequently Asked Questions
Peer-to-peer returns are a logistics model, not a resale channel. When people hear that a returned item goes from one customer directly to another, they often reach for the nearest familiar category and file it under recommerce. That instinct is understandable, but it is strategically wrong, and the distinction matters more than most ecommerce operators realize. In this context, recommerce refers specifically to the process of reselling pre-owned or surplus products, emphasizing its role in secondhand ecommerce and circular economy initiatives.
Recommerce is built around the idea of selling goods that have already moved into a secondary-market frame: used items, recovered inventory, refurbished stock. It comes into play after something has already been classified as a used good. Recommerce providers and recommerce platforms play a crucial role in facilitating these transactions for brands and consumers, managing resale logistics, refurbishment, and consumer engagement. The business model of recommerce is structured around resale and recovery, aligning sustainability and profitability within a company’s overall operations. Peer-to-peer returns, by contrast, are about preventing that classification from happening at all. A like-new item that skips the trip back to the warehouse is not recommerce. It is first-sale inventory that moved directly to its next owner before anyone had a chance to treat it like used goods.
The global recommerce market is valued at $100 billion, growing at a rate five times faster than the broader retail market, and is expected to represent 23% of all retail by 2030.
Make Returns Profitable, Yes!
Cut shipping and processing costs by 70% with our patented peer-to-peer returns solution. 4x faster than traditional returns.
See How It WorksIntroduction to P2P Returns
Peer-to-peer (P2P) returns are transforming the landscape of ecommerce returns by streamlining the way products move between customers. Traditionally, when a customer wanted to return an item, it would travel back to a central processing center or warehouse before being restocked or resold. This process often led to increased shipping costs, excess packaging waste, and a slower returns process that could frustrate customers.
With P2P returns, the process is reimagined: instead of sending the item back to the merchant, the returning customer ships it directly to the next buyer. This peer-to-peer approach not only accelerates the returns process but also significantly reduces the resources required for each transaction. Customers benefit from faster resolutions and improved customer satisfaction, while ecommerce businesses see a reduction in operational costs and packaging waste. By keeping products in circulation and out of the warehouse, P2P returns offer a more efficient and customer-centric solution to the challenges of ecommerce returns.
Recommerce Usually Means Used Goods
The word recommerce has a specific gravity. When operators hear it, they picture resale platforms, secondary-market channels, trade-in programs, and refurbished inventory. That mental picture is accurate for what recommerce actually is. The resale business, built on the resale business model, leverages resale platforms to facilitate the sale of pre-owned and used products, enabling the efficient movement of goods within the circular economy.
Recommerce typically describes situations where goods have already fallen into a different value category. The item has been owned, used, returned through traditional recovery channels, and then made available again through a resale structure. Pre-owned, pre-owned items, and used products are sourced and processed through trade-ins, trade-in credit, and store credit programs, allowing consumers to exchange their goods for value and supporting sustainable consumption. The business logic is about recovering value that has already degraded. Resale as a service and third-party platforms enable brands to participate in the resale industry by managing resale operations, while various resale models support both peer-to-peer and take-back programs. Reverse commerce is another term used to describe the resale or reuse of previously owned items, highlighting its connection to sustainable supply chain practices. That is a legitimate and growing category of commerce, but it is a downstream activity.
The mental image it produces matters. “Recommerce” conjures flea markets, liquidation lots, and thrift-store bins. It implies that the item’s best days as a sellable product are behind it, and that the challenge now is to extract what residual value remains. The growth of the resale industry is driven by individual consumers actively participating in these programs, as well as many retailers and many brands recognizing the importance of integrating recommerce and reverse logistics into their business strategies.
The culture of disposable fashion generates around 17 million tons of textile waste annually in the U.S., with only 14-15% of discarded items being recovered, emphasizing the need for sustainable practices like recommerce to mitigate waste. During the holiday season of 2023, the resale market is expected to contribute to the prevention of 32 billion pounds of waste from ending up in landfills, showcasing the environmental benefits of recommerce. Implementing resale initiatives could lead to a reduction of annual carbon emissions by approximately 15-16% by the year 2040, highlighting the long-term sustainability benefits of recommerce.
That framing is completely wrong for the scenario peer-to-peer returns actually describe. If you want to understand what peer-to-peer returns are at a foundational level, the core definition is worth reading before going further.
P2P Returns Preserve Like-New Inventory
Here is the scenario peer-to-peer returns actually describe.
A customer orders a pair of pants online. They try them on once. The fit is wrong. They initiate a return. Another new customer has already found that same item, wants it at an open-box discount, and is ready to buy. In a P2P model, the first customer ships the item directly to the second customer. The merchant’s warehouse is never involved.
That item never went through a recovery loop. It was not inspected, re-tagged, put in a bin, or processed through a reverse logistics facility. It is the same highly sellable product it was when it shipped the first time, and it has moved to a new customer who wanted it. Quality control is maintained by minimizing handling, helping preserve the like-new condition of the item.
That is not recommerce. There is no secondary market. No resale channel. No recovery logic. The item retained its like-new condition and moved to its next buyer while that condition was still intact.
Peer-to-peer returns can enhance customer satisfaction by providing a quicker and more efficient returns process, as customers receive refunds faster than traditional models. When combined with an exceptional returns program that builds customer loyalty, this speed and simplicity can become a powerful differentiator. Items returned through a P2P system can often find a new home in just a few days, leading to faster inventory turnover.
Convert Returns Into New Sales and Profits
Our peer-to-peer returns system instantly resells returned items—no warehouse processing, and get paid before you refund.
I'm Interested in Peer-to-Peer ReturnsThink Fitting Room, Not Flea Market
The fitting room analogy makes this concrete.
When someone tries on a shirt in a physical store and puts it back on the rack, no one treats that shirt as used merchandise. The item was tried on. It is back in circulation. It is still fully sellable. Retailers do not mark it down to clearance price and ship it to a liquidator because a customer touched it.
P2P Returns operate on the same logic. The item was tried on at home. The fit or the color was not right. Another buyer is willing to take it at an open-box discount and considers it like-new because, functionally, it is. The difference from a traditional return is that the item goes directly to that buyer instead of first going back to the warehouse to begin the traditional recovery process. This positive returns experience can foster repeat purchases, drive loyalty, and build customer loyalty by making the process seamless and trustworthy for customers.
Trade-in programs also effectively encourage customers to make repeat purchases, thereby increasing overall customer lifetime value, especially when they are designed as part of a broader ecommerce returns program that balances loyalty and costs.
Recommerce is the flea market at the end of that process, not the fitting room at the beginning of it.
What P2P returns protect is the item’s value before it enters any recovery system. A like-new returned item that gets dragged through the full warehouse loop will receive a markdown, a reprocessing cost, and a new classification as “used” or “open-box warehouse return” before it ever reaches its next buyer. P2P removes all of that friction by moving the item earlier in the chain, while the value is still fully intact. Additionally, P2P returns can reduce operational costs by eliminating the need for warehouse intake, inspection, and repackaging.
Logistics and Operations: How P2P Returns Work in Practice
The operational backbone of peer-to-peer returns relies on a sophisticated logistics process designed to maximize efficiency and minimize costs. When a customer initiates a return, the system first assesses the item’s condition and matches it with demand from other customers. If the item qualifies, a shipping label is automatically generated, directing the original customer to send the product straight to the next buyer—bypassing the traditional warehouse or processing center entirely.
This streamlined approach dramatically reduces reverse logistics costs, as items no longer need to be shipped back and forth between distribution centers. Logistics companies and technology providers play a pivotal role in enabling this process, offering the infrastructure and digital tools necessary to coordinate shipments, track inventory, and ensure a seamless customer experience, especially when they follow best practices for optimizing reverse logistics in ecommerce. By eliminating unnecessary steps in the reverse logistics process, P2P returns help ecommerce brands achieve greater operational efficiency and reduce the overall burden on their supply chain.
Why the Distinction Matters for Trust and Margin
Calling P2P returns recommerce is not just an imprecise label. It creates a real problem for how buyers perceive the item and how merchants price it.
When an item is framed inside a recommerce or resale mental model, buyers expect used-goods pricing and condition. They assume the item has passed through several hands and processes before reaching them. They discount the perceived value accordingly. Merchants who let their P2P offering drift into a recommerce frame are effectively giving away value they did not have to give away.
The economics of peer-to-peer returns depend on that value being preserved. The model works because a like-new item retains pricing power that a warehouse-processed open-box item does not. An item positioned as like-new and sold directly buyer-to-buyer commands a meaningfully different price than the same item that has been through a full returns processing cycle and relabeled as refurbished. Preserving this value leads to increased sales, higher profits, and more revenue generated for merchants, as digital recommerce platforms enable cost efficiencies and new income streams compared to traditional resale methods, especially in categories where ecommerce return rates can erode profit margins.
Merchants who mislabel P2P as recommerce also muddy the internal business case. The value proposition of P2P is that it skips the warehouse loop and keeps highly sellable inventory from being treated like recovered stock. P2P returns help reduce costs and avoid storage fees associated with traditional returns, further improving profit margins. In fact, P2P returns can cut return logistics costs by up to 60%, and cost reduction strategies can lower return-related losses from an average of $37 down to $15 per $100 item, which is especially important as many retailers struggle with the rise of ecommerce return rates. Ecommerce brands can also cut shipping and processing costs by up to 70% by implementing peer-to-peer returns, transforming a significant cost center into a revenue growth driver.
The label is not cosmetic. It shapes how the program is priced, positioned, and measured.
No More Return Waste
Help the planet and your profits—our award-winning returns tech reduces landfill waste and recycles value. Real savings, No greenwashing!
Learn About Sustainable ReturnsEnvironmental Benefits of P2P Returns
Beyond operational gains, peer-to-peer returns deliver substantial environmental benefits. By keeping products in active circulation and reducing the need for new manufacturing, P2P returns help cut down on packaging waste and lower carbon emissions associated with shipping and processing. This model is especially impactful for fashion retailers, who face mounting pressure to address the environmental impact of excess inventory and return waste and to implement eco-friendly returns practices that align with consumer expectations.
Encouraging customers to participate in P2P returns supports sustainable consumption habits, as it extends the lifecycle of products and reduces the demand for new goods. As more ecommerce brands and recommerce models adopt these practices, the industry moves closer to a circular economy—one where resources are used more efficiently and waste is minimized, mirroring broader shifts like the evolution of thrifting and mainstream secondhand shopping. For customers and businesses alike, P2P returns represent a practical step toward reducing environmental impact while maintaining high standards of service and satisfaction.
P2P Can Coexist With Recommerce, But It Is Not Recommerce
None of this means recommerce is irrelevant or that the two approaches are in conflict. A well-designed returns strategy often includes multiple paths for returned inventory, and a robust recommerce channel, built on a recommerce business model, is integrated into overall company strategy to maximize value recovery and sustainability.
Items that are not P2P-eligible, whether because of condition, category, or timing, may eventually find their way into recommerce or liquidation channels. That is appropriate. P2P handles the high-value portion of the return flow. Traditional downstream channels, often involving a distribution center and a logistics provider for inspection, restocking, or disposal, handle the rest, sometimes supported by a returns management solution like ZigZag or a platform such as Return Prime that focuses on the digital side of processing. For a full picture of where P2P fits and where it does not, where peer-to-peer returns don’t work is worth reviewing.
Approximately 30 to 60 percent of returns across most ecommerce operations are viable candidates for peer-to-peer routing or recommerce, depending on SKU mix, return reasons, and product categories.
But the point is that they serve different purposes at different points in the value chain. P2P comes first. It captures value before the item loses its like-new standing. Recommerce comes later and works with inventory that has already moved into a different category, allowing brands to participate directly in both P2P and recommerce processes for greater lifecycle management and sustainability.
These two approaches can coexist without being the same thing. They are not interchangeable.
Traditional Returns Are Ending
Ecommerce built a returns system for a smaller internet. Today it’s collapsing under scale. Warehouses can’t absorb the volume, costs keep rising, and retailers are quietly tightening policies. This article explains why the old model is failing and what replaces it.
Read the Returns BibleThe Mental Model That Actually Fits
P2P Returns are a logistics architecture, not a resale program. In the context of an ecommerce business, this architecture leverages advanced returns management systems and the expertise of a service provider to facilitate efficient, direct item transfers between customers. The defining feature is not that a second buyer gets the item. It is that the item moves directly to that buyer while still in highly sellable condition, before the warehouse handling and recovery processing that would otherwise erode its value and perception. Integrating resale software with existing systems, such as ERP, further streamlines these operations and enhances scalability.
A customer who receives a like-new item with no visible wear, shipped directly from the original buyer, has not purchased a used good in the way recommerce implies. They have purchased an item that was tried once and redirected before anyone processed it as a return. Throughout this process, the merchandise sold is carefully tracked and subjected to quality control measures to ensure a seamless experience and maintain high standards, much like store-based options such as Happy Returns’ drop-off reverse logistics model aim to simplify the customer experience.
Directly shipping the item reduces transit time and lowers carbon emissions, enhancing sustainability. The peer-to-peer returns model minimizes the environmental impact associated with traditional ecommerce returns by reducing the number of shipments and packaging waste. Waste reduction is a key benefit of the P2P model, supporting broader sustainability and circular economy goals.
That is a fundamentally different kind of transaction. It belongs in a fundamentally different mental category.
The moment you call it recommerce, you invite the wrong assumptions: used condition, depreciated value, secondary-market frame. Those assumptions are wrong, and they cost real margin when they shape how the program is built and communicated.
Frequently Asked Questions
What is the difference between peer-to-peer returns and recommerce?
Recommerce involves selling goods that have already moved into a secondary market or recovery channel, typically used, refurbished, or post-disposition inventory. Peer-to-peer returns involve like-new or open-box items that go directly from the returning customer to the next buyer without first going back to the merchant’s warehouse. The two approaches operate at different points in the value chain and serve different purposes.
Does calling P2P returns recommerce actually matter?
Yes. The label shapes buyer expectations, pricing logic, and how the business case is framed internally. When P2P is positioned as recommerce, buyers assume used-goods conditions and pricing, and merchants understate the value of the logistics model. The distinction directly affects margin and trust.
Are P2P returns the same as resale?
No. Resale and recommerce typically describe the sale of goods after they have been used, owned, or recovered. P2P returns describe a logistics model where a like-new returned item moves directly to the next customer instead of entering the traditional return processing loop. The item retains its like-new condition and value because it never went through warehouse recovery.
Can a brand use both peer-to-peer returns and recommerce?
Yes. The two approaches can coexist in a broader returns strategy. P2P returns handle the portion of return volume where items are still in highly sellable condition. Recommerce or other downstream recovery channels handle inventory that does not meet P2P eligibility criteria. They are complementary, not identical.
Is an open-box item sold through P2P considered a used good?
Not in the way recommerce implies. An item that was tried on once and shipped directly to the next buyer has not been through the handling, inspection, and reprocessing steps that typically define used or refurbished goods in a resale context. It is better understood as like-new inventory that moved to its next owner before the traditional return loop could degrade its value.
Where can I learn more about how peer-to-peer returns work in practice?
A detailed breakdown of how peer-to-peer returns actually work covers the operational mechanics step by step. For the financial case, the economics of peer-to-peer returns explains why skipping the warehouse preserves value and removes cost layers.
Written By:
Manish Chowdhary
Manish Chowdhary is the founder and CEO of Cahoot, the most comprehensive post-purchase suite for ecommerce brands. A serial entrepreneur and industry thought leader, Manish has decades of experience building technologies that simplify ecommerce logistics—from order fulfillment to returns. His insights help brands stay ahead of market shifts and operational challenges.
Turn Returns Into New Revenue
Related Articles
How to Introduce P2P Returns Without Breaking CX
Introducing peer-to-peer returns without breaking customer experience is mostly a change-management and trust-design problem, not a technology problem.
Why P2P Requires a Different Mental Model
Introduction Most people misunderstand peer-to-peer returns for the same reason: they evaluate the system through warehouse-first assumptions.
When Warehouse Returns Still Make Sense
A serious returns strategy does not pretend one path fits every return.
What Regional Parcel Carriers Mean for Ecommerce Shipping Strategy
Regional and emerging parcel carriers are expanding their geographic coverage and becoming viable alternatives in more parts of the United States. Regional parcel carriers typically cover specific cities or regions, allowing them to offer faster delivery services, often within 1-2 days, compared to national carriers. In fact, regional parcel carriers cover more than 85% of the U.S. population and typically focus on short-haul deliveries, which allows them to offer faster and more affordable shipping options. LaserShip, OnTrac, Spee-Dee Delivery, and LSO are major regional parcel carriers in the U.S., often offering faster 1–3 day delivery and 20%–40% lower rates than national carriers. Courier Express and a growing list of regionally specialized carriers now reach a meaningful share of the U.S. population in their coverage zones, and several are pushing into markets they did not serve two years ago. Regional parcel carriers can save e-commerce brands between 10% to 40% in shipping costs compared to major carriers like UPS and FedEx, especially for local deliveries. The traditional assumption that ecommerce shipping meant a binary choice between UPS and FedEx, with USPS as a lower-cost fallback, no longer reflects the actual carrier market or parcel delivery landscape.
That is the news. Here is what it does not mean by itself.
More carrier options do not automatically reduce shipping costs. More carrier options do not automatically improve delivery performance. More carrier options increase the value of operational systems that can make better decisions in real time, and they expose the operational gaps of brands that cannot.
The Orchestration Gap
The framing that regional carriers are simply cheaper is too shallow to be useful. Sometimes they are. A regional carrier serving the Northeast at a lower base rate than UPS Ground, with fewer residential surcharges and faster transit to major population centers in that zone, can materially reduce shipping cost per order for a brand with significant order volume in that geography. That benefit is real and documented.
But the framing collapses immediately when the conditions shift. A regional carrier covering the Southeast does not help a brand fulfilling from a West Coast warehouse. A carrier with competitive rates but inconsistent tracking updates creates downstream customer service problems that erode the savings, and mishandled exceptions can compound issues like delays and failed deliveries—making it critical to understand carrier shipment exceptions and how to fix them fast. A regional contract that offers better pricing per label means nothing if the decision logic selecting which carrier to use on each order still defaults to a national carrier because no one updated the routing rules.
The core issue is not whether regional carriers are good. The core issue is whether a brand’s operational infrastructure can exploit carrier optionality in real time, at the order level, across the full mix of package weights, delivery zones, fulfillment locations, and customer promise commitments. To do this effectively, brands must analyze shipping data to determine optimal carrier selection and identify cost-saving opportunities. Additionally, brands should negotiate shipping rates with both regional and national carriers, leveraging their shipping data to request custom pricing tailored to their unique shipping profiles. That is an orchestration problem. It has always been an orchestration problem. More carrier options make it a more consequential one.
Let AI Optimize Your Shipping and Boost Profits
Cahoot.ai software selects the best shipping option for every order—saving you time and money automatically. No Human Required.
See AI in ActionWhat Actually Changes When Regional Carriers Expand
The expansion of regional carrier coverage changes the menu. It does not change the kitchen.
When LaserShip and OnTrac merged to form the combined OnTrac network and pushed coverage toward broader national reach, they created a situation where a brand with orders concentrated in specific metropolitan markets had a legitimate third option with competitive economics in those zones. That is a real development. The question is what a brand has to do operationally to capture the benefit.
To benefit from a regional carrier in a specific zone, a brand needs:
- Shipping software that evaluates multiple carrier rates per order in real time and selects based on defined criteria rather than defaulting to a primary carrier
- Leveraging a multi-carrier network to compare rates and optimize carrier selection for each shipment
- Inventory positioned close enough to the delivery zone—often in strategically placed fulfillment centers—so the regional carrier’s local strength is actually accessible
- Package configurations that do not trigger dimensional weight penalties or size-based surcharges that erode the per-label savings
- Delivery promise logic at checkout that reflects the regional carrier’s actual transit performance to specific zip codes, not a generic estimate
When selecting a regional carrier, it’s important to analyze your shipping data to determine where the majority of your customers are located, as this can influence which carrier will be the most effective for your needs.
A brand that adds a regional carrier contract but ships from a single warehouse located outside the carrier’s core service zone, uses oversized packaging that triggers surcharges, routes orders through manual or rule-based logic that does not evaluate the new carrier in real time, and displays delivery estimates that are not connected to actual carrier performance data has not improved their shipping operation. They have added administrative complexity without capturing the economic benefit. Additionally, using shipping software to evaluate rates across a multi-carrier network can help identify opportunities for bulk shipping discounts, especially when shipping volume is concentrated in certain regions.
This is the pattern that repeats when brands respond to carrier market changes without addressing the underlying operational gaps. The answer to why shipping costs keep increasing is not primarily found in carrier selection. It is found in the decisions that determine how effectively any carrier relationship is used.
ShipStation vs. Cahoot: 21x Faster, Real Results
Get the inside scoop on how a leading merchant switched from ShipStation to Cahoot—and what happened next. See it to believe it!
See the 21x DifferenceFour Ways Brands Fail to Benefit from More Carrier Options
Choosing the Wrong Carrier Because Decisions Are Manual
Manual carrier selection at the order level does not scale, and it does not select optimally even when it is attempted. An operations team reviewing individual orders and choosing carriers based on rough familiarity with rate sheets or general rules of thumb will not accurately capture the rate advantage that a regional carrier offers on a specific order to a specific zip code from a specific fulfillment location on a specific day.
Real-time ecommerce shipping software for warehouse automation evaluates the actual cost of each available carrier for each specific order at the moment the label needs to be generated. It accounts for the package weight, the destination zone, the service level required, delivery speed requirements, and any carrier-specific surcharge profiles that apply to that shipment. Understanding delivery speed requirements can help businesses negotiate better shipping rates tailored to their needs. Additionally, these platforms allow users to compare rates and print shipping labels seamlessly as part of an efficient multi-carrier shipping process. Manual decisions cannot replicate this at volume. The result is that brands with manual carrier selection leave money on the table even when they have access to the right carrier at the right price.
Shipping from the Wrong Node and Losing the Savings
A regional carrier’s advantage is geographic specificity. They typically provide faster transit and lower costs within their core coverage zone, specializing in short-haul deliveries—usually up to 500 miles—which allows them to offer more responsive and cost-effective services. Regional parcel carriers typically cover more than 85% of the U.S. population by focusing on these short-haul routes.
A brand with a single warehouse on the West Coast and a regional carrier contract for the Southeast cannot benefit from that regional carrier on orders shipping from their only fulfillment location. The package is still crossing the country before it enters the regional carrier’s service area, if it enters it at all. The zone-based shipping cost from the West Coast to the Southeast is the cost the brand absorbs regardless of which carrier picks up the package at origin.
Inventory positioning is a prerequisite for carrier optionality. A distributed inventory model, where stock is held in multiple fulfillment nodes positioned closer to customer populations, enables regional parcel carriers to efficiently serve specific areas and is the operational foundation that allows a brand to route orders from the node nearest the destination and hand off to the carrier with the best economics in that zone. Without distributed inventory, carrier optionality is limited to the geographic reality of wherever inventory happens to be sitting. The relationship between inventory placement and shipping cost is addressed in more depth when looking at why shipping prices are so high and the role that national fulfillment services and network architecture play in total parcel cost.
Using the Wrong Package and Triggering Avoidable Cost
Dimensional weight pricing applies across virtually all parcel carriers, national and regional alike. A package that is oversized relative to its actual product weight is billed at the higher dimensional weight, eroding per-label savings regardless of which carrier is used—a risk that has grown as UPS matches FedEx with dimensional weight changes that increase billable weight for many shipments.
Brands that add regional carrier relationships without also addressing their packaging discipline do not capture the full benefit. A regional carrier that charges less per pound or per zone than a national carrier still charges based on the billable weight of the package. If the package is poorly fitted to the product, the billable weight is higher than necessary, and the savings narrow or disappear.
Packaging optimization, meaning the systematic matching of package dimensions to product dimensions to minimize dimensional weight on each order, is a cost-reduction lever that applies across the entire carrier mix. It is not a regional carrier strategy. Many regional parcel carriers also offer less-than-truckload options, which can be a cost-effective alternative for smaller shipments, helping to optimize shipping costs and transit times. It is an underlying operational discipline that determines how much of any carrier’s rate advantage actually flows to the brand’s margin. The connection between packaging decisions and total shipping cost is one of several factors explored in the context of major carrier peak shipping surcharges and ecommerce margins.
Offering Weak Delivery Promises Because Systems Are Not Integrated
Delivery promise accuracy, the precision between what a customer sees at checkout and when the package actually arrives, is increasingly a conversion driver. Meeting customer expectations for fast, flexible, and affordable delivery is a key factor in choosing a shipping strategy, especially when offering expedited shipping options for faster delivery. Brands that display delivery windows grounded in actual carrier performance data from actual fulfillment locations convert better and receive fewer post-purchase complaints than brands displaying generic estimates.
Adding a regional carrier without integrating its actual transit data into the checkout promise logic creates a specific failure mode. The brand has access to a carrier that might deliver faster in certain zones, but the checkout page is still showing the same delivery estimate it always has, because nothing in the customer-facing system knows that the regional carrier is being used or what its performance looks like in the destination zip code.
Comprehensive shipping solutions, such as those provided by third-party logistics companies, can help brands integrate regional carrier data and improve delivery promise accuracy. Small businesses often find it easier to reach a live representative for tailored support with regional carriers, and using regional parcel carriers can offer small businesses significant competitive advantages in cost, speed, and service quality—especially when paired with third-party logistics services for small businesses.
This is where the operational investment required to capture regional carrier benefits becomes apparent. Rate shopping software handles the carrier selection decision. Delivery promise software handles the customer-facing communication. Inventory positioning software handles node selection. These systems need to work together, and they need to incorporate the regional carrier’s actual data, for the brand to fully exploit the opportunity.
The Contrarian View: More Carrier Options Can Make Operations Worse
The conventional read on regional carrier expansion is that more competition in the carrier market is good for shippers. More options, more pricing pressure, lower costs. That framing is accurate at the market level. It is not always accurate at the brand level.
For a brand with already-stretched operations, adding a regional carrier relationship means adding a new vendor relationship, new rate negotiation requirements, a new claims process for damaged or lost packages, new tracking integration requirements, and new rules that need to be configured in their shipping software. If that software is not capable of evaluating the new carrier correctly, or if the team does not have the operational capacity to configure and maintain the additional complexity, the regional carrier adds overhead without adding savings.
Leveraging a multi-carrier network allows brands to optimize deliveries by comparing rates, negotiating better terms, and accessing value-added services such as white-glove delivery or heavy item handling. This interconnected approach helps reduce transit times, lower costs, and improve shipping efficiency while meeting specific customer needs.
More carrier options increase the operational return on having well-integrated shipping software and clear routing logic. They do not create those things on their own. The brands best positioned to benefit from regional carrier expansion are the ones that already have multi-carrier shipping infrastructure in place and can add a new carrier as a routing option with minimal integration friction. Brands that are still managing carrier decisions manually or through a fragile rule set will struggle to extract value from additional optionality.
This is also where the emerging reality of agentic commerce becomes relevant. As shipping decisions become more automated and real-time, the ability to incorporate a regional carrier as a viable selection option depends on having software that makes those decisions intelligently, not on having contracted with the carrier.
Cut Costs with the Smartest Shipping On the Market
Guranteed Savings on EVERY shipment with Cahoot's AI-powered rate shopping and humanless label generation. Even for your complex orders.
Cut Costs TodayWhat Brands Should Actually Do
The practical response to regional carrier expansion is not to sign contracts with every regional carrier that now reaches the markets where a brand has customer density. The response is to build the operational infrastructure that makes carrier optionality valuable and unlocks significant benefits, such as improvements in cost, flexibility, and delivery performance through a hybrid shipping approach.
That starts with an honest assessment of the current state. How are carrier decisions being made today? Is rate shopping happening at the order level or at the contract level? Is inventory positioned in a way that allows regional carriers to be used in the zones where they have an advantage? Are package configurations optimized to avoid unnecessary dimensional weight on any carrier?
For brands where the answers to those questions reveal gaps, the priority is closing the gaps before adding carriers. Multi-carrier shipping software that evaluates rates in real time, routing logic that incorporates node selection and promise accuracy, and packaging standards that minimize billable weight are the foundation. Modern order fulfillment services for ecommerce companies can provide this infrastructure at scale. Regional carrier contracts add value on top of that foundation. They do not substitute for it.
For brands that already have that infrastructure in place, regional carrier expansion is a genuine opportunity. New coverage areas, improved transit times in specific zones, and pricing that competes with national carriers in dense markets are real benefits for brands positioned to capture them. Regional parcel carriers can provide cost savings for ecommerce brands, especially for high-volume shippers who don’t qualify for enterprise discounts with national carriers. Additionally, regional carriers often provide customized shipping options and additional services, such as white-glove delivery, which can enhance the customer experience and help meet customer expectations.
Frequently Asked Questions
Are regional parcel carriers cheaper than UPS or FedEx?
Sometimes. Regional carriers can offer lower base rates and fewer residential surcharges in their core coverage zones. In fact, regional parcel carriers can save e-commerce brands between 10% to 40% in shipping costs compared to major carriers like UPS and FedEx, largely due to their lower operating costs and focus on regional contracts. These regional contracts enable tailored coverage and cost efficiencies for specific areas. However, the savings depend on fulfillment location, package dimensions, and order destination. A regional carrier operating outside a brand’s geographic coverage area or used without optimized routing logic may not produce savings at all.
What is the difference between regional and national parcel carriers?
National carriers like UPS and FedEx provide coverage across the entire United States and internationally, with standardized service levels and pricing. Regional carriers specialize in specific geographic areas, often offering faster transit times and competitive pricing within their service zones but without national reach.
How does inventory positioning affect whether regional carriers are useful?
A regional carrier’s advantage is geographic. If a brand’s inventory is held in a warehouse located outside the carrier’s service zone, orders still have to travel to reach that zone before the regional carrier’s advantages apply. Strategically placed fulfillment centers enable distributed inventory, allowing products to be stored closer to customer populations. This distributed inventory model makes regional parcel carriers more useful by ensuring that orders can be routed directly from nearby fulfillment centers, maximizing delivery speed and cost savings.
What is multi-carrier rate shopping and why does it matter for regional carriers?
Multi-carrier rate shopping software evaluates the cost of each available carrier for each specific order in real time, selecting the best option based on delivery zone, service level, package weight, and current carrier pricing. By leveraging a multi-carrier network, brands can compare rates and optimize carrier selection for each order, ensuring that regional carrier options are considered alongside national carriers. Without this capability, regional carrier options may be ignored in favor of a default national carrier, leaving savings uncaptured even when a better option exists.
Can a brand benefit from regional carriers without changing their shipping software?
Rarely at scale. Manually selecting regional carriers for specific orders is not operationally practical at volume and does not make accurate per-order routing decisions. The full benefit of regional carrier optionality is realized through shipping software that evaluates all available carriers automatically on each order and enables seamless printing of shipping labels for both regional and national carriers.
Is adding more carrier options always a good idea?
Not automatically. Adding carriers increases operational complexity, vendor management requirements, and integration overhead. To ensure this strategy is beneficial, brands should add more carrier options in a cost-effective manner—leveraging regional parcel carriers and multi-node fulfillment to reduce costs. Regional parcel carriers can provide a cost-effective shipping option and help achieve lower shipping costs, especially when targeting specific geographic areas. The return on carrier optionality scales with the quality of the operational infrastructure that uses it.
Written By:
Rinaldi Juwono
Rinaldi Juwono leads content and SEO strategy at Cahoot, crafting data-driven insights that help ecommerce brands navigate logistics challenges. He works closely with the product, sales, and operations teams to translate Cahoot’s innovations into actionable strategies merchants can use to grow smarter and leaner.
Turn Returns Into New Revenue
Related Articles
How to Introduce P2P Returns Without Breaking CX
Introducing peer-to-peer returns without breaking customer experience is mostly a change-management and trust-design problem, not a technology problem.
Why P2P Requires a Different Mental Model
Introduction Most people misunderstand peer-to-peer returns for the same reason: they evaluate the system through warehouse-first assumptions.
When Warehouse Returns Still Make Sense
A serious returns strategy does not pretend one path fits every return.
Why Returns Became a Silent Margin Killer

In this article
18 minutes
- Introduction to Returns Management
- Returns Rarely Hit the P&L in One Place
- Shipping Is Only the Visible Part of the Reverse Logistics Damage
- The Returns Management Process
- The Real Margin Erosion in the Returns Management Process Spreads Across Teams
- Delay Turns a Return Into a Bigger Loss for Customer Satisfaction Than It First Appears
- What Makes Returns "Silent" Is What Makes Them Dangerous
- The Importance of Technology in Returns Management
- Brands Don't Just Have a Returns Problem — They Have a Visibility Problem Around Returns Data Loss
- Benefits of Effective Returns Management
- Frequently Asked Questions
In today’s retail landscape, returns management quietly drains more margin than most ecommerce businesses realize — not because any single return is catastrophic, but because the losses fragment across teams, time horizons, and cost categories before anyone adds them up. The problem is not only that returns are expensive. It is that no one sees the whole bill at once.
Most brands feel the damage without modeling it as one problem. A return creates a shipping cost that ops can see, a labor cost that the warehouse absorbs, a markdown that merchandising owns, a service ticket that CX handles, and a wasted acquisition spend that marketing never connects back to the original order. By the time all of those losses have settled, they are sitting in five different budgets, reported to five different teams, and none of them are reading the same P&L line.
That distributed damage is exactly what makes returns a silent margin killer.
Introduction to Returns Management
Returns management is a foundational pillar of any successful e-commerce business, directly impacting customer satisfaction, operational efficiency, and long-term customer loyalty. In today’s competitive landscape, the ability to handle customer returns smoothly is not just a cost of doing business—it’s a strategic opportunity. The returns management process encompasses everything from the moment a customer initiates a return request to the final resolution, whether that means restocking, exchanging, or refunding the item.
Implementing returns management best practices is essential for maintaining customer satisfaction and building trust. A well-designed returns process reassures customers that their post-purchase experience will be hassle-free, which in turn fosters repeat business and strengthens brand loyalty. Moreover, efficient returns management helps reduce operational costs by streamlining workflows and minimizing unnecessary touchpoints. For e-commerce businesses, mastering the art of managing returns and building an exceptional returns program that drives customer loyalty can transform a potential pain point into a competitive advantage, ensuring that customer returns are handled with care and efficiency while supporting overall business growth.
Make Returns Profitable, Yes!
Cut shipping and processing costs by 70% with our patented peer-to-peer returns solution. 4x faster than traditional returns.
See How It WorksReturns Rarely Hit the P&L in One Place
The common assumption is that a return creates one expense: the shipping label. That number is visible, trackable, and easy to report. It is also the smallest part of the problem.
When a returned item moves back through the system, it accumulates cost at every step. Transport in both directions. Intake labor. Inspection time. Repackaging materials. Delayed resale. Markdown pressure as the item sits unsellable. And in some cases, a total write-off if resale conditions have passed. These costs do not appear together on a single line. They land in separate departments, often in separate reporting periods, which is why the aggregate damage is almost always undercounted. As a result, the true financial impact of returns is frequently underestimated or overlooked, making it difficult for businesses to fully understand how returns affect profitability and cash flow.
Here is what that looks like in practice. A mid-sized apparel brand receives a returned jacket. The ops team logs the inbound label cost and the intake labor. That shows up in fulfillment. Three weeks later, the item gets marked down 25 percent because the selling window for that style has narrowed. That shows up in merchandising. The customer who returned it contacted support twice during the process. That shows up in CX. The paid social spend that drove the original purchase is never recovered. That sits in marketing. Four departments absorbed real losses from one return, and none of their reports reference each other. From the outside, returns looked manageable. From the inside, four teams quietly ate the damage.
This is not a rounding error. It is a structural visibility failure.
A finance team that reviews its returns line and sees only label costs is looking at the most visible fraction of the actual loss. The deeper damage — labor burden, markdown drag, wasted customer acquisition spend, inventory distortion — sits elsewhere in the business, categorized as something other than a returns problem. It is often treated as an operational variance, a cost-of-goods adjustment, or simply absorbed into overhead.
When losses are miscategorized, ownership is blurred. And when ownership is blurred, the business underreacts — not because the losses are small, but because no one is accountable for the full number.
Shipping Is Only the Visible Part of the Reverse Logistics Damage
Return labels get noticed because they are immediate and attributable. The label cost, along with return shipping expenses, hits the account right away. These costs are concrete and easy to dispute with a carrier.
The rest of the cost stack does not work that way.
Industry analysis puts the full average cost per return at roughly $40 once handling, repackaging, and secondary costs are included. Because ecommerce return rates directly affect profit margins, return cost as a share of sale price typically runs between 17 and 30 percent depending on category. That is before markdowns, fraud exposure, or wasted acquisition spend.
Consider a basic apparel example. A $59.99 item that ships back generates a visible label cost. But the same return also triggers intake labor, inspection time, potential repackaging, delayed inventory availability, and markdown pressure if resale is slow. If the item arrives after the peak selling window for that style, it may be resold at 30 percent off — still generating a loss even when it moves successfully. If customer acquisition cost is layered in, the original sale that was supposed to build a relationship has now become a net drain, underscoring why brands need to optimize reverse logistics across the entire return flow.
For a detailed breakdown of how those losses stack across a single return, the hidden economics of a $100 return makes the full cost model explicit. The purpose here is narrower: to recognize that label cost is the entry point of the damage, not the end of it.
Automation and technology can help businesses efficiently generate return labels as part of the returns process, streamlining reverse logistics and reducing manual workload, especially when supported by dedicated returns management software that automates key workflows.
Convert Returns Into New Sales and Profits
Our peer-to-peer returns system instantly resells returned items—no warehouse processing, and get paid before you refund.
I'm Interested in Peer-to-Peer ReturnsThe Returns Management Process
The returns management process begins the moment a customer initiates a return request, whether through an online portal or at a physical store. This process typically involves several critical steps: return merchandise authorization (RMA), product transportation, inspection and processing, customer resolution, and finally, restocking or responsible disposal of the returned item. Each stage of the returns process must be carefully managed to ensure operational efficiency and maintain high levels of customer satisfaction.
A seamless returns management process relies on clear communication and timely updates, keeping customers informed about the status of their return and expected resolution. Leveraging returns management software can automate many of these steps, from generating return labels to tracking return status and processing refunds. Selecting the best returns management software for your business ensures these workflows are tightly integrated with inventory and customer systems. This not only reduces manual errors but also enhances the overall customer experience by providing transparency and speed. Ultimately, a well-orchestrated returns management process ensures that both you and your customers benefit from a smooth, efficient, and satisfactory resolution to every return.
The Real Margin Erosion in the Returns Management Process Spreads Across Teams
One of the clearest ways to understand why returns stay under-owned is to map how a single return — often beginning with a return request — touches multiple functions, each of which experiences only its local version of the problem.
Operations sees the warehouse labor burden and the intake congestion. During high-return periods, inbound volume creates queue pressure, slows throughput, and pulls labor from other tasks. From an ops perspective, returns look like a staffing and throughput challenge.
Finance sees margin erosion in the aggregate but often without clear causal attribution. If returns are not modeled as a standalone cost center, the losses blend into COGS, warehouse overhead, or fulfillment variances. The erosion is real, but the source is not always legible.
Merchandising sees markdown pressure. When returned inventory sits in processing queues and misses its resale window, the only way to move it is through discounting. That discount pressure is treated as a merchandising decision, not a returns cost, even though the return caused it.
Marketing sees customer acquisition spend that never pays out. If a customer acquires through a paid channel, places an order, and returns it, the CAC for that customer is unrecoverable. The marketing team reports normal acquisition costs. The connection between that spend and the returned order is rarely drawn.
Customer service sees ticket volume, refund friction, customer complaints, and repeat contacts from customers waiting on resolutions. Each ticket has a handling cost, and high-return periods can quietly overwhelm CX capacity in ways that are attributed to service demand rather than returns policy. Proactive customer communication throughout the returns process is essential to manage expectations and reduce complaints.
Fraud and loss prevention sees leakage from wardrobing, item swapping, repeat abusers, return fraud, and fraudulent returns — exposure that grows with return volume and handoff complexity. Detecting and preventing returns fraud and refund fraud as a silent profit killer is critical to protecting revenue and minimizing losses.
No function sees the whole picture. Each team reacts locally. The business as a whole underreacts to a problem that is larger than any one team’s version of it.
Delay Turns a Return Into a Bigger Loss for Customer Satisfaction Than It First Appears
A return does not look catastrophic on day one. A label is generated, a refund is issued, and the item is on its way back. The immediate financial hit is visible and bounded.
What happens next is where the damage expands.
The returned items reach the warehouse and enter an intake queue. Inspection of these returned items takes time. Repackaging takes more. By the time the returned items are back in sellable condition and listed for resale, days or weeks have passed. If the item is seasonal — a holiday gift category, a summer apparel line, a trending style — that delay is not neutral. Every day in processing is a day of resale opportunity lost, and delayed refunds during this period can lead to customer dissatisfaction and lost future sales.
When the item finally becomes available again, it may require a markdown to move. That markdown is not a one-time reset — it pulls down the average selling price for the category and contributes to the inventory distortion that merchandising teams are managing separately from any returns context.
Time destroys value in ways that do not show up immediately on the return record. The markdown that happens three weeks after a return is rarely connected back to that return in most reporting systems. The inventory distortion it causes is absorbed as an operational reality. The write-off that eventually results — if resale never happens — lands in a different period entirely.
This delayed damage is part of why returns look manageable in the moment and only reveal their full cost later. It also helps explain why returns look manageable until they suddenly aren’t — a dynamic worth understanding if you’re thinking about what happens as return volume compounds over time. An efficient exchange process, as an alternative to refunds, can help mitigate these losses by converting returns into repeat sales and improving the overall customer experience, especially when it is part of a thoughtfully crafted e-commerce returns program that balances cost and loyalty.
No More Return Waste
Help the planet and your profits—our award-winning returns tech reduces landfill waste and recycles value. Real savings, No greenwashing!
Learn About Sustainable ReturnsWhat Makes Returns “Silent” Is What Makes Them Dangerous
The reason returns stay under-managed is not that brands do not care about the cost. It is that the cost never appears in one place at one time in a form that demands a unified response.
Each function sees a moderate, manageable version of the problem. Ops handles its labor burden. Finance notes the erosion. Merchandising takes the markdown. Marketing absorbs the CAC loss. CX works through the tickets. None of those signals is large enough, in isolation, to force a business-wide reckoning.
That fragmentation is not accidental. It is an emergent property of how returns move through the system. Every handoff creates a new cost center. Every delay pushes a loss into a future period. Every functional boundary turns a shared problem into a series of local inconveniences.
The business feels the aggregate damage without owning it clearly. Teams manage their slice without seeing the total. Leadership looks at returns as a line item — usually the label cost — and concludes that things are under control.
Meanwhile, the full margin erosion continues.
This is the point that is easy to miss: the danger of returns is not their scale in any given moment. It is their invisibility across moments. A return that costs $40 in real terms but shows up as $8 in one budget, $12 in another, $10 in a third, and $10 in a fourth is not a $40 problem that anyone is solving. It is four small problems that each seem manageable — and are collectively destroying margin.
Addressing returns management holistically delivers key benefits: businesses can cost effectively manage returns, retain revenue through strategies like exchanges and personalized recommendations, and work toward a seamless returns process that enhances customer trust and operational efficiency. A unified approach ensures the true impact of returns is visible and actionable, turning a fragmented challenge into an opportunity for improved profitability and customer loyalty.
The Importance of Technology in Returns Management
Technology has become indispensable in modern returns management, offering e-commerce businesses the tools they need to streamline the returns process, reduce costs, and boost customer satisfaction. Returns management software automates key steps such as return authorization, generating return labels, and processing refunds, ensuring a seamless experience for both customers and staff. Real-time updates and self-service options empower customers to track returns and receive timely resolutions, which enhances customer experience and builds loyalty.
Beyond automation, technology enables businesses to identify trends and patterns in returns data, providing actionable insights that can inform product improvements, inventory management, and future returns strategies. By leveraging advanced returns management solutions—from lightweight tools like the Return Prime returns solution for Shopify brands to full-stack platforms—e-commerce businesses can reduce operational costs, minimize errors, and make data-driven decisions that support business growth. In a landscape where customer expectations are higher than ever, investing in the best returns management software is a key step toward maintaining customer satisfaction and gaining a sustainable competitive advantage.
Brands Don’t Just Have a Returns Problem — They Have a Visibility Problem Around Returns Data Loss
The practical implication of all of this is straightforward, even if the fix is not easy.
Better returns management starts with better measurement—not just label cost, but the fully loaded cost across shipping, labor, markdowns, wasted CAC, customer service burden, fraud leakage, and especially reverse logistics costs. These reverse logistics costs, which include the expenses associated with the reverse logistics process—such as moving products back through the supply chain, restocking, refurbishing, or disposing of returned items—are a critical component of the total cost of returns. When those losses are consolidated into a single model alongside metrics like your average ecommerce return rate and its drivers, including the operational complexities and financial impact of reverse logistics, the picture looks different — and the business case for addressing returns as a strategic problem becomes much clearer.
This is why finance leaders need a model that goes beyond surface-level returns metrics. Reverse logistics focuses on asset recovery, sustainability, and maximizing value from returned products, which requires a comprehensive approach. How CFOs should evaluate returns strategy is a distinct discipline from how ops manages throughput or how merchandising tracks markdowns. Building that shared model is what turns a distributed problem into an ownable one.
Returns happen frequently in e-commerce, and both online retailers and physical stores must proactively manage them, especially as e-commerce return rates continue to rise across categories. Online shoppers expect convenient and transparent return processes, including clear policies on how and when to accept returns, and options like store credit or free return shipping to boost satisfaction and retention. Managing returns consistently across all sales channels and integrating them into the broader supply chain and retail operations is essential for efficiency and customer trust.
A robust returns management solution can automate and optimize the entire process, providing real-time analytics, branded portals, and seamless integration across sales channels. When that model and solution exist, the conversation changes. Returns stop being a logistics issue that ops is handling and start being a margin issue that the business is accountable for. That is when returns are becoming a board-level topic — not because volumes grew, but because the financial picture became clear enough to demand executive attention.
The companies that see the full loss first are the ones that act earliest. The ones that see only label costs tend to discover the real problem later, under worse conditions.
Traditional Returns Are Ending
Ecommerce built a returns system for a smaller internet. Today it’s collapsing under scale. Warehouses can’t absorb the volume, costs keep rising, and retailers are quietly tightening policies. This article explains why the old model is failing and what replaces it.
Read the Returns BibleBenefits of Effective Returns Management
Adopting effective returns management best practices delivers a host of benefits for e-commerce businesses. First and foremost, it leads to improved customer satisfaction and increased customer loyalty by ensuring that returns are handled quickly, transparently, and fairly. A streamlined returns process reduces operational costs and reverse logistics expenses, turning what is often seen as a cost center into a source of revenue retention and business growth.
Effective returns management also enhances operational efficiency by minimizing bottlenecks, optimizing inventory management, and reducing labor costs associated with processing returns. Additionally, analyzing returns data provides valuable insights into product performance and customer behavior, enabling businesses to refine their offerings and reduce future returns. By prioritizing returns management as a strategic function, e-commerce businesses can transform returns from a significant challenge into a competitive advantage, driving repeat business and supporting long-term success.
Frequently Asked Questions
Why are returns considered a silent margin killer rather than a visible cost?
Returns are considered silent because the losses are distributed across multiple departments and time periods. Shipping costs appear immediately, but labor, markdowns, wasted customer acquisition spend, inventory distortion, and fraud leakage show up separately in different budgets. No single team sees the full damage, which is why the total loss is routinely undercounted and under-owned.
Which teams are most affected by return losses in an ecommerce business?
Returns create costs across operations, finance, merchandising, marketing, customer service, and fraud prevention. Operations absorbs intake labor and throughput drag. Finance sees margin erosion without always identifying returns as the cause. Merchandising manages markdown pressure from delayed resale. Marketing carries unrecoverable customer acquisition spend. Customer service handles ticket volume. Each team sees a local version of the problem, but rarely the aggregate.
Is the shipping label cost the biggest expense in a return?
No. Shipping is the most visible cost, but industry analysis puts the full average cost per return at roughly $40 when labor, handling, repackaging, and secondary costs are included. Return cost as a share of original sale price typically runs between 17 and 30 percent. When markdowns and wasted customer acquisition spend are added, the real loss is often far greater than the label cost alone.
Why does delay make returns more expensive over time?
Delay removes inventory from its resale window. An item that takes two to three weeks to pass through intake, inspection, and repackaging may return to availability after its optimal selling period has passed. That forces a markdown that would not have been necessary with faster processing. Seasonal items face this most acutely, but delay creates value erosion across most categories.
What does it mean that returns are “under-owned” as a margin problem?
Under-owned means no single function in the business carries full accountability for the total cost of returns. Because losses fragment across departments, each team manages its share but no one manages the whole. This creates a structural underreaction — the business knows returns are costly, but the distributed nature of the damage prevents a unified response. Fixing the visibility problem is often the precondition for fixing the margin problem.
At what point does the returns problem typically rise to executive or board-level attention?
Returns tend to reach executive attention when they are modeled as a combined margin problem rather than a series of departmental costs. That usually happens when finance builds a fully loaded returns cost model that consolidates shipping, labor, markdowns, fraud, and CAC losses in one place. Once the aggregate number is visible, the strategic case for addressing returns at a structural level becomes hard to dismiss.
Written By:
Manish Chowdhary
Manish Chowdhary is the founder and CEO of Cahoot, the most comprehensive post-purchase suite for ecommerce brands. A serial entrepreneur and industry thought leader, Manish has decades of experience building technologies that simplify ecommerce logistics—from order fulfillment to returns. His insights help brands stay ahead of market shifts and operational challenges.
Turn Returns Into New Revenue
Related Articles
How to Introduce P2P Returns Without Breaking CX
Introducing peer-to-peer returns without breaking customer experience is mostly a change-management and trust-design problem, not a technology problem.
Why P2P Requires a Different Mental Model
Introduction Most people misunderstand peer-to-peer returns for the same reason: they evaluate the system through warehouse-first assumptions.
When Warehouse Returns Still Make Sense
A serious returns strategy does not pretend one path fits every return.
Recession Proof Businesses: 12 Models That Survive Economic Downturns

In this article
19 minutes
- What Actually Makes a Business Resilient
- 12 Business Models That Hold Up in Downturns
- Why Some "Recession Proof" Businesses Still Fail
- The Operational Angle: Margin, Logistics, and Returns
- Understanding Economic Downturns and Business Cycles
- Frequently Asked Questions
- Conclusion: Building for Resilience in Any Economy
Economic slowdowns redistribute demand. They do not eliminate it. Most businesses face significant challenges during an economic crisis, but some adapt and survive. Consumers still need food, healthcare, and shelter. Businesses still need cleaning, repairs, and logistics. Parents still need childcare. The question for any business is not whether a recession will change buying behavior, because it will, but whether the business sells something that remains necessary when discretionary spending contracts.
The phrase “recession proof” overpromises. No business model guarantees survival in an economic downturn regardless of how it is run. During an economic crisis, most businesses struggle, but adaptable business models characterized by flexibility and a willingness to adjust to changing market conditions are better positioned to thrive. What actually holds up are business models built around essential demand, with cost structures that allow margins to survive lower volumes, and operations flexible enough to adapt as conditions shift. The 12 categories below reflect those characteristics consistently across economic cycles.
What Actually Makes a Business Resilient
Before listing business types, it is worth being precise about what resilience actually means in an economic downturn, because the term is used loosely.
Demand stability is the most important characteristic. Businesses that sell goods or services people need regardless of their income level maintain volume during downturns. Businesses that sell goods or services people want but can postpone or eliminate contract sharply.
Margin durability matters as much as demand. A business with 50 percent gross margins can absorb volume decreases and still remain profitable. A business running on 10 percent margins may not survive a 15 percent revenue drop even if demand holds. Cost control in logistics, labor, and inventory becomes the deciding factor at thin margins.
Operational flexibility determines whether a business can respond to changing conditions rather than just surviving them. Businesses that can scale down costs as volume falls, shift product mix toward higher-demand categories, and reduce inventory risk through just-in-time or demand-driven purchasing hold up better than those locked into fixed cost commitments.
The contrarian insight worth making explicit: many businesses described as recession proof fail during recessions, not because their market dried up but because they were over-leveraged, under-capitalized, or operationally inflexible going into the downturn. The business category matters less than how the business within that category is structured and run.
Let AI Optimize Your Shipping and Boost Profits
Cahoot.ai software selects the best shipping option for every order—saving you time and money automatically. No Human Required.
See AI in Action12 Business Models That Hold Up in Downturns
1. Grocery and Essential Food Retail
People do not stop eating during recessions. They adjust what they buy and where they buy it, often trading down from restaurants to grocery stores and from premium brands to private label alternatives. Grocery businesses benefit from this trade-down effect because total food spending contracts less than restaurant spending. The grocery store industry is expected to grow at a compound annual growth rate of 3% from 2024 to 2030, reflecting rising demand for essential food products even during economic downturns.
For ecommerce brands in food and pantry categories, recessions often bring volume increases in shelf-stable staples, bulk formats, and value-positioned products. Discount retailers and thrift stores see increased traffic as consumers become more budget-conscious, sometimes engaging in retail therapy as a form of comfort during tough times. The operational challenge is margin management: consumers buying down in price and trading toward lower-cost options compresses unit economics just as volume increases.
2. Healthcare and Medical Services
Demand for health care is largely inelastic. People do not defer urgent medical care because of economic conditions, and chronic conditions require ongoing management regardless of household income changes. Health care and pharmaceuticals remain stable as people still require medical care and medications regardless of the economic situation. Elective procedures are more sensitive to economic pressure, but primary care, pharmaceuticals, and essential health services maintain relatively stable demand through downturns. The healthcare industry is projected to be one of the fastest growing sectors in the U.S. from 2022 to 2032, driven by an aging population and increased rates of chronic diseases.
Ecommerce brands in health and wellness categories, including supplements, over-the-counter health products, and personal care items marketed toward health outcomes, often see resilient demand during recessions, particularly products that offer a substitute for more expensive healthcare options. Healthcare services are considered essential as they remain in constant demand regardless of economic conditions.
3. Funeral Services
Funeral services represent one of the clearest examples of demand that does not respond to economic conditions. Death does not slow during recessions. Even when a recession hits, demand for funeral services remains stable. The total number of funerals conducted is determined by mortality rates, not by GDP growth. Pricing can compress as families seek lower-cost options, but volume is structurally stable. The funeral services industry contracted less than 1 percent in revenue during the Great Recession.
4. Auto Repair and Maintenance
During recessions, consumers keep vehicles longer rather than purchasing new ones. Car maintenance becomes a priority as consumers postpone buying new vehicles and invest in repairs, leading to higher demand for mechanics. This behavioral shift increases the volume of repair and maintenance work as older vehicles require more service. The same dynamic that suppresses auto sales supports auto repair businesses.
For ecommerce brands selling automotive parts, accessories, and maintenance supplies, recessions tend to increase the addressable market as more consumers attempt DIY maintenance to avoid labor costs and as the average age of vehicles on the road increases.
5. Home Repair and Maintenance Services
When housing markets weaken and people cannot afford to move, they invest in maintaining and improving the homes they are already in. Plumbing failures, electrical problems, and HVAC breakdowns do not wait for economic recovery. Essential home repair holds up well. Regular maintenance becomes even more important during a recession, as consumers tend to repair existing homes rather than buying new ones. Premium renovation projects that are discretionary contract more, but repair-oriented businesses targeting essential maintenance see relatively stable demand.
For ecommerce brands selling tools, hardware, or home improvement supplies, the shift toward homeowner-driven maintenance over contractor-driven renovation changes the product mix that performs best, but total category demand typically holds or increases in recessions.
6. Childcare Services
Working parents with children cannot simply stop working because of an economic slowdown. In many cases, economic pressure increases the number of dual-income households that need childcare as secondary earners return to work. Childcare demand is not perfectly inelastic, some families adjust by relying on family members or reducing hours, but the structural need for reliable childcare is not optional for most working parents. There is a rising demand for childcare services, and spending on children’s goods remains steady during downturns as parents prioritize their children’s needs. Childcare services are essential, as working parents continue to seek reliable options regardless of economic conditions.
7. Commercial and Residential Cleaning Services
Cleaning services split into two categories with different recession profiles. Residential cleaning is more discretionary and contracts when household budgets tighten. Commercial cleaning, serving healthcare facilities, food production environments, and regulated industries, is much more stable because it is legally required and operationally essential. Commercial cleaning services, in particular, are considered recession-proof businesses due to the ongoing demand for specialized cleaning standards in essential sectors such as healthcare facilities, educational institutions, and retail spaces, especially following increased sanitation needs after COVID-19. Both residential and commercial cleaning services are essential as they provide necessary sanitation and maintenance, which are critical regardless of the economic climate. Businesses targeting commercial and institutional cleaning have more recession-resistant revenue than those targeting residential customers.
8. Utility Services and Energy
Electricity, water, natural gas, and internet access represent essential infrastructure that consumers and businesses cannot easily reduce. Utility services provide essential services, and essential services like healthcare, utilities, and emergency repairs are inelastic in demand, meaning they are needed regardless of economic conditions. Utility services are among the most stable demand categories in any economic climate. Utility businesses are regulated industries with pricing controls and do not compete in traditional market terms, but the operational characteristic of non-discretionary demand is worth naming as a category.
For ecommerce brands, utility-adjacent products such as energy efficiency hardware, home energy monitoring equipment, and products that reduce utility costs can see increased demand during recessions as consumers look for ways to reduce ongoing bills.
9. Discount Retail and Resale
When consumer budgets contract, discount channels capture spending that previously went to full-price retail. Dollar stores, off-price retailers, and secondhand or resale platforms tend to see volume increases during recessions as value-seeking behavior intensifies. This is the trade-down effect in non-food categories.
For ecommerce brands, the recession period is a strategic inflection point on pricing and positioning. Brands that can credibly offer value relative to premium alternatives, or that operate in the resale or refurbished space, are better positioned than those selling premium-priced discretionary goods.
10. Tax Preparation and Financial Advisory Services
Tax obligations do not pause during recessions, and economic uncertainty increases the complexity of individual and business financial situations. Demand for tax preparation services tends to hold. Financial advisory services that focus on budgeting, debt management, and financial planning for stress-affected households see increased engagement during downturns. Financial planning services are essential as they help individuals and businesses manage their finances, especially during economic downturns when financial challenges arise. Advisory services helping businesses with cost restructuring are particularly in demand.
11. Logistics and Delivery Services
Essential goods still need to move during recessions, and the ongoing structural shift toward ecommerce means that last-mile delivery infrastructure remains in consistent demand regardless of broader economic conditions. Courier services are experiencing significant growth, with global parcel shipping volume projected to reach 256 billion parcels by 2027, driven by the rise of e-commerce and online shopping. This growth is supported by a strong compound annual growth rate, highlighting the resilience and expansion prospects of the sector. Carriers, freight companies, and fulfillment operations serving essential categories maintain relatively stable volume.
For ecommerce brands, the recession test for fulfillment operations is whether shipping costs and returns processing remain manageable at lower order volumes. A fulfillment cost structure built for peak season volume that is applied to a reduced-volume recession period can erode margins quickly.
12. Pet Care and Pet Supplies
Pet ownership rates are relatively stable through economic cycles, and the relationship between owners and their pets is resistant to spending cuts in ways that many other categories are not. Consumers will reduce spending on themselves before cutting back on pets. There is a constant demand for pet care services and products, as pets are increasingly viewed as family members and their care is prioritized even during tough economic times. Routine veterinary care, pet food, and basic pet supplies maintain demand relatively well during downturns.
For ecommerce brands in the pet category, the risk is in premium and luxury pet products rather than essentials. Gourmet treats, premium accessories, and high-end pet wellness products face more pricing pressure than food, basic care supplies, and routine health products.
13. Beauty and Personal Services
The beauty and personal services industry stands out as a recession proof business idea, consistently demonstrating resilience during tough economic times. Even when consumers cut back on discretionary spending, many continue to prioritize essential grooming and self-care services such as haircuts, nail care, and skincare. These services are not only important for maintaining a professional appearance but also provide a sense of normalcy and confidence during periods of economic uncertainty.
A phenomenon known as the “lipstick effect” often emerges during downturns, where people indulge in small luxuries like beauty services and products as a form of affordable comfort. This trend, combined with the influence of social media and the ongoing need for personal upkeep, ensures that beauty services remain in steady demand. According to the Bureau of Labor Statistics, employment for barbers, hairstylists, and cosmetologists is projected to grow 10% from 2020 to 2030—outpacing the average for all occupations. This growth is fueled by a rising population and an increasing emphasis on personal appearance, making beauty and personal services a recession resistant industry with continuous opportunities for entrepreneurs offering essential products and services.
ShipStation vs. Cahoot: 21x Faster, Real Results
Get the inside scoop on how a leading merchant switched from ShipStation to Cahoot—and what happened next. See it to believe it!
See the 21x DifferenceWhy Some “Recession Proof” Businesses Still Fail
The businesses described above operate in resilient demand categories. That does not protect any specific business within those categories from failure if the underlying operations are poorly structured.
Over-leverage is the most common failure mechanism. A grocery distribution business carrying significant debt from an expansion entered during the preceding growth period may face insolvency during a recession even if sales hold flat. The revenue line is stable. The debt service is not manageable at that revenue level.
Inventory risk accumulates in ways that are invisible during growth. An ecommerce brand in a recession-resistant category that is carrying excess inventory heading into a downturn faces a cash flow problem that its demand resilience does not solve. Dead stock consumes capital and incurs holding costs regardless of whether the category is essential.
Returns volume increases during recessions. Financially stressed consumers are more likely to return purchases, more likely to dispute charges, and more likely to buy multiples with the intention of returning some, amplifying broader trends of rising ecommerce return rates driven by behavior like bracketing and wardrobing and the need for crafting the perfect e-commerce returns program. Businesses without efficient reverse logistics operations absorb higher effective costs on each returned unit and benefit from optimizing reverse logistics, especially in categories where the average ecommerce return rate ranges from 15 to 30 percent. For ecommerce brands, a returns rate that was manageable at full-price margins becomes damaging at recession-driven promotional pricing because the cost of free returns and ecommerce return rates directly erode profit margins.
Operational cost structures built for growth do not automatically right-size for recessions. Warehouse space committed in long-term leases, staffing levels built for higher order volumes, and carrier contracts structured around volume commitments all become liabilities when volume contracts. The businesses that survive recessions are those that can reduce operational costs in proportion to volume reduction without triggering service failures. Companies with strong cash flow management and low debt are better able to navigate periods of reduced revenue during a recession, as successful recession-proof businesses often have high cash flow and minimal debt.
Additionally, support ensures smooth technology operation and minimizes work disruptions during challenging financial periods. It’s also important to note that job security can be lower in some roles, such as freelancing or virtual assistant positions, compared to traditional employment, especially during economic downturns. At the same time, retailers need to guard against returns fraud and refund fraud by detecting and preventing ecommerce returns fraud, and many will rely on returns management software or even evaluate the best returns management software for 2025 to keep operations efficient and protect margins.
The Operational Angle: Margin, Logistics, and Returns
For ecommerce brands evaluating their recession resilience, the most actionable questions are operational rather than strategic. A strong customer base is essential for resilience, as it helps sustain revenue even when demand fluctuates. Recession-proof industries tend to operate independently of broader economic trends, maintaining steady performance regardless of what’s happening in the stock market.
What is the gross margin at 70 percent of current volume? If the answer is negative or unsustainably thin, the business is not operationally resilient regardless of its demand category.
What happens to fulfillment costs per unit if order volume drops by 30 percent? Fixed components of fulfillment cost, including warehouse rent, minimum labor, and platform fees, do not scale down proportionally with volume. The per-unit cost rises as volume falls, compressing margins further at exactly the moment when pricing pressure from consumers is also increasing.
What is the returns rate under promotional pricing? If a brand reduces prices to maintain volume during a downturn, and returns rates are higher on discounted purchases, the effective margin per order may be worse than the margin at standard pricing with lower volume. Managing this tradeoff requires an exceptional returns program that drives loyalty, smart use of return labels and modern return options, and, for Shopify merchants, careful evaluation of tools like the Return Prime returns solution to keep the experience positive without letting costs spiral.
The brands best positioned to survive a recession are those that have answered these questions before the recession arrives, not during it. Businesses that thrive during a recession typically provide essential goods, services, or budget-friendly alternatives that consumers cannot cut from their budgets, which is a key characteristic of a recession proof industry.
Cut Costs with the Smartest Shipping On the Market
Guranteed Savings on EVERY shipment with Cahoot's AI-powered rate shopping and humanless label generation. Even for your complex orders.
Cut Costs TodayUnderstanding Economic Downturns and Business Cycles
Economic downturns, or recessions, are periods when overall economic activity declines, often marked by two or more consecutive quarters of falling gross domestic product (GDP). During these times, many businesses face reduced sales, tighter cash flow, and increased financial pressure. However, not all businesses are affected equally. Some business models, especially those providing essential services or products, are more recession proof and can even thrive when economic conditions are challenging.
For small business owners and entrepreneurs, understanding the nature of business cycles and how economic downturns unfold is crucial. By recognizing which industries and business ideas are recession resistant, entrepreneurs can make informed decisions about where to invest their time and resources. This knowledge helps small businesses adapt to tough economic times, identify new opportunities, and build resilience against future economic uncertainty. Ultimately, focusing on recession proof business ideas and understanding the dynamics of economic activity can give small business owners a significant advantage in navigating unpredictable economic conditions.
Frequently Asked Questions
Are there any truly recession proof businesses?
No. No business is entirely immune to economic downturns. However, recession proof jobs are typically found in industries that serve fundamental human needs and maintain consistent demand even during downturns. What exists are business models in categories with stable, non-discretionary demand that, when operated with appropriate margins and cost structures, can maintain profitability at reduced economic activity. The business category matters, but operational fundamentals matter as much.
Which ecommerce categories hold up best during recessions?
Categories tied to essential goods, including food staples, health and personal care products, pet supplies, home maintenance items, and cleaning supplies, tend to maintain demand better than discretionary lifestyle, fashion, or luxury categories. Value-positioned products within any category perform better than premium-positioned ones as consumer budgets contract.
Both digital marketing and ecommerce sectors have shown continuous growth, even during economic downturns, making them strong contenders among recession proof businesses. For example, the beauty industry—including makeup and hair services—is projected to exceed $784.6 billion by 2027, with a strong compound annual growth rate, highlighting its resilience as consumers seek small indulgences. Similarly, the global baby product market is expected to grow at a compound annual growth rate of almost six percent between now and 2030, indicating consistent demand for child services and products.
What makes a business vulnerable during a recession even in a resilient category?
High leverage, excess inventory, inflexible cost structures, thin margins, and high returns rates are the primary vulnerabilities, and financial challenges can exacerbate these vulnerabilities during a recession. A business in a resilient demand category can still fail if it enters the downturn over-extended or if its operations cannot right-size costs in proportion to volume changes.
How should ecommerce brands prepare for a potential recession?
Practical preparation includes reducing excess inventory to free working capital, reviewing fulfillment cost structures for fixed cost exposure at lower volumes, modeling margin at 70 to 80 percent of current revenue, and stress-testing the impact of higher returns rates on effective margin. Preparing for an economic crisis as well as a recession ensures brands are ready for any financial downturn. Brands that understand their breakeven point at reduced volume are better positioned to make informed decisions quickly if conditions deteriorate.
Do discount businesses always thrive during recessions?
They tend to gain market share as consumers trade down, but growth is not guaranteed. Some consumers may even spend more money on small luxuries or essentials at discount retailers during downturns, seeking affordable ways to boost morale or meet needs. Discount businesses with thin margins must manage volume increases carefully to avoid operational strain. Profitability depends on whether the operational cost structure can absorb higher throughput without margin erosion.
Is a service business more recession resistant than a product business?
Not inherently. The determining factor is whether the service or product addresses essential demand. A premium spa service is vulnerable in a recession. A plumbing repair service is not. An ecommerce brand selling luxury goods is vulnerable. One selling essential household supplies is more resilient. The essential versus discretionary distinction matters more than the product versus service distinction.
Conclusion: Building for Resilience in Any Economy
Building a recession proof business is about more than just choosing the right industry—it requires strategic planning, adaptability, and a focus on providing essential services that people rely on regardless of the economic climate. By understanding economic downturns and business cycles, entrepreneurs can anticipate challenges and position their businesses to withstand tough economic times.
Success in any economy comes from offering recession proof business ideas that meet high demand, such as financial advisors, childcare services, and beauty services. These recession resistant businesses provide products and services that remain essential, even when consumers are looking to save money and cut costs. Small business owners who develop a solid business plan, stay flexible, and focus on resilience can not only survive but thrive during periods of economic uncertainty. By prioritizing essential services and adapting to changing economic conditions, businesses can build a foundation that supports long-term growth and stability, no matter what the future holds.
Written By:
Manish Chowdhary
Manish Chowdhary is the founder and CEO of Cahoot, the most comprehensive post-purchase suite for ecommerce brands. A serial entrepreneur and industry thought leader, Manish has decades of experience building technologies that simplify ecommerce logistics—from order fulfillment to returns. His insights help brands stay ahead of market shifts and operational challenges.
Turn Returns Into New Revenue
Related Articles
How to Introduce P2P Returns Without Breaking CX
Introducing peer-to-peer returns without breaking customer experience is mostly a change-management and trust-design problem, not a technology problem.
Why P2P Requires a Different Mental Model
Introduction Most people misunderstand peer-to-peer returns for the same reason: they evaluate the system through warehouse-first assumptions.
When Warehouse Returns Still Make Sense
A serious returns strategy does not pretend one path fits every return.