Cheapest Shipping from USA to UK: Options, Costs, and What to Watch

In this article
 14 minutes
- Carrier Options for USA to UK Shipping
- UK Import Rules: What Your Customer Actually Pays
- DDP vs DDU: The Decision That Shapes Customer Experience
- Transit Time vs Cost: The Real Tradeoff
- The Real Cost of Cheap Shipping
- How to Actually Reduce Costs Without Wrecking the Experience
- Frequently Asked Questions
Shipping from the USA to the UK is one of the most common international routes for ecommerce brands, and it is also one of the most misunderstood from a cost perspective. The carrier with the lowest label price is rarely the option with the lowest total cost once UK customs rules, duties, transit times, and the downstream impact on customer experience are factored in. Focusing exclusively on postage gets you a number that looks good in isolation and causes problems everywhere else.
This guide covers the major carrier options, how UK import rules shape what your customer actually pays, why the DDP versus DDU decision matters more than most brands realize, and what the real cost of cheap international shipping looks like when refunds, returns, and customer service volume are included.
Let AI Optimize Your Shipping and Boost Profits
Cahoot.ai software selects the best shipping option for every order—saving you time and money automatically. No Human Required.
See AI in ActionCarrier Options for USA to UK Shipping
No single carrier is the right answer for every shipment. The correct choice depends on package weight, declared value, how much transit time matters to your customer, and whether you have negotiated rates or are shipping at retail.
USPS is the default starting point for small, lightweight packages. First-Class Package International handles items up to 4 lbs, with transit times of one to four weeks and limited tracking visibility once the package leaves US soil. Retail rates for packages under 4 lbs start in the $15 to $23 range. Priority Mail International offers better tracking and $200 of included insurance, with six to ten business-day delivery. Flat-rate Priority Mail boxes, starting around $32 to $45, can offer real savings for dense, heavy items, but you should evaluate whether flat-rate parcels or other services are truly the best way to ship heavy items for your product mix. Priority Mail Express International compresses transit to three to five business days with a money-back guarantee. All USPS international shipments hand off to Royal Mail for UK final-mile delivery, which can add one to three days and creates tracking gaps at the handoff point.
FedEx International Economy is consistently one of the strongest price-to-reliability options for ecommerce brands, with two- to five-day transit and full end-to-end tracking. Through aggregator platforms or negotiated accounts, rates on a 5 lb package run roughly $42 to $65. FedEx International Connect Plus is worth specific attention for B2C sellers because it eliminates residential delivery surcharges, saving $4 to $6 per package across high volumes. FedEx International Priority compresses transit further but at a meaningful cost premium.
UPS Worldwide Expedited delivers in two to five business days with full tracking and broker-inclusive customs clearance. Through third-party platforms, rates are broadly comparable to FedEx Economy at roughly $50 to $75 on a 5 lb package. UPS offers strong reliability and customs expertise, making it a solid default for brands that have not yet negotiated a carrier contract.
DHL Express is the premium option with the best tracking in the industry, fastest customs clearance, and the strongest European delivery network. At retail, DHL is prohibitively expensive for most ecommerce use cases. With a business account, discounts of 69 to 85 percent off retail are achievable, which brings DHL into competitive range for high-value or time-sensitive shipments. Without a business account, it rarely makes sense for routine ecommerce shipping.
Shipping aggregators are where most ecommerce brands should start before approaching any carrier directly. Pirate Ship offers its Simple Export Rate, which starts around $11 to $16 for packages under 4 lbs and includes up to 52 percent off USPS First-Class International at no cost to the seller. Easyship connects to more than 550 carriers with discounts up to 91 percent off retail and integrates landed cost calculation at checkout. Shippo and ShipStation offer similar multi-carrier access with automation features that matter at higher volumes. The consistent rule is that retail rates should never be the starting point for any significant shipping volume.
UK Import Rules: What Your Customer Actually Pays
The UK eliminated its low-value VAT exemption on January 1, 2021. There is no de minimis threshold for VAT on commercial imports. Every shipment, regardless of value, is subject to 20 percent UK VAT.
The £135 threshold applies specifically to customs duty, not VAT. For consignments with an intrinsic goods value at or below £135, no customs duty is charged at the border. However, the overseas seller is required to register for UK VAT and collect that 20 percent at the point of sale, remitting it directly to HMRC. When this is handled correctly, the package clears UK customs without any surprise charges reaching the recipient.
For consignments above £135, customs duty applies based on the product’s HS code and the country of origin. US goods face UK Global Tariff rates that average around 4 percent but vary significantly by product category, ranging from zero to 12 percent or more. Import VAT is then calculated on the combined value of goods, shipping, insurance, and any duty already assessed. A practical example: £200 of goods with £30 shipping and a 6.5 percent duty rate produces approximately £14.95 in duty, then 20 percent VAT on the combined £244.95 subtotal adds roughly £49 in VAT. The total border charge is approximately £64, plus any carrier handling fees if the shipment arrives unprepared.
The only remaining UK customs exemption applies to genuine gifts sent between private individuals, valued under £39. This has no application to commercial ecommerce sales.
Customs documentation requirements are strict. CN22 forms apply to postal shipments under 2 kg and under £270 in value. CN23 forms are required for heavier or higher-value postal shipments. Commercial invoices are required for all private courier shipments via DHL, FedEx, and UPS. Every document must include accurate HS codes, detailed product descriptions, country of origin, and declared values. Vague descriptions or missing HS codes are the most common cause of UK customs holds and delays.
ShipStation vs. Cahoot: 21x Faster, Real Results
Get the inside scoop on how a leading merchant switched from ShipStation to Cahoot—and what happened next. See it to believe it!
See the 21x DifferenceDDP vs DDU: The Decision That Shapes Customer Experience
DDP (Delivered Duty Paid) means the seller collects duties and taxes at checkout and prepays them before the shipment arrives at the UK border. The customer receives the package with no additional payment required.
DDU (Delivered Duty Unpaid, now formally known as DAP) means duties and taxes are assessed at the UK border and the carrier contacts the recipient demanding payment before releasing the parcel. Royal Mail charges a flat £8 handling fee on top of the actual customs charge. UPS and FedEx charge brokerage advancement fees ranging from £11 to £50 or more depending on shipment value.
The downstream consequences of DDU for ecommerce are consistently underestimated. A customer who ordered a $35 product may face a VAT bill of £2.10 plus Royal Mail’s £8 handling fee, totaling nearly £10 in unexpected charges on a sub-$40 purchase. That customer does not think of this as a government tax. They think of it as a bad experience with your brand. The predictable chain of events is: refusal of delivery, a one-star review, a chargeback request, and no repeat purchase. Royal Mail holds refused parcels for 21 days, then returns them to the sender at the seller’s cost. The brand absorbs outbound shipping, return shipping, and any duties already advanced, on a transaction that generated zero revenue.
DDP removes all of this exposure. DDP packages clear customs automatically because duties are prepaid, avoiding the two- to five-day delay typical of DDU while carriers collect payment from uncertain recipients. Brands that implement DDP consistently report significantly fewer customs-related support inquiries and higher international conversion rates. Amazon requires DDP for all shipments through its platform, which is a signal of where industry expectations sit.
Implementing DDP requires registering for UK VAT, classifying products with accurate HS codes, and calculating landed costs at checkout. Tools such as Zonos, Easyship, and Global-e handle this automatically and integrate with major ecommerce platforms. DHL, FedEx, and UPS all support DDP as a shipping option at the carrier level. The upfront cost of implementing DDP is real. The cost of not doing it, across chargebacks, returns, and lost customer lifetime value, is reliably higher.
Transit Time vs Cost: The Real Tradeoff
USPS economy options are the lowest label price available for lightweight packages. They are also the slowest, with the least predictable transit times and the most limited tracking. For low-value items where the customer has low delivery expectations, economy postal shipping is appropriate.
For most ecommerce brands shipping branded products to UK customers who paid full price, the two- to four-week delivery window of economy postal service creates a structural customer experience problem. A customer who orders on day one and receives a vague customs delay notification on day eighteen is not comparing your delivery time to your posted estimate. They are comparing it to what they receive from every other brand they order from.
The cost gap between USPS Priority Mail International and FedEx International Economy through an aggregator platform is often smaller than it appears at retail. A five- to seven-day delivery upgrade may cost $10 to $20 more per shipment. Against the potential customer service cost of a single customs inquiry or the lost lifetime value of a dissatisfied first-time customer, that cost difference frequently represents the better investment.
The practical framework for most ecommerce brands: use economy postal options for low-value items under $25 where delivery expectations are set accordingly, use FedEx International Economy or UPS Worldwide Expedited as the standard service for most orders, and reserve DHL Express or other expedited shipping services for high-value shipments where fast customs clearance and end-to-end tracking justify the cost.
The Real Cost of Cheap Shipping
The label price of a shipment is one component of total shipping cost. The full cost stack includes dimensional weight pricing penalties for bulky packages, fuel surcharges adjusted weekly and spiking during peak periods, residential delivery fees, address correction charges, and carrier-imposed surcharges from carriers like UPS and FedEx and peak season shipping surcharges from major carriers that vary by route and season.
Customer service costs are where cheap international shipping destroys margin invisibly. Packages delayed at customs generate support tickets. Shipments with tracking gaps generate anxious customers who contact support before the window has even closed. International returns trigger the same inquiry volume as domestic returns but at two to three times the processing cost per unit. Cross-border return rates average around 25 percent, and more than 30 percent of returned items cannot be resold as new.
Each refused parcel under DDU terms costs the brand outbound shipping, return shipping, and any carrier advancement fees already incurred, against zero revenue. At scale, even a small percentage of refused DDU shipments represents a meaningful drag on international channel profitability.
Cut Costs with the Smartest Shipping On the Market
Guranteed Savings on EVERY shipment with Cahoot's AI-powered rate shopping and humanless label generation. Even for your complex orders.
Cut Costs TodayHow to Actually Reduce Costs Without Wrecking the Experience
Use a shipping aggregator. Never ship at retail rates. Pirate Ship, Easyship, Shippo, and ShipStation all provide access to commercial carrier pricing that individual sellers cannot negotiate directly, and multi-carrier shipping software for ecommerce makes it easier to compare and automate those options. The savings are immediate and require no volume commitment.
Optimize packaging. Dimensional weight pricing means that oversized packaging is a direct cost. Right-sizing boxes and switching non-fragile items to poly mailers eliminates DIM weight penalties. USPS flat-rate boxes eliminate dimensional weight entirely and are often the best option for small, dense products, and smart cartonization software can automate this optimization at scale.
Implement DDP before scaling UK volume. The conversion rate, chargeback, and customer lifetime value benefits of DDP typically justify the implementation cost at relatively modest UK order volumes. Waiting until customs complaints become a pattern means absorbing avoidable losses in the meantime.
Consider UK-based fulfillment for consistent volume. For brands with steady UK sales, shipping inventory in bulk to a UK third-party logistics provider converts expensive international per-package shipping into cheap domestic UK delivery. Customers receive orders in two to three days. Customs clearance happens once on the bulk inbound shipment rather than on every individual order. The landed cost per unit through a UK 3PL is frequently lower than direct international shipping once all costs are counted, but only if you understand 3PL pricing and cost structures and how to choose the right 3PL company or the best 3PL for small business for your operation.
Present tiered shipping at checkout. Give customers the choice between economy and standard delivery with honest timeframe communication. Setting accurate expectations at the point of purchase prevents the support volume that vague or optimistic delivery windows generate and supports pricing strategies that keep “free” shipping profitable.
Frequently Asked Questions
What is the cheapest way to ship a small package from the USA to the UK?
For packages under 4 lbs, USPS First-Class Package International and Pirate Ship’s Simple Export Rate are the lowest-cost options, starting around $11 to $23 depending on weight. They come with slow transit times of one to four weeks and limited tracking once the package leaves the US. For anything where delivery speed or tracking reliability matters to the customer, FedEx International Economy or UPS Worldwide Expedited through an aggregator platform typically offer a better total outcome at a modest price premium.
Do I need to pay customs duties when shipping from the USA to the UK?
Your customer may owe UK customs duties and VAT depending on the shipment value. All commercial imports are subject to 20 percent UK VAT regardless of value. Customs duty applies to shipments with a goods value above £135. Below that threshold, no duty is charged but VAT still applies. If you ship DDP, you collect and remit these charges on the customer’s behalf. If you ship DDU, the customer is billed by the carrier at delivery.
What is the difference between DDP and DDU shipping to the UK?
DDP (Delivered Duty Paid) means the seller prepays all UK duties and VAT before the shipment arrives at the border. The customer receives the package without any additional payment. DDU (Delivered Duty Unpaid) means duties and taxes are assessed at the UK border and the recipient must pay before the carrier releases the package. Royal Mail adds a flat £8 handling fee on top of the actual tax amount. Most ecommerce brands shipping B2C to the UK should use DDP to prevent refused deliveries, chargebacks, and customer dissatisfaction.
How long does it take to ship from the USA to the UK?
Transit times vary significantly by service. USPS First-Class International takes one to four weeks. USPS Priority Mail International delivers in six to ten business days. FedEx International Economy and UPS Worldwide Expedited typically take two to five business days. DHL Express delivers in one to three business days. All timelines can extend if customs clearance is delayed due to incomplete documentation.
What customs forms are required for shipping from the USA to the UK?
CN22 forms are required for postal shipments under 2 kg and under £270 in value. CN23 forms are required for heavier or higher-value postal shipments. Commercial invoices are required for all private courier shipments via DHL, FedEx, and UPS. All forms must include accurate HS codes, a detailed product description, country of origin, and declared value. Incomplete or vague documentation is the most common cause of UK customs delays.
Will the UK’s £135 customs duty threshold change?
The UK government confirmed in its November 2025 Autumn Budget that the £135 customs duty relief for low-value imports will be removed by March 2029 at the latest. A formal consultation ran from November 2025 through March 2026. The threshold remains in force today, but brands with significant UK volume should begin planning for a future where all imports face customs duty regardless of order value. Establishing UK-based fulfillment is one way to eliminate the exposure entirely.
Is it cheaper to use a shipping aggregator or ship directly with a carrier?
Shipping aggregators are almost always cheaper than shipping directly at retail rates, often by 30 to 60 percent or more. Platforms like Pirate Ship, Easyship, and Shippo access commercial carrier pricing that is not available to individual shippers without high-volume accounts. There is no meaningful downside to using an aggregator for standard ecommerce shipments. For very high-volume operations, negotiating directly with carriers can provide additional savings and service customization beyond what aggregator pricing delivers.
Written By:

Indy Pereira
Indy Pereira helps ecommerce brands optimize their shipping and fulfillment with Cahoot’s technology. With a background in both sales and people operations, she bridges customer needs with strategic solutions that drive growth. Indy works closely with merchants every day and brings real-world insight into what makes logistics efficient and scalable.
Turn Returns Into New Revenue
Related Articles

How to Introduce P2P Returns Without Breaking CX
Introducing peer-to-peer returns without breaking customer experience is mostly a change-management and trust-design problem, not a technology problem.
Why P2P Requires a Different Mental Model
Introduction Most people misunderstand peer-to-peer returns for the same reason: they evaluate the system through warehouse-first assumptions.
When Warehouse Returns Still Make Sense
A serious returns strategy does not pretend one path fits every return.
What Is Demand Planning? How It Impacts Inventory, Forecasting, and Profitability

In this article
20 minutes
- Introduction to Demand Planning
- Demand Planning vs. Demand Forecasting: Understanding Customer Demand
- Why Poor Demand Planning Creates Inventory Risk
- The Cash Flow Connection
- A Practical Example: Two SKUs, Two Different Outcomes
- What a Demand Planning Process Actually Looks Like
- Demand Planners and Their Role
- Role of Technology in Demand Planning
- Measuring the Success of Demand Planning
- Common Demand Planning Failures in Ecommerce
- Frequently Asked Questions
Demand planning is the process of estimating future customer demand so that a business can align its inventory, procurement, and operations to meet that demand without carrying more stock than necessary. When it works, demand planning keeps shelves stocked, cash flowing, and fulfillment predictable. When it fails, the consequences show up in two painful and equally expensive directions: stockouts that lose sales and overstock that destroys margins. Demand planning is important because it enables proactive decision-making, reduces costs associated with excess inventory, and improves organizational alignment. Effective demand planning is crucial for minimizing disruptions, optimizing resource allocation, and enhancing customer satisfaction.
For ecommerce founders and operations leaders, demand planning is not an abstract supply chain discipline. It is the set of decisions that determines how much capital gets tied up in inventory, how often customers encounter out-of-stock messages, and how frequently the business has to markdown or liquidate product that should never have been purchased in those quantities. Demand planning integrates closely with inventory management and supply chain planning to optimize stock levels, streamline workflows, and ensure efficient fulfillment through order fulfillment services for ecommerce companies. As global supply chains become increasingly complex and volatile, demand planning helps businesses navigate these challenges by improving agility and responsiveness, and industry events focused on logistics and fulfillment can further sharpen these capabilities by exposing teams to emerging best practices and technologies (Cahoot News Events). Getting it right consistently is one of the highest-leverage operational improvements a growing brand can make. Demand planning requires a defined process to avoid chaos and ensure accountability, which is critical for overall performance.
Slash Your Fulfillment Costs by Up to 30%
Cut shipping expenses by 30% and boost profit with Cahoot's AI-optimized fulfillment services and modern tech —no overheads and no humans required!
I'm Interested in Saving Time and MoneyIntroduction to Demand Planning
Demand planning is a cornerstone of effective supply chain management, serving as the bridge between what customers want and how a business prepares to deliver it. At its core, the demand planning process involves gathering and analyzing historical data, monitoring market trends, and considering both internal and external factors that could influence future demand. By forecasting future customer demand with accuracy, businesses can make smarter decisions about production, inventory, and supply chain operations—ensuring that products are available when and where customers expect them.
A well-executed demand planning process doesn’t just help companies avoid costly stockouts or excess inventory; it also enables them to respond quickly to changing market conditions and evolving customer expectations. By aligning supply chain operations with anticipated demand, businesses can reduce costs, improve customer satisfaction, and maintain a competitive edge. In today’s fast-paced markets, effective demand planning is not just important—it’s essential for any company looking to thrive and grow, and the most successful brands turn ecommerce order fulfillment into a profit driver by tightly integrating planning with their logistics strategy.
Demand Planning vs. Demand Forecasting: Understanding Customer Demand
These two terms are used interchangeably in many contexts, but the distinction is worth making because it changes how you evaluate the work. Demand planning best practices include fostering collaboration, selecting appropriate software, and integrating with ERP systems to create a more responsive and data-driven supply chain process.
Demand forecasting is the analytical piece. It is the process of looking at historical sales data, market trends, seasonal patterns, promotional calendars, and external factors to produce a numerical estimate of what customers are likely to buy in a future period. Accurate data is essential in both forecasting and planning, as it eliminates outliers and inaccuracies, ensuring reliable forecasting models. Advanced forecasting techniques that combine qualitative and quantitative methods can further improve demand forecasting accuracy. Statistical forecasting uses complex algorithms to analyze historical data to develop demand forecasts. A good forecast answers the question: how many units of this SKU will we sell next month?
Demand planning is the broader operational process that uses the forecast as an input. It incorporates that estimate into decisions about how much to purchase, when to reorder, how to allocate inventory across channels or locations, and how to adjust when the forecast proves incorrect. An effective demand planning process requires a structured approach that integrates business knowledge, accurate data, cross-functional collaboration, and scalable technology to move from reactive to proactive planning. A good demand plan answers the question: given what we expect to sell, what do we actually need to do right now to be ready? Alongside demand planning, supply planning plays a critical role by coordinating production, procurement, and distribution strategies to ensure sufficient resources are available to meet forecasted demand, especially when navigating obstacles to building an efficient supply chain.
The practical implication of this distinction is that forecast accuracy, while important, is not the whole game. A business can have a reasonably accurate forecast and still make poor demand planning decisions. Buying the right quantity six weeks too late because the procurement cycle was not built around the forecast timeline is a planning failure, not a forecasting failure. Overriding a solid forecast because a sales team is optimistic about a new product launch and ordering twice the predicted volume is a planning failure. The forecast produced good information. The planning process did not act on it well. Implementing an effective demand planning process involves accurate data, collaboration, and scalable technology.
Why Poor Demand Planning Creates Inventory Risk
The most direct consequence of bad demand planning is an imbalance between the inventory you hold and the inventory you actually need. That imbalance always has a cost, regardless of which direction it goes. Maintaining sufficient inventory levels is crucial to avoid both stockouts and excess costs, ensuring customer demand is met efficiently.
When planning consistently underpredicts demand, stockouts become a recurring operational condition. Customers arrive, the product is unavailable, and they leave. In some cases they come back. Research suggests that roughly 69 percent of customers who experience a stockout purchase from a competitor instead. The lost revenue is immediate and visible. The damage to customer lifetime value is harder to see but often more significant. A customer who gets burned by an out-of-stock once is less likely to prioritize your brand the next time they need that category. Supply chain disruptions can result from inaccurate demand planning, leading to delays, lost sales, and operational inefficiencies, and following Cahoot in the news can highlight how innovative fulfillment networks are reshaping resilience in this space.
When planning consistently overpredicts demand, the business accumulates excess inventory. Each unit that sits beyond its expected sell-through window generates holding costs: storage fees, insurance, shrinkage, and the opportunity cost of capital that is locked in unsold goods instead of funding growth. Retail inventory distortion from overstocks and stockouts costs the industry an estimated $1.77 trillion globally each year, with roughly 44 percent of that attributable to overstock alone. Supply chain forecasts rely on accurate demand planning to avoid both overstock and stockouts, helping companies balance inventory and reduce unnecessary costs.
Excess inventory that ages long enough becomes dead stock, which is the most expensive outcome of chronic overplanning. Dead stock has to be written down, liquidated at deep discounts, or disposed of. None of those outcomes recover the full cost. The margin lost to a dead stock event is not just the discount applied at liquidation. It is the cumulative holding cost over the time the units sat, plus the carrying cost of the capital that was tied up while better opportunities were missed. To ensure efficient supply chain operations, it is essential to predict demand accurately using advanced forecasting methods and real-time data, supported by modern ecommerce fulfillment software that provides real-time visibility and smart inventory placement.
Effective demand planning significantly improves companies’ inventory and working capital management by providing clearer insight into what’s actually needed and when. Using demand forecasting to predict future demand trends leads to heightened company efficiency and increased customer satisfaction.
Looking for a New 3PL? Start with this Free RFP Template
Cut weeks off your selection process. Avoid pitfalls. Get the only 3PL RFP checklist built for ecommerce brands, absolutely free.
Get My Free 3PL RFPThe Cash Flow Connection
Inventory is a cash flow instrument as much as it is an operational one. Every purchase order converts cash into product. Every sale converts product back into cash. The faster and more accurately that cycle runs, the more efficiently the business uses its working capital. Effective demand planning leads to heightened company efficiency by optimizing inventory levels and cash flow, resulting in better operational productivity and reduced costs.
Demand planning directly controls the pace and efficiency of that cycle. When planning decisions are driven by accurate demand signals, purchase orders are sized to match realistic sell-through timelines. Cash moves in and out of inventory efficiently. Inventory turns are healthy.
When planning is weak, the cycle breaks. Overbuying on a slow-moving SKU locks cash in inventory for months longer than projected. During that period, the business may lack the working capital to fund a reorder on a fast-moving SKU, invest in a marketing campaign, or take advantage of a supplier discount on a bulk purchase. Real-time visibility into inventory movements and the capabilities of your warehousing and fulfillment providers is essential for agile demand planning, as it enables businesses to quickly adapt to changes and avoid costly missteps (how to pick the right warehousing services provider), especially when partnering with ecommerce order fulfillment services that outclass traditional 3PLs. The cumulative effect of several poor demand planning decisions across a product catalog can create genuine cash flow pressure in a business that otherwise has good sales velocity.
For ecommerce brands operating at growth stage, this dynamic is particularly consequential. Growth requires capital. Capital tied up in excess inventory cannot be deployed elsewhere. Strong demand planning is one of the most direct levers for improving cash flow without adding revenue. Effective demand planning significantly improves inventory and working capital management by providing clearer insight into what’s actually needed and when.
A Practical Example: Two SKUs, Two Different Outcomes
Consider a brand that sells two products. Product A is a bestseller with steady weekly sales of around 200 units. Product B is a newer item with more variable demand, averaging around 60 units per week but spiking to 150 units during promotional periods. By using category segmentation, the demand planning team can tailor planning strategies specifically for high-priority products like Product A, optimizing demand management.
A demand planning team that analyzes historical data and aligns purchasing to real consumption patterns will size their Product A reorders around a predictable 6 to 8 week supply, taking into account supplier lead times and safety stock. For Product B, they will plan conservatively for baseline demand and build contingency into the promotional period with a targeted pre-season reorder. Scenario planning is also crucial here, as it allows the team to model best-case, worst-case, and expected-case scenarios, preparing for sudden demand spikes or drops.
A team without a structured demand planning process will often treat both products the same way. They see that Product B occasionally hits 150 units per week and order to that peak, resulting in chronic overstock during the weeks when demand returns to its baseline 60-unit level. Meanwhile, they underestimate a promotional lift for Product A and run into a stockout at exactly the moment when the product has the most marketing spend behind it. Without analyzing demand drivers—such as seasonality, promotions, or external market factors—they miss key insights into what causes demand fluctuations.
Neither failure is dramatic on its own. But repeated across dozens or hundreds of SKUs over multiple planning cycles, the pattern creates meaningful margin loss, elevated holding costs, and a cash flow profile that is harder to manage than the revenue numbers would suggest. Regularly reviewing actual sales against forecasts is essential to refine future demand plans and ensure alignment with evolving market conditions, and many brands accelerate this learning curve by tapping into expert-led ecommerce webinars that share proven approaches to demand planning and peak-season readiness (Educational Webinars – Cahoot Order Fulfillment) alongside dedicated guides for preparing for the peak holiday season.
What a Demand Planning Process Actually Looks Like
A functional demand planning process has several recognizable components, even if the tools and formality vary by business size. Analyzing historical data and integrating high-quality real-time data are critical for effective demand planning, as they ensure informed decision-making and eliminate data silos.
Historical sales analysis is the starting point. Before projecting forward, you need a clean view of what has actually sold, when it sold, and under what conditions. This means looking at unit velocity by SKU, identifying seasonal patterns, and separating baseline demand from demand that was driven by promotions, price changes, or one-off events. Historical data that has not been cleaned for anomalies will produce distorted forecasts. Automating data cleansing reduces manual errors and allows planners to focus on strategic decision-making rather than data entry.
External factor integration adjusts the baseline for what is different going forward. Planned promotions, new product launches, channel expansion, market trends, and supply chain lead-time changes all influence how much to order. A demand plan that only looks backward misses the signals that make the future different from the past.
Inventory position assessment connects the forecast to what you already have. The relevant question for a purchase decision is not just how much you expect to sell, but how much you need to buy given what is already in stock, what is on order, and what your reorder lead time is. Skipping this step is one of the most common ways excess inventory accumulates. A team that forecasts correctly but orders without checking current stock levels will double up on units that were already adequately covered.
Review and adjustment cycles keep the plan current. Demand planning is not a monthly exercise that gets filed away. It is a continuous process that should update as new sales data comes in, supply chain conditions change, and the promotional calendar evolves. A plan that was accurate in week one of the quarter may be significantly off by week six if the team has not incorporated new signals. The demand planning cycle is a systematic process involving defining process models, establishing performance metrics and KPIs, and using demand planning software to improve forecasting accuracy and supply chain performance.
Cross-functional alignment prevents the planning process from being undermined by decisions made elsewhere in the business. A sales team that commits to a volume promotion without notifying the planning team, or a marketing team that schedules a product launch without informing procurement, creates demand shocks that the plan cannot absorb because it did not know they were coming. Demand planning works best when it is connected to, not isolated from, the broader business operating rhythm. Market intelligence, which involves gathering and analyzing both external and internal data sources, plays a crucial role in informing demand planning decisions.
Demand planning spans several aspects, with the three primary areas being product portfolio management, statistical forecasting, and trade promotion management. Product portfolio management oversees the entire lifecycle of products, including resource allocation and strategic decision-making, while trade promotion management focuses on planning and optimizing marketing events to drive demand, which is especially important when ordering for Amazon and beyond on Prime Day. End-of-life planning is also essential for managing product transitions and ensuring a seamless phase-out process.
Choosing demand planning software that aligns with your company’s needs is crucial for automating tasks such as statistical analysis for forecasting and tracking KPIs, ultimately supporting more accurate and efficient demand planning.
Demand Planners and Their Role
Demand planners are the analytical minds behind a company’s ability to predict and respond to future demand. Their role is multifaceted: they dive deep into historical sales data, study market trends, and assess a wide range of internal and external factors that could impact demand patterns. Using advanced statistical forecasting techniques—including statistical models and machine learning algorithms—demand planners work to identify trends and project future demand with as much accuracy as possible.
But their job doesn’t stop at crunching numbers. Successful demand planners collaborate closely with sales teams, supply chain managers, and other stakeholders to ensure that the demand plan supports broader business goals. They act as a bridge between data-driven insights and real-world business decisions, helping to align inventory, procurement, and supply chain strategies with the company’s objectives. By continuously monitoring sales data and market conditions, demand planners play a critical role in helping businesses anticipate demand shifts, minimize risk, and stay ahead of the competition.
Role of Technology in Demand Planning
Technology has transformed the demand planning process, making it possible for businesses to analyze vast amounts of data and respond to demand shifts with greater speed and precision. Modern demand planning software, including enterprise resource planning (ERP) systems, enables companies to automate key aspects of the process, from data collection to forecast generation and performance tracking. These tools help businesses track forecast accuracy, monitor inventory levels, and make informed decisions that optimize supply chain operations while keeping an eye on order fulfillment costs and ecommerce fulfillment pricing across a multichannel fulfillment and sales strategy.
Artificial intelligence and machine learning are taking demand planning to the next level. By leveraging these technologies, companies can identify subtle demand patterns, anticipate market changes, and improve forecast accuracy—even in the face of complex or rapidly changing environments. With the right technology in place, businesses can streamline their demand planning process, respond proactively to demand shifts, and ensure that their supply chain remains agile and resilient.
Measuring the Success of Demand Planning
The effectiveness of a demand planning process is best measured by its impact on key business outcomes. Forecast accuracy is a primary metric—how closely did actual sales match the predicted demand? But other indicators are just as important: inventory levels, out of stock rates, and customer satisfaction all provide valuable insights into how well the demand planning process is working.
By tracking these key performance indicators, businesses can pinpoint areas for improvement and refine their approach to demand planning. Effective demand planning leads to lower out-of-stock rates, optimized inventory turnover, and increased customer satisfaction—all of which contribute to stronger financial performance and greater operational efficiency. Ultimately, a successful demand planning process helps businesses allocate resources wisely, reduce costs, and deliver on customer expectations, driving both short-term results and long-term growth.
Scale Faster with the World’s First Peer-to-Peer Fulfillment Network
Tap into a nationwide network of high-performance partner warehouses — expand capacity, cut shipping costs, and reach customers 1–2 days faster.
Explore Fulfillment NetworkCommon Demand Planning Failures in Ecommerce
The failure modes in ecommerce demand planning are fairly consistent across brands, regardless of size. Integrating point-of-sale systems is crucial, as they provide real-time, up-to-date data that enhances demand planning accuracy and enables more agile decision-making.
Over-reliance on sales team input without data validation is one of the most common. Sales optimism is useful for setting aspirational targets. It is a poor basis for inventory purchasing decisions. When demand plans are built primarily from sales team projections rather than historical consumption data, they tend to systematically overestimate, resulting in excess inventory on new or aspirational products.
Treating all SKUs the same forecasting approach ignores the reality that different products require different planning logic. A high-velocity, stable SKU with two years of clean sales history should be planned differently from a new product with no history, or a seasonal item with a short demand window. Applying the same reorder frequency and buffer logic across the entire catalog produces predictable failures at both ends of the velocity spectrum. The supply chain management process relies on accurate demand planning to balance inventory levels and meet customer demand efficiently.
Neglecting supplier lead times in planning calculations means that even an accurate forecast produces the wrong purchase decision if the timing is off. A product with a 12-week supplier lead time needs a demand plan that looks 12 weeks forward at the point of the purchase order, not at the point when inventory is running low. Additionally, economic trends and market shifts can significantly impact demand planning, requiring businesses to stay alert to external factors that influence demand forecasts.
To avoid these failures, it is essential to predict future demand using both statistical and qualitative forecasting methods. Real-time demand sensing enables businesses to make adjustments to forecasts based on current data such as point-of-sale information and web traffic, as well as new sources like weather, infectious disease trends, and government data, helping to detect disruptions and demand influences in near real time.
Frequently Asked Questions
What is demand planning in simple terms?
Demand planning is the process of estimating how much of each product you will sell in a future period and using that estimate to decide what to buy, when to buy it, and how much inventory to hold. It turns a sales forecast into a purchasing and inventory strategy.
Digital enterprise architectures enable the integration of AI and machine learning into demand planning, allowing for real-time data updates and more agile operations.
What is the difference between demand planning and demand forecasting?
Demand forecasting produces a numerical prediction of future sales. Demand planning uses that prediction to make operational decisions: what to order, when to reorder, and how to allocate inventory. Forecasting is an input to planning. Planning is what determines actual inventory outcomes.
Looking ahead, the future of demand planning is rapidly evolving into a technology-driven process that leverages automation, AI, and integrated platforms to deliver more accurate, agile, and strategic forecasting and decision-making.
How does poor demand planning create dead stock?
When planning decisions result in purchasing more inventory than actual demand will absorb, the excess accumulates over time. Units that do not sell within their expected window incur holding costs and eventually require markdown or liquidation. Chronic overplanning across a catalog creates dead stock at a scale that significantly erodes margin.
Effective demand planning not only prevents excess inventory but also helps satisfy customers by ensuring products are available when needed, reducing the risk of lost sales.
How does demand planning affect cash flow?
Every purchase order converts working capital into inventory. If those purchases are well-matched to actual demand, inventory turns efficiently and cash returns quickly. When purchases exceed demand, cash is locked in slow-moving or unsold inventory for longer than planned, reducing the capital available for other uses.
What data is needed for effective demand planning?
The minimum inputs are historical sales data by SKU, current inventory levels, incoming purchase orders, supplier lead times, and a forward-looking calendar of promotions, launches, or other demand-influencing events. More sophisticated processes incorporate market trend data and external factors such as economic conditions or competitive dynamics.
How often should a demand plan be reviewed?
At minimum, demand plans should be reviewed monthly. For fast-moving categories, promotional periods, or businesses with volatile demand, weekly reviews are more appropriate. The plan should update whenever new sales data is available or when a significant change occurs in the business, supply chain, or market conditions.
Implementing automated forecasting, leveraging predictive analytics, and incorporating scenario planning enables businesses to review and adjust demand plans more frequently and accurately, especially in response to sudden disruptions or changing market dynamics.
Written By:
Indy Pereira
Indy Pereira helps ecommerce brands optimize their shipping and fulfillment with Cahoot’s technology. With a background in both sales and people operations, she bridges customer needs with strategic solutions that drive growth. Indy works closely with merchants every day and brings real-world insight into what makes logistics efficient and scalable.
Turn Returns Into New Revenue
Related Articles
How to Introduce P2P Returns Without Breaking CX
Introducing peer-to-peer returns without breaking customer experience is mostly a change-management and trust-design problem, not a technology problem.
Why P2P Requires a Different Mental Model
Introduction Most people misunderstand peer-to-peer returns for the same reason: they evaluate the system through warehouse-first assumptions.
When Warehouse Returns Still Make Sense
A serious returns strategy does not pretend one path fits every return.
What Is JIT Management? Benefits, Risks, and When It Works
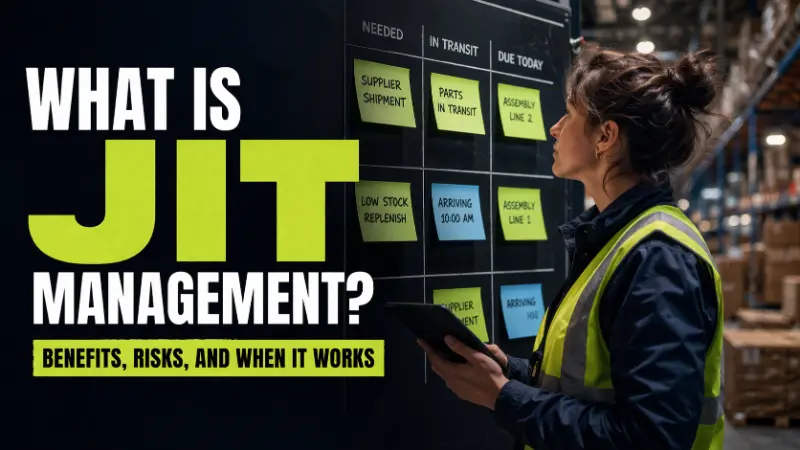
JIT management, short for Just-in-Time, is an inventory and production approach where goods are acquired, produced, or replenished only when they are needed to fulfill demand, rather than being stockpiled in anticipation of future orders. JIT is a strategy for optimizing business operations by streamlining workflows and improving efficiency across the company. The core premise is simple: just-in-time inventory held in a warehouse costs money without generating revenue, so the goal is to have as little of it as possible while still meeting customer demand.
In practice, JIT is not primarily an inventory strategy. It is a bet on supply chain reliability. The JIT inventory methodology is a production and inventory management strategy focused on minimizing inventory levels by producing and ordering goods only as needed. The entire model functions on the assumption that suppliers will deliver on time, that demand can be forecast accurately enough to trigger replenishment at the right moment, and that nothing in the chain between raw material and customer will break. When those assumptions hold, JIT delivers real and measurable operational advantages. When they do not, the absence of buffer inventory means the impact of any disruption is immediate and total.
How JIT Management Works
JIT operates on a pull system rather than a push system. In a traditional push inventory model, a business forecasts what it expects to sell, builds or orders that quantity, and pushes it into stock ahead of demand. In a JIT pull model, production or replenishment is triggered by actual demand signals rather than forecasts. Nothing is made or ordered until something downstream signals that it is needed.
The most well-known implementation is Toyota’s Production System, developed in Japan in the 1950s and 1970s. Toyota used Kanban cards, visual signals that triggered replenishment of components on the production line only when existing supply was depleted. The JIT manufacturing and manufacturing process at Toyota are optimized using the JIT method, which focuses on producing goods only as needed to minimize excess inventory and reduce costs. The goal was to produce exactly what was needed, in exactly the right quantity, at exactly the right time. Toyota received components from suppliers often within hours of installation on the assembly line, eliminating the warehouse of parts that most manufacturers assumed was necessary.
Dell provides the most widely cited modern example. Rather than building computers in advance and hoping customers would buy the configurations in stock, Dell assembled machines only after customers placed orders. Dell uses expected sales to align inventory with demand, ensuring components are ordered and stocked based on anticipated customer purchases. Components were delivered from suppliers in tight windows aligned with the production schedule. This allowed Dell to avoid the inventory obsolescence that plagued competitors who stocked finished goods that were already outdated by the time they sold.
For ecommerce and retail operations, JIT translates into ordering replenishment inventory from suppliers in smaller, more frequent batches timed to current sales velocity, rather than large periodic orders based on forecasted future demand. Inventory management systems and advanced ecommerce shipping software and ecommerce fulfillment software with smart inventory placement help monitor stock levels and reduce inventory waste by providing real-time tracking and automated alerts, ensuring that inventory is replenished only as needed. The warehouse or fulfillment center carries less on hand at any given time, which reduces storage costs, cuts the risk of dead stock, and keeps working capital from being locked in unsold goods.
The mechanics require three things to function: accurate demand forecasting to know when to trigger a replenishment order, reliable suppliers who can deliver within tight lead-time windows, and real-time inventory visibility to know when stock is reaching the reorder point. The importance of time JIT inventory is critical in ensuring timely replenishment, as goods must arrive exactly when needed to avoid stockouts and minimize inventory waste. Remove any one of those and the system begins to fail.
Slash Your Fulfillment Costs by Up to 30%
Cut shipping expenses by 30% and boost profit with Cahoot's AI-optimized fulfillment services and modern tech —no overheads and no humans required!
I'm Interested in Saving Time and MoneySupply Chain Considerations
Implementing a JIT inventory system hinges on the strength and reliability of your entire supply chain. Unlike traditional inventory strategies that rely on buffer stock to absorb shocks, JIT inventory management demands that every link in the chain—from raw materials to finished goods—operates with precision and minimal delay. This means that even minor supply chain disruptions, such as transportation delays or supplier hiccups, can halt production and jeopardize customer satisfaction, which is why robust order fulfillment integrations with marketplaces and shipping carriers are so important for real-time coordination.
To build a resilient JIT inventory management system, businesses must prioritize relationships with reliable suppliers who can consistently deliver on tight schedules. Establishing clear communication channels and performance expectations with suppliers is essential, as is developing contingency plans for unexpected disruptions. For example, identifying alternative suppliers or diversifying sourcing regions can help mitigate the risk of a single point of failure in your supply chain, and addressing key obstacles to building an efficient supply chain helps ensure your lean strategy remains resilient.
Accurate demand forecasting is another cornerstone of effective JIT inventory management. By analyzing sales trends, seasonality, and market shifts, businesses can align production schedules and inventory levels more closely with actual customer demand. This reduces the risk of excess inventory and unsold stock, while ensuring that enough inventory is always available to meet customer orders. Leveraging inventory management software with real-time inventory tracking and automated alerts can further enhance visibility and control, allowing businesses to respond quickly to changes in demand or supply chain conditions.
The Toyota Production System (TPS) exemplifies how integrating continuous improvement and waste reduction into every aspect of the production process—including supply chain management—can yield substantial cost savings and efficiency gains. TPS’s focus on minimizing waste, streamlining inventory movements, and fostering a culture of ongoing improvement has set the standard for JIT inventory systems worldwide. By adopting similar principles, businesses can tailor their JIT strategy to their unique operational needs, driving both production efficiency and customer satisfaction.
For ecommerce businesses, managing a JIT inventory system presents unique challenges. Inventory must often be tracked across multiple sales channels and fulfillment centers, making real-time visibility and coordination even more critical. Implementing robust inventory management software, leveraging order fulfillment services for ecommerce companies, and choosing the right warehousing services provider can automate replenishment, monitor inventory levels across locations, and help manage inventory during demand spikes—ensuring that customer demand is met without accumulating excess stock or incurring unnecessary storage costs.
Ultimately, the success of a JIT inventory management system depends on the ability to manage inventory proactively across the entire supply chain. By investing in reliable supply chain partnerships, leveraging technology for real-time inventory control, and continuously refining supply chain processes, businesses can reduce inventory costs, minimize waste, and improve production efficiency. Staying current with logistics, fulfillment, and supply chain events and educational webinars on ecommerce logistics and multi-channel fulfillment can also inform strategic improvements. This not only enhances customer satisfaction but also provides a competitive edge in today’s fast-paced markets.
The Real Benefits of JIT
The financial case for JIT is straightforward when the conditions support it.
Reduced inventory holding costs are the most direct benefit. Inventory sitting in a warehouse generates costs that accumulate continuously: storage fees, insurance, labor to manage and count it, and the risk of deterioration or obsolescence. Industry estimates consistently place inventory carrying costs at 20 to 30 percent of inventory value per year. A business holding $500,000 in average inventory is spending $100,000 to $150,000 annually just to keep it there. JIT reduces the average inventory on hand, which compresses those costs proportionally. Additionally, JIT helps minimize labor costs by reducing the amount of handling and storage required, streamlining operations and lowering overall labor expenses.
Improved cash flow follows directly. Capital that would have been tied up in excess stock is freed for other uses: marketing, product development, operational improvements, or debt reduction. For growth-stage ecommerce brands where cash flow is often the binding constraint, this is a meaningful advantage. Every dollar not sitting on a shelf is a dollar available to fund growth. By maintaining minimal inventory, JIT helps reduce costs and improve efficiency, ensuring resources are used more effectively across the business.
Reduced dead stock and obsolescence risk is a benefit that compounds over time. Brands that consistently overorder relative to demand accumulate slow-moving inventory that eventually becomes unsellable. JIT’s discipline of ordering to actual demand rather than optimistic forecasts prevents the structural overbuying that generates dead stock. For product categories with short life cycles, like consumer electronics, seasonal apparel, or trend-driven goods, this is operationally significant. Regularly identifying and clearing obsolete inventory is also crucial for optimizing storage space, reducing costs, and improving overall inventory efficiency.
Improved quality control emerges as a secondary benefit, particularly in manufacturing contexts. When production runs are smaller and more frequent, defects are identified faster because there is less in-process inventory to absorb and conceal them. A production defect on a batch of 100 units is caught after 100 units. On a batch of 10,000 units, it may not surface until the entire batch has moved downstream. JIT practices contribute to minimizing costs and improve efficiency throughout the production process by enabling faster detection and correction of issues.
Looking for a New 3PL? Start with this Free RFP Template
Cut weeks off your selection process. Avoid pitfalls. Get the only 3PL RFP checklist built for ecommerce brands, absolutely free.
Get My Free 3PL RFPThe Risks That Are Systematically Underweighted
The risks of JIT are not theoretical. They are structural, and recent supply chain history has illustrated them at scale.
Supply chain disruption is the defining vulnerability. JIT eliminates the buffer inventory that absorbs shocks. When a supplier misses a delivery, when a port is congested, when a weather event delays inbound freight, or when a carrier capacity crunch extends lead times, a JIT operation has no reserve to draw from. Production halts. Fulfillment pauses. Customer orders cannot ship. The 1997 Aisin fire, which destroyed the sole facility supplying Toyota’s brake valves, nearly brought the entire Toyota production network to a standstill within days because there was no safety stock. The COVID-19 pandemic produced the same phenomenon at global scale, exposing how many industries had adopted JIT principles without building the supplier redundancy and geographic diversification that Toyota spent decades developing alongside its lean practices. Additionally, if demand drops unexpectedly, the lack of buffer inventory can result in unsold inventory that cannot be easily stored or managed—an issue frequently highlighted in news about evolving ecommerce fulfillment networks and partnerships.
Demand forecasting error is amplified, not buffered. In a JIT system, an unexpected demand spike cannot be met from stock because there is no meaningful stock to draw from. When demand exceeds forecast, the response is entirely dependent on how fast the supply chain can accelerate. If supplier lead times are four weeks and demand spikes in week one, customers wait four weeks or go elsewhere. Brands that adopt JIT without significantly investing in forecast accuracy essentially exchange one operational risk for another.
Single-supplier dependency is a concentration risk. JIT typically requires close, reliable relationships with a small number of preferred suppliers to achieve the lead-time precision the model demands. That concentration creates fragility. A supplier experiencing a labor dispute, a quality failure, a financial crisis, or a natural disaster puts the entire JIT-dependent operation at risk. Toyota’s own experience during semiconductor shortages in 2021 and 2022 demonstrated that even decades of supply chain mastery cannot fully immunize against disruption when the failure is systemic across an entire industry.
Loss of volume discounts is a real but often overlooked cost. JIT’s smaller, more frequent orders sacrifice the per-unit pricing advantage that comes with large batch purchases. Depending on the product and supplier relationship, this cost can partially or fully offset the holding cost savings that JIT is supposed to deliver. However, for businesses with limited storage space, the benefits of reducing inventory levels and minimizing the need for additional storage space may outweigh the loss of volume discounts.
JIT also helps optimize storage space by reducing the need for large warehouses, allowing businesses to operate more efficiently and lower their storage costs.
The Contrarian View: JIT Is Widely Misunderstood
One of the most persistent misconceptions about JIT is that its core purpose is to minimize inventory. This framing is wrong, and it is the source of much of the criticism JIT received following supply chain failures during the pandemic. While maintaining minimal inventory is a visible feature of JIT systems, the true goal is to create a responsive, efficient process that meets customer demand without unnecessary waste.
Toyota did not design JIT to minimize inventory. It designed JIT to expose waste and eliminate the root causes of production problems. Inventory, in Toyota’s framework, is a form of waste because it masks defects, covers up process inefficiencies, and hides supplier reliability issues. JIT forces problems to the surface by removing the buffer that conceals them. When a supplier is chronically unreliable, a JIT system will surface that unreliability immediately. In a high-inventory environment, the same unreliability can remain invisible for months because excess stock absorbs the delays. Just-in-time manufacturing, as developed in the Toyota Production System, focuses on waste reduction and continuous process improvement, not simply on reducing inventory levels.
The companies that adopted JIT principles purely to reduce inventory costs, without building the supplier relationships, process discipline, and continuous improvement culture that Toyota spent decades developing, were running a cost-reduction program, not a JIT program. They assumed the benefits without accepting the systemic commitments that make those benefits sustainable. When disruptions hit, they had the vulnerabilities of JIT without its underlying resilience mechanisms.
This matters for ecommerce brands evaluating JIT because the question is not whether to order less inventory. It is whether the entire operational and supplier ecosystem can support a lean model reliably enough to justify the absence of a buffer. For Amazon-focused brands, this includes aligning JIT practices with FBA constraints and maintaining a healthy Inventory Performance Index (IPI) score so storage limits do not undermine lean inventory strategies.
Scale Faster with the World’s First Peer-to-Peer Fulfillment Network
Tap into a nationwide network of high-performance partner warehouses — expand capacity, cut shipping costs, and reach customers 1–2 days faster.
Explore Fulfillment NetworkJIT in Ecommerce vs Manufacturing
JIT originated in manufacturing, where production cycles are relatively predictable, supplier relationships are long-term and deeply integrated, and demand signals from the assembly line are clear and continuous. These conditions are not replicated in most ecommerce environments, particularly in warehouse processes like pick and pack fulfillment for ecommerce orders.
Manufacturing JIT works because the trigger for replenishment is a physical signal in a controlled production process. Ecommerce JIT is working against consumer demand variability, longer and less predictable supplier lead times, seasonal and promotional spikes, and a customer base that expects immediate fulfillment regardless of what is in stock.
That does not mean JIT principles have no application in ecommerce. For stable, high-velocity SKUs with reliable supplier lead times, ordering in smaller, more frequent batches rather than large quarterly positions reduces holding costs and dead stock risk. For perishable goods or products with short shelf lives, JIT is essentially a necessity rather than a choice. For brands with limited warehouse space, reducing on-hand inventory through tighter replenishment cycles is operationally valuable. JIT also helps businesses optimize storage space by minimizing the amount of inventory kept on hand, freeing up valuable warehouse capacity and improving overall efficiency, which may eventually justify shifting from an in-house warehouse to a third-party logistics (3PL) provider.
Where JIT creates acute risk in ecommerce is in seasonal or trend-sensitive products where demand is inherently spiky and unpredictable, or where supplier lead times are long enough that a reorder triggered by current demand cannot arrive before stock depletes. The classic scenario: a brand operating near-JIT gets a viral social moment that drives 10x normal order volume. Supplier lead time is six weeks. The brand stocks out within 48 hours and spends six weeks apologizing to customers and watching competitors capture the demand they generated.
The practical ecommerce application of JIT is typically a hybrid: lean inventory positions on stable SKUs, with deliberately maintained safety stock on seasonal items, promotional inventory, and SKUs where the cost of a stockout in lost sales and customer lifetime value exceeds the carrying cost of the buffer. Effective time inventory management is crucial here, as coordinating replenishment and fulfillment based on real-time demand and operational timing helps minimize costs and increase efficiency and can even help turn ecommerce order fulfillment into a profit driver. The goal is not purity of the JIT model. It is the right amount of inventory for each SKU given its demand profile and supply chain reliability.
Frequently Asked Questions
What does JIT management mean?
JIT stands for Just-in-Time. JIT management is an inventory and operations approach where goods are ordered, produced, or replenished only when they are needed to fulfill actual demand, rather than being stocked in advance. The goal is to minimize inventory on hand while still meeting customer orders without delay.
Where did JIT originate?
JIT was developed as part of Toyota’s Production System in Japan in the decades following World War II. Toyota refined the approach through decades of supplier relationship building, process discipline, and continuous improvement culture. It became widely adopted in manufacturing globally during the 1980s and has since been adapted for retail and ecommerce contexts.
What are the main benefits of JIT inventory management?
The primary benefits are reduced inventory holding costs, improved cash flow from freeing capital previously tied up in stock, lower risk of dead stock and obsolescence, and greater operational efficiency. In manufacturing, JIT also tends to surface quality defects faster because smaller batch sizes make problems immediately visible.
What are the biggest risks of JIT?
The defining risk is supply chain disruption. JIT eliminates the buffer inventory that absorbs delays, so any failure in the supply chain, whether a supplier issue, a transportation delay, or a demand spike, has an immediate and direct impact on fulfillment. Overreliance on demand forecast accuracy, single-supplier concentration, and loss of volume discount pricing are additional structural risks.
Does JIT work for ecommerce businesses?
JIT principles can be applied in ecommerce, but rarely in their pure form. Ecommerce demand is more variable than manufacturing production schedules, and supplier lead times are often too long to support true JIT replenishment for all SKUs. Most ecommerce operations benefit from a hybrid approach: lean inventory positions on stable, predictable SKUs and deliberately maintained safety stock on seasonal, trend-sensitive, or high-value items where stockout costs are significant, especially for brands evaluating their Shopify order fulfillment options and 3PL strategies.
How is JIT different from just-in-case inventory management?
Just-in-case inventory management is the traditional approach of holding safety stock and buffer inventory to protect against demand variability and supply chain disruption. JIT replaces that buffer with reliable supply chains and accurate demand signals. JIT prioritizes cost efficiency and eliminates waste. Just-in-case prioritizes service continuity and resilience. Most sophisticated operations today use elements of both depending on the product and risk profile.
What conditions need to be in place for JIT to work effectively?
JIT requires accurate demand forecasting, reliable suppliers with consistent lead times, real-time inventory visibility, and strong supplier relationships. It also requires an organizational commitment to continuous improvement and the process discipline to identify and address problems before buffer inventory can mask them. Businesses without these foundations in place are taking on JIT’s risks without the operational infrastructure to manage them.
Written By:
Indy Pereira
Indy Pereira helps ecommerce brands optimize their shipping and fulfillment with Cahoot’s technology. With a background in both sales and people operations, she bridges customer needs with strategic solutions that drive growth. Indy works closely with merchants every day and brings real-world insight into what makes logistics efficient and scalable.
Turn Returns Into New Revenue
Related Articles
How to Introduce P2P Returns Without Breaking CX
Introducing peer-to-peer returns without breaking customer experience is mostly a change-management and trust-design problem, not a technology problem.
Why P2P Requires a Different Mental Model
Introduction Most people misunderstand peer-to-peer returns for the same reason: they evaluate the system through warehouse-first assumptions.
When Warehouse Returns Still Make Sense
A serious returns strategy does not pretend one path fits every return.
What Is Dead Stock? Causes, Risks, and How to Avoid It
In this article
21 minutes
- What Dead Stock Actually Is
- The Upstream Causes Most Brands Miss
- The Financial Impact: What It Actually Costs
- The Contrarian View: Dead Stock Is Not Always a Failure
- Industry-Specific Challenges
- Prevention: Where the Real Work Happens
- Creating a Dead Stock Prevention Culture
- What to Do When Dead Stock Has Already Accumulated
- Conclusion
- Frequently Asked Questions
Dead stock is inventory that has not sold and is no longer expected to sell. It sits in warehouse space, generates no revenue, and accumulates costs every day it remains. For ecommerce brands and operations leaders, dead stock is one of the most financially damaging conditions a business can carry, precisely because it builds slowly and quietly until its weight becomes impossible to ignore.
The important reframe is this: dead stock is not primarily a warehouse problem. It is the result of upstream decisions that were made weeks, months, or even purchasing cycles before the product ever arrived on a shelf. Understanding dead stock means understanding how MOQ commitments, demand forecasting failures, and purchasing behavior compound over time into inventory that has no path to revenue.
What Dead Stock Actually Is
Dead stock refers to products that are new, often still in original packaging, but have no realistic prospect of selling at or near their original price. This distinguishes it from returned inventory, which came back from customers and may be resalable, and from safety stock, which is intentional reserve inventory held against demand uncertainty.
A product becomes dead stock when the conditions that made it purchasable no longer exist. The trend moved on. The season ended. A newer version replaced it. The marketing push that was supposed to drive demand never materialized. The demand forecast that justified the purchase order turned out to be significantly wrong.
In the fashion and sneaker industry, the term “deadstock” carries a different meaning entirely. In that context, deadstock refers to unworn, discontinued shoes or apparel still in original condition, often valued precisely because of their rarity. Deadstock items in these markets are typically brand-new, unsold inventory, often with their original tags attached, which makes them more desirable and authentic, especially in resale and vintage markets. In fashion, deadstock fabric refers to unsold, past-season fabrics—often leftover from previous collections—that can be repurposed or sold at a discount. These fabrics are valuable resources for designers and manufacturers looking to reduce waste and create unique pieces. That secondary market meaning is a reminder that inventory with no demand in one channel can sometimes find demand elsewhere, a point worth returning to when discussing remediation.
Slash Your Fulfillment Costs by Up to 30%
Cut shipping expenses by 30% and boost profit with Cahoot's AI-optimized fulfillment services and modern tech —no overheads and no humans required!
I'm Interested in Saving Time and MoneyThe Upstream Causes Most Brands Miss
Dead stock is treated too often as an inventory management failure when it is actually a purchasing and planning failure that shows up in the warehouse and impacts the entire company.
Minimum order quantities are one of the most direct structural causes. When a supplier requires a company to order 1,000 units to secure a viable unit cost, and realistic customer demand for that SKU is 400 units over the same period, 600 units of potential dead stock are created at the moment the purchase order is signed. The problem is not that the product failed to sell. The problem is that the MOQ committed the company to inventory it could not absorb. This happens repeatedly across catalogs when companies accept supplier MOQs without stress-testing them against actual demand data.
Demand forecasting errors are the other primary cause. Over-ordering and failing to accurately predict how much inventory is needed to meet customer demand are leading reasons companies accumulate dead stock. When a company overestimates how many units of a product will sell in a given period, it orders more than demand can absorb. Inaccurate demand forecasting can lead to dead stock accumulation when businesses miscalculate future demand. Optimistic sales projections, particularly for new products without historical data, new colorways or variants added speculatively, or products tied to a trend that the company assumed had more runway than it did, all generate excess stock that ages into dead stock. Poor forecasting is not always avoidable, but systematic overconfidence in projections is a pattern that can be identified and corrected.
Seasonality without discipline creates predictable dead stock cycles. Seasonal products have defined sell-through windows. If a company orders too much of a seasonal item, or orders it too late in the season, the inventory arrives into a closing window and cannot be cleared before demand drops off. Failing to adjust purchasing patterns for seasonal fluctuations can result in excess stock that remains unsold. What remains becomes dead stock unless it can be carried to the following season, at additional holding cost, with the risk that demand does not return at the same level. Seasonality factors play a crucial role in dead stock creation, particularly when companies do not align inventory with seasonal customer demand.
Supply chain disruption responses generated significant dead stock across many companies during and after 2020 to 2022. Companies often over-order safety stock to meet future needs, which can become excess inventory if demand normalizes. Brands that panic-ordered large quantities to buffer against supply uncertainty found themselves holding excess inventory after demand patterns normalized. Safety stock acquired under uncertainty became structural overstock when the threat passed. Supply chain disruptions have emerged as a significant contributor to dead stock in recent years.
Returns that never reenter the sellable inventory pool contribute to dead stock accumulation in a less obvious way. A returned item that is not inspected, refurbished, and relisted promptly may sit in a returns queue until its resale window closes. At scale, poor returns processing is a reliable secondary source of dead stock.
It is important to note the difference between slow-moving products and dead stock: slow-moving products may eventually sell, while dead stock remains unsold and completely stagnant. Monitoring slow-moving products helps companies prevent them from turning into dead stock and optimize inventory turnover.
The Financial Impact: What It Actually Costs
The direct cost of dead stock starts with the capital tied up in unsold units. For a brand that purchased 500 units of a product at $40 each, $20,000 in working capital is frozen the moment those units become unsellable. The most obvious cost of dead stock is lost revenue, and these direct costs immediately impact the company’s account and overall profitability. That capital cannot fund new product development, marketing campaigns, or reorders of faster-moving SKUs. It is simply gone from productive use.
Carrying costs compound the problem. A company’s total carrying costs can tie up as much as 20% to 30% of its capital at any given time. Carrying costs typically range from 15% to 30% of the inventory’s value annually, including expenses related to warehouse space, insurance, taxes, and opportunity costs of capital. Industry estimates consistently put inventory holding costs at 20 to 30 percent of inventory value per year. That means $20,000 in dead stock is generating $4,000 to $6,000 in annual holding costs on top of the sunk purchase cost, covering warehouse space, utilities, insurance, and the labor required to manage and count stock that is not moving. The longer an item is stored before selling it, the higher the item’s carrying costs become.
For brands on third-party fulfillment platforms, particularly Amazon FBA, the financial penalty is more explicit. Amazon’s long-term storage fees and aged inventory surcharges impose escalating charges on units that have not sold within defined windows. Dead stock in an FBA warehouse does not just sit passively. It generates monthly charges that erode the residual value of the inventory until the cost of removal or disposal exceeds the cost of simply paying the ongoing fees.
When dead stock is finally cleared, the mechanism for doing so almost always destroys margin. A clearance sale at 50 percent off recovers half the purchase cost, but none of the carrying cost already absorbed. Liquidation at pennies on the dollar recovers a fraction of the investment. Donation to charity provides a potential tax benefit but no revenue. Write-off closes the accounting but confirms the total loss. Dead stock not only costs money to obtain, but also costs you the profit from its sale that you were counting on.
A practical example illustrates the full picture. An electronics brand purchases 300 units of a tablet accessory for $50 each, forecasting strong demand based on early sales of a related product. The accessory sells 80 units in the first two months. Sales stall. The product sits for six months before the brand accepts it is unlikely to move at full price. By that point, the 220 unsold units represent $11,000 in frozen capital. Six months of carrying costs at 25 percent annually add approximately $1,375. A clearance sale at 40 percent of original price recovers roughly $4,400. The total loss on a purchase that seemed reasonable at the time is approximately $8,000, before accounting for the warehouse space consumed and the staff time invested in auditing, relisting, and eventually clearing the inventory.
Dead stock can lead to significant opportunity costs as money and resources tied up in dead inventory are not available to invest in inventory that could bring in more profits. This creates opportunity costs for the company, as warehouse space could otherwise be dedicated to new product lines or value-added services that might generate higher profit margins. Dead stock also creates multiple cascading inefficiencies throughout warehouse operations, complicating inventory counts and increasing the likelihood of errors in inventory records.
Looking for a New 3PL? Start with this Free RFP Template
Cut weeks off your selection process. Avoid pitfalls. Get the only 3PL RFP checklist built for ecommerce brands, absolutely free.
Get My Free 3PL RFPThe Contrarian View: Dead Stock Is Not Always a Failure
Most inventory advice treats dead stock as a symptom of poor management, and in the majority of cases that framing is accurate. But a more nuanced view recognizes that some dead stock is the cost of doing business with range and ambition.
A brand that never generates dead stock is a brand that never takes a position on a new product, never tests a new category, and never bets on a trend. Pure conservatism in purchasing protects against dead stock but also limits upside. The goal is not zero dead stock. The goal is dead stock at a rate that reflects rational risk-taking rather than systematic forecasting failure or structural overcommitment via MOQ.
The brands that manage this best treat dead stock as a measurable operational metric with an acceptable threshold. They set a target for dead stock as a percentage of total inventory value, monitor it regularly, and investigate when it rises above that threshold. Regular dead stock takes—inventory audits focused on identifying unsellable or slow-moving inventory items—help companies pinpoint which inventory items have become dead stock and require action to minimize storage costs and optimize warehouse space. They distinguish between dead stock generated by deliberate product bets that did not pay off and dead stock generated by preventable errors in purchasing or demand planning. The first is a cost of growth. The second is waste.
Industry-Specific Challenges
Dead stock is a universal risk, but its causes and consequences can vary dramatically depending on the industry. In fashion, for example, the rapid turnover of trends means that stock can become dead almost overnight if consumer preferences shift or a season ends unexpectedly. Retailers in this space often face the challenge of predicting which styles will resonate, and overordering on a trend that fizzles can leave them with racks of unsellable merchandise. To mitigate this risk, many fashion brands are adopting “buy now, wear now” models, focusing on smaller, more frequent orders that align closely with current demand.
In the electronics industry, the pace of technological innovation creates a different kind of dead stock risk. New product launches and frequent upgrades can render existing inventory obsolete before it ever reaches customers. For electronics manufacturers and retailers, designing products with modular components or upgradable features can help extend the market life of inventory and reduce the volume of dead stock. Additionally, close monitoring of product life cycles and timely markdowns on older models are essential strategies for minimizing losses.
Understanding these industry-specific challenges is crucial for developing targeted approaches to dead stock management. By tailoring strategies to the unique risks of their sector, businesses can more effectively avoid accumulating dead stock and protect their bottom line.
Prevention: Where the Real Work Happens
Preventing dead stock requires changes at the purchasing and planning stage, not at the warehouse stage.
Right-sizing MOQ commitments is the most impactful single intervention for many brands. Before accepting a supplier’s minimum order quantity, a team should explicitly calculate how many weeks or months of supply that MOQ represents against realistic demand. If the MOQ requires more than 10 to 12 weeks of supply at current velocity, the risk of dead stock creation is meaningful. Negotiating lower MOQs, consolidating orders across SKUs to meet supplier thresholds, or accepting a higher per-unit cost at a lower quantity are all viable alternatives to systematically overbuying.
Demand planning grounded in data rather than optimism reduces the forecasting error that generates dead stock. This means using historical sales velocity as the primary input, applying seasonal adjustment factors based on past seasonal patterns, and treating new product projections with explicit conservatism until sales data exists. It also means separating the demand plan from the sales team’s revenue targets, which are aspirational, and building the purchasing plan around the more conservative of the two. Using inventory management software enables companies to make informed decisions about how much inventory to purchase and when, helping to prevent dead stock. Accurate demand forecasting, supported by real-time inventory visibility and analytics, is essential to prevent over-ordering and to better align inventory with future needs.
Variant discipline matters particularly for apparel, footwear, and consumer goods brands that offer products in multiple sizes, colors, or configurations. Each variant is its own SKU with its own demand profile. Adding variants speculatively, particularly colorways or sizes that have not been validated by customer data, creates multiple low-velocity SKUs where MOQ applies per variant. The resulting inventory commitment across the full variant matrix is frequently the origin of significant dead stock.
Early identification of slow-moving inventory gives a brand the maximum window to intervene before a slow-mover becomes unsellable. Inventory aging reports, velocity alerts set at 30 and 60 days of below-target turnover, and regular SKU-level reviews allow operations teams to begin clearance activity while the product still has market value. Regular inventory audits and predictive analytics can help identify products at risk of becoming dead stock by spotting early warning signs of declining demand, allowing proactive inventory adjustments. A product that has been moving slowly for 30 days can often be cleared at a modest discount. The same product at 120 days may require 60 to 70 percent off to move at all.
Managed use of alternative channels extends the clearance options available. Liquidation partners, outlet marketplaces, bundle strategies with faster-moving products, and B2B bulk buyers all represent channels that can absorb inventory at below-retail prices while recovering more than write-off value. For brands with charitable giving programs, donation of dead stock provides a tax benefit while clearing warehouse space, though the accounting treatment varies and should be confirmed with a tax advisor.
Adopting a Just-in-Time (JIT) approach can further reduce the risk of overstocking by ordering only as needed to meet existing demand, ensuring inventory levels are closely aligned with future needs.
Creating a Dead Stock Prevention Culture
Building a culture that actively works to avoid dead stock starts with organization-wide awareness and shared responsibility. Every team—from procurement and sales to marketing and warehouse operations—should understand how excess inventory and slow-moving items impact the company’s financial health and warehouse space. Regular training sessions and transparent communication about the direct and indirect costs of dead stock can help foster this awareness.
Leveraging inventory management software is a key step in this process. These tools provide real-time visibility into inventory levels, highlight slow-moving items, and generate alerts when stock is at risk of becoming dead. Regular inventory audits, supported by this technology, enable teams to identify patterns early and take corrective action—whether that means launching targeted clearance sales, bundling slow sellers with popular products, or exploring alternative sales channels such as online marketplaces or B2B buyers.
Aligning incentives is another powerful lever. For example, rewarding sales teams for moving older inventory before introducing new products encourages a focus on overall inventory health rather than just top-line sales. Cross-departmental meetings to review inventory performance and discuss strategies for improvement ensure that everyone is accountable for minimizing dead stock. By embedding these practices into daily operations, businesses can create a proactive culture that prioritizes inventory efficiency and reduces the risk of accumulating dead stock.
What to Do When Dead Stock Has Already Accumulated
For brands that are already holding significant dead stock, the priority is to stop the compounding. Every additional month of carrying costs reduces the recoverable value of the inventory. Acting early, even at a loss, is almost always better than waiting for a better opportunity that does not materialize. Utilizing alternative sales channels such as eBay, Amazon FBA, or specialized liquidation partners can help move dead stock and recover some value.
A structured clearance plan that sequences options from highest to lowest recovery is more effective than reacting opportunistically. Start with promotional pricing through your own channels, where margin recovery is highest. Move to bundle strategies that attach slow-moving units to fast-moving products without discounting either individually—this product bundling, or kitting, increases perceived value and can help recover some of the initial investment. Effective handling of dead stock can also involve offering deep discounts, selling products at a lower price through clearance sales or alternative channels to attract bargain shoppers, or liquidation. Donating dead stock can provide tax benefits and improve the company’s public image. Returning unsold inventory to suppliers or creating partnerships with other companies for co-branded promotions are additional strategies for offloading dead stock.
The accounting treatment for dead stock write-offs and write-downs has tax implications that vary by jurisdiction and business structure. The write-down reduces the book value of inventory, which affects reported gross margin and COGS. In some cases it creates a taxable loss that offsets income. Operations leaders should coordinate with their finance and tax team before executing large dead stock write-offs to ensure the timing and accounting treatment are optimized.
Scale Faster with the World’s First Peer-to-Peer Fulfillment Network
Tap into a nationwide network of high-performance partner warehouses — expand capacity, cut shipping costs, and reach customers 1–2 days faster.
Explore Fulfillment NetworkConclusion
In conclusion, dead stock is a costly challenge that affects businesses of all sizes and industries, tying up valuable warehouse space, eroding profit margins, and limiting the ability to invest in new opportunities. The root causes—ranging from inaccurate demand forecasting and overordering to poor sales strategies—underscore the need for better inventory management and the adoption of inventory management software to enhance visibility and control.
By fostering a culture that values accurate demand forecasting, regular inventory reviews, and cross-functional collaboration, companies can make more informed purchasing decisions and respond quickly to shifts in market demand. Exploring alternative sales channels, such as online marketplaces, and considering charitable donations for unsold inventory can help recover some value from dead stock while freeing up space for new inventory.
Ultimately, effective dead stock management is about more than just clearing out unsold items—it’s about building a resilient supply chain and a business that can adapt to changing market conditions. With the right strategies and tools in place, businesses can protect their profit margins, optimize warehouse space, and ensure long-term sustainability and growth.
Frequently Asked Questions
What is dead stock in ecommerce?
Dead stock refers to inventory items that remain unsold and are considered unsellable, meaning they are unlikely to sell at a price that recovers the cost of goods. These inventory items typically consist of brand-new, unused products that have lost their market demand due to factors like trend shifts, poor forecasting, overordering, or the end of a seasonal window. Dead stock can also include damaged items, incorrect deliveries, leftover seasonal products, or expired raw materials.
What causes dead stock?
The most common causes are demand forecasting errors that lead to overbuying, over-ordering, MOQ commitments that force brands to purchase more inventory than demand can absorb, poor variant management that creates low-velocity SKUs, and seasonality mismanagement where inventory arrives too late in the selling window to be cleared. Over-ordering leads to dead stock accumulation when businesses order excess inventory without understanding future sales needs. Inaccurate demand forecasting can cause businesses to miscalculate future demand, resulting in excess inventory that becomes dead stock. Seasonality factors play a crucial role in dead stock creation, particularly when businesses fail to adjust their purchasing patterns to accommodate seasonal fluctuations in demand. Supply chain disruptions that prompted large precautionary orders have also been a significant structural cause for many brands in recent years, as companies over-order safety stock that later becomes excess inventory.
How does dead stock affect cash flow?
Dead stock locks working capital into inventory that generates no revenue. That capital cannot be reinvested in faster-moving products, marketing, or operations, resulting in an opportunity cost as resources are tied up in dead inventory instead of being used for more profitable inventory. Carrying costs continue to accumulate on unsold inventory at a rate of 20 to 30 percent of inventory value per year, meaning dead stock actively erodes cash flow beyond the initial purchase cost. Additionally, inventory that does not turn over within a fiscal year is typically classified as a liability in the company’s account, further impacting overall financial health.
How is dead stock different from slow-moving inventory?
Slow-moving products are items that sell below target velocity but still have a realistic chance of being sold at or near full price. In contrast, dead stock refers to inventory that remains completely stagnant and unsellable, with no realistic demand left. The distinction is important: while slow-moving products may eventually sell and can often be recovered through promotion or repositioning, dead stock typically requires clearance, liquidation, or write-off.
Can dead stock be sold or recovered?
In most cases, some recovery is possible. Selling products at a lower price through clearance sales or discount sections can help offload dead stock and attract bargain shoppers. Utilizing alternative sales channels such as eBay, Amazon FBA, or specialized liquidation partners can also help move dead stock and recover some costs. Bundle strategies, where dead stock units are combined with popular items, can help recover some of the initial investment without a headline discount. Liquidation partners and outlet marketplaces recover less but move volume at scale. Charitable donation provides a potential tax benefit in exchange for no revenue. The earlier recovery action is taken, the higher the recovery rate.
How do you prevent dead stock from building up?
Prevention starts at the purchasing stage. Right-sizing MOQ commitments against realistic demand data, using historical sales velocity rather than optimistic projections as the foundation for demand plans, adding new variants conservatively, and setting inventory aging alerts that trigger review before slow-movers become unsellable are the most reliable prevention strategies.
Leveraging inventory management software can help track stock levels in real time and prevent dead stock accumulation. Predictive analytics can identify products showing early warning signs of declining demand, enabling businesses to make informed decisions and proactively adjust inventory before items become dead stock. Regular inventory audits are also important, as they help identify slow-moving items early, allowing for timely action.
Regular SKU-level performance reviews ensure that underperforming products are identified and addressed before carrying costs compound.
What is the difference between dead stock and deadstock in fashion?
In general ecommerce and retail operations, dead stock refers to unsold inventory with no realistic path to sale at original price, representing a financial liability. Dead stock can include seasonal products, outdated technology, perished goods, overordered merchandise, and unsuccessful product lines.
In the fashion and sneaker industry, “deadstock” (or deadstock fabric) describes unworn, discontinued items or past-season, unsold fabrics leftover from previous collections that can be repurposed or sold at a discount. These deadstock items often retain their original tags, indicating they are brand-new and unused, which makes them more desirable and authentic, especially in the resale and vintage markets. The same word describes opposite conditions: worthless excess in one context and premium scarcity in another.
Written By:
Indy Pereira
Indy Pereira helps ecommerce brands optimize their shipping and fulfillment with Cahoot’s technology. With a background in both sales and people operations, she bridges customer needs with strategic solutions that drive growth. Indy works closely with merchants every day and brings real-world insight into what makes logistics efficient and scalable.
Turn Returns Into New Revenue
Related Articles
How to Introduce P2P Returns Without Breaking CX
Introducing peer-to-peer returns without breaking customer experience is mostly a change-management and trust-design problem, not a technology problem.
Why P2P Requires a Different Mental Model
Introduction Most people misunderstand peer-to-peer returns for the same reason: they evaluate the system through warehouse-first assumptions.
When Warehouse Returns Still Make Sense
A serious returns strategy does not pretend one path fits every return.
What Is a Backorder? How It Impacts Ecommerce Inventory and Customer Experience
In this article
17 minutes
- What a Backorder Actually Means in Practice
- Backorder vs. Out of Stock: A Meaningful Distinction
- The Revenue vs. Customer Experience Tradeoff
- The Contrarian View: Backorders Are Not Always Conservative
- What Happens to Inventory Management During a Backorder
- Storage and Warehouse Management During Backorders
- How to Communicate With Customers During a Backorder
- Minimizing Backorders Over Time
- Frequently Asked Questions
A backorder happens when a customer places an order for a product that is not currently in stock, and the business accepts that order with the intent to fulfill it once inventory arrives. What does backorder mean? A backorder means the product is temporarily unavailable but can still be purchased, with fulfillment expected once inventory is replenished. Backordered products are items that are sold out but expected to be restocked within a certain timeframe. When an item is backordered, it is temporarily unavailable, but customers can still purchase it, and the business will ship it once new stock arrives.
For ecommerce brands, backorders are often framed as a way to keep revenue flowing during a stockout, but that framing skips over a more uncomfortable reality: accepting a backorder is a promise, and the customer on the other side is measuring whether you keep it.
Done well, backorder management preserves demand and buys time to restock. Done poorly, it converts a supply chain problem into a customer experience problem, and the damage from the second problem tends to outlast the first.
What a Backorder Actually Means in Practice
When a customer places an order on a backordered item, a transaction is completed and revenue is collected against inventory that does not yet exist. The business logs a sale, but fulfillment is deferred. The customer expects to receive the product by a specific date, typically communicated at checkout. Everything between that moment and the actual delivery is the backorder window, and it is operationally fragile. It is important to inform customers and focus on updating customers about the backorder status and expected shipping dates to maintain transparency and trust.
Backorders happen when product demand exceeds available inventory. Supply chain disruptions, raw material shortages, demand spikes that outpace forecasts, and low safety stock all contribute. In some cases, they are genuinely unforeseeable. In many cases, they reflect a reorder point that was set too low or a replenishment cycle that did not account for supplier lead times accurately.
A rolling backorder compounds the problem. When the initial restock date slips, the customer’s wait extends, communications have to be updated, and the risk of cancellation rises with every passing week. Transparency in communicating accurate timelines to customers is crucial, as it builds trust and improves customer satisfaction during backorder situations. When an item is backordered, the retailer communicates an estimated delivery date or keeps the customer informed as soon as updates are available. What started as a two-week backorder can stretch into a month-long trust deficit.
Slash Your Fulfillment Costs by Up to 30%
Cut shipping expenses by 30% and boost profit with Cahoot's AI-optimized fulfillment services and modern tech —no overheads and no humans required!
I'm Interested in Saving Time and MoneyBackorder vs. Out of Stock: A Meaningful Distinction
These two terms describe different operational decisions, and treating them as interchangeable creates real business risk. Communicating a product’s availability is crucial: for out of stock items, customers are informed that the product cannot be purchased and there is no estimated restock date, while for backordered items, customers are told the product is temporarily unavailable but will be restocked within a certain timeframe.
An out-of-stock item is unavailable for purchase. The product listing reflects that, and the customer cannot complete a transaction. There is no promise made, no revenue collected, and no customer expectation set. It is a lost sale opportunity, which has a real cost, but it does not create a commitment you might fail to fulfill. An item is out of stock when the seller doesn’t have the item in inventory and has no sure date to restock.
A backordered item, by contrast, is available for purchase even though inventory is zero or insufficient. The business is explicitly telling the customer: we do not have this yet, but we will, and we are accepting your order on that basis. Unlike out of stock items, backordered items have a confirmed plan for restocking, though the date may be estimated, and are expected to be available in a reasonable timeframe.
The critical variable is whether you actually know when inventory will arrive. If a confirmed purchase order and a reliable supplier lead time sit behind the backorder, the commitment is manageable. If the backorder is accepted without clear restock visibility, it is essentially speculation, and customers are bearing the cost of that uncertainty.
A practical rule: if your restocking timeline is confirmed and within a reasonable window (typically under two weeks for most ecommerce contexts), a backorder is defensible. If the timeline is uncertain or extends beyond three weeks, showing the item as out of stock and offering a back-in-stock notification is a more honest and less operationally risky choice. Remember, backordered items are sold out but expected to be restocked within a certain timeframe, while out of stock means there is no sure date for restocking.
The Revenue vs. Customer Experience Tradeoff
The case for accepting backorders is straightforward on paper. You capture demand that would otherwise evaporate, keep revenue flowing, and gather real data on which products customers want badly enough to wait for. Backorders allow customers to reserve a product in advance and ensure the business maintains sales revenue during temporary shortages. However, if you do not manage backorders properly, you risk losing sales due to customers turning to competitors when faced with delays. Backorder revenue can also fund the restock purchase itself, which has cash flow advantages for brands with tight working capital.
The case against is equally clear, but it tends to be underweighted. Customer expectations for delivery speed have tightened significantly. When a customer accepts a backorder with a promised ship date, they have made a specific plan around that timeline. If the date slips, the reaction is not neutral. If customers experience long delays with backorders, they may cancel their order and purchase elsewhere, leading to potential loss of sales. Research consistently shows that a poor delivery experience is one of the highest-impact drivers of customer attrition, and one poor experience can suppress repeat purchase behavior at a rate that exceeds the initial revenue the backorder generated, much like elevated ecommerce return rates quietly erode long-term profitability. Poor backorder management can cause you to lose customers to competitors who can fulfill orders faster, just as failing to address rising ecommerce return rates drives shoppers toward brands that offer a smoother post-purchase experience.
The math here is worth doing explicitly. If your average order value is $80 and your customer lifetime value is $320, accepting a backorder that leads to a cancellation or a deeply dissatisfied customer costs you not just the $80 in potential revenue you might have lost by showing out of stock, but potentially the full $320 in future value. Brands that optimize purely for immediate revenue capture when going out of stock routinely underestimate this downstream effect. Frequent backorders can lead to a loss of customers if they become frustrated with repeated stockouts.
Looking for a New 3PL? Start with this Free RFP Template
Cut weeks off your selection process. Avoid pitfalls. Get the only 3PL RFP checklist built for ecommerce brands, absolutely free.
Get My Free 3PL RFPThe Contrarian View: Backorders Are Not Always Conservative
There is a common assumption that allowing backorders is the cautious move, a way to avoid losing a sale without taking on much risk. In reality, backorders represent a strategic decision that can align with broader business goals, rather than being just an operational workaround. The actual risk profile is inverted.
Showing out of stock is operationally clean. You lose a potential sale, but you make no promises. The customer may return when the product is available. They may sign up for a notification. They may buy a comparable alternative from you. The relationship is not damaged. Backorders can also be used to test and respond to market demand, allowing businesses to gauge customer interest and adjust safety stock levels accordingly, much like a well-designed ecommerce returns program reveals which products or policies are undermining repeat purchases.
Accepting a backorder under uncertain supply conditions is the aggressive move. You are taking on a customer commitment before you have the operational ability to back it up. If your supplier delivers late, your carrier loses a shipment, or your demand forecast was wrong on total volume, the backorder queue does not absorb those shocks quietly. It amplifies them into customer service volume, cancellation requests, and negative reviews that are publicly visible on the exact product pages where you are trying to convert new buyers.
The brands that manage backorders well treat them as a deliberate, time-bounded tactic with clear operational prerequisites, not a default response to running out of stock. Staying current on emerging logistics best practices through ecommerce logistics and fulfillment events can sharpen this strategy further. Backorders can provide better demand insights, helping businesses adjust inventory strategies based on which items frequently go into backorder status.
What Happens to Inventory Management During a Backorder
A backorder is not just a customer-facing event. It creates complexity inside your inventory management system that compounds if not handled carefully. When a backorder is placed, it is typically converted into a sales order for fulfillment once inventory becomes available. The accumulation of these unfulfilled sales contributes to the company’s backlog, which is a key inventory metric tracked in accounting and sales processes.
Once stock arrives, retailers usually prioritize shipping to customers who placed their backorders first, and efficient pick and pack fulfillment processes are essential to ensure those orders are processed accurately and quickly.
When backordered items are recorded, your accounting records show a completed sale against zero available inventory. That gap has to be tracked accurately so that when the replenishment shipment arrives, the system fulfills backorders in the correct sequence before releasing units to new orders. If your warehouse management discrepancies go unnoticed, backorder customers can end up waiting while new orders jump the queue. Managing fulfillment in this context requires careful coordination to ensure backorders are handled efficiently and customer satisfaction is maintained.
Partial backorders add another layer. A customer orders three items, two are in stock and one is backordered. You can ship the available items immediately and hold fulfillment until the third arrives, or you can split the shipment. Both options have cost and experience implications. Partial shipments solve the immediacy problem but create additional shipping costs and the potential for a customer to receive a box that feels incomplete. Holding the full order keeps shipping costs contained but holds in-stock items hostage to a supply chain problem that only affects one SKU. Analyzing historical data on sales trends can help optimize inventory levels and reduce the likelihood of future backorders, though relying solely on past data may not always predict demand accurately.
Safety stock exists precisely to absorb the kind of demand variability that generates backorders. When safety stock is too low relative to demand patterns and supplier lead times, backorders become a recurring operational mode rather than an occasional exception. That is when the cost accumulates at scale. Using real-time inventory tracking helps prevent overselling and reduces the likelihood of backorders.
Managing backorders can increase operational workload due to the need for communication with suppliers and customer notifications, especially when shipment delays or carrier shipment exceptions further extend already sensitive timelines.
Storage and Warehouse Management During Backorders
Effective warehouse management services are a critical, often overlooked, component of managing backorders successfully. When backordered items are expected, the way your storage and fulfillment processes are organized can make the difference between a smooth recovery and a cascade of customer frustration.
A robust warehouse management system should track incoming replenishment shipments and clearly flag which products are allocated to backorders. Designating specific storage areas for backordered items ensures that, once inventory arrives, these products are prioritized for fulfillment in the correct order. This prevents mix-ups where new customer orders are shipped before existing backorders, which can quickly erode trust and create unnecessary service issues.
Implementing a first-in, first-out (FIFO) approach is especially important for backordered items. By fulfilling the oldest backorders first, you maintain fairness and transparency, reducing the risk of customer dissatisfaction. Accurate, real-time inventory levels are essential—not only to avoid overselling but also to keep customers informed about their order status.
Ultimately, strong warehouse management practices during backorders help minimize delays, streamline backorder fulfillment, and maintain customer loyalty even when supply chain issues arise. Leveraging expert insights from educational ecommerce logistics webinars can further refine these practices over time. By proactively organizing your storage and fulfillment processes, you can turn a potential pain point into an opportunity to demonstrate operational excellence and care for your customers.
How to Communicate With Customers During a Backorder
Customer communication is where backorders are won or lost. Customers who are kept informed and given accurate timelines are far more likely to wait. Following best practices in communication, such as proactive updates and transparency, is essential to minimize negative experiences. Customers who receive silence or vague updates after placing an order are far more likely to cancel and leave with a negative impression.
Several communication practices reduce the risk significantly:
- Set the expectation before purchase. The estimated ship date should appear on the product page and in the checkout flow, not just in a post-purchase email. Customers who discover the backorder status after paying feel misled, even if the disclosure was technically present somewhere in the process.
- Send a clear confirmation immediately after order placement. This should include the specific expected ship date, a direct path to contact support, and a straightforward cancellation option. Customers who know they can cancel without friction are less likely to leave a negative review.
- Proactively communicate if the timeline changes. A delayed restock should trigger an immediate notification, not a response to a customer inquiry. Every day a customer waits past a promised date without an update is a day their likelihood of cancellation and their frustration compound together.
- Update the timeline with specificity. “Your order will ship by March 18” is a recoverable update. “We are still working on restocking this item” is not. Vague status updates signal that you do not have operational control of the situation, which is the impression you most need to avoid.
- Proactively update customers about backorder status. Regular, transparent updates—even if there is no new information—help maintain customer trust and satisfaction.
By following these best practices and ensuring effective communication about backorders, you can help maintain customer trust and satisfaction even when delays occur.
Scale Faster with the World’s First Peer-to-Peer Fulfillment Network
Tap into a nationwide network of high-performance partner warehouses — expand capacity, cut shipping costs, and reach customers 1–2 days faster.
Explore Fulfillment NetworkMinimizing Backorders Over Time
Backorders are sometimes unavoidable, but their frequency is largely a function of inventory planning decisions made weeks or months earlier. Setting accurate reorder points using historical sales data and supplier lead times is the foundational step, as set reorder points help prevent backorders by triggering timely replenishment before stockouts occur. However, while trying to avoid backorders, businesses should also be cautious of excess inventory, which can lead to overstocking and unnecessary holding costs. Balancing inventory levels is crucial, and managing excess stock ensures you have enough to meet unexpected demand without tying up too much capital. Setting safety stock levels can help businesses manage unexpected demand spikes and reduce backorders, while regularly monitoring stock levels of popular items helps ensure timely replenishment and prevents backorders. The safety stock buffer has to account for both demand variability and supply variability, not just one of them.
Diversifying suppliers reduces the risk that a single disruption creates a stockout across your full supply of a SKU. If one supplier faces a raw material shortage or production delay, a secondary source with existing onboarding gives you options rather than a forced backorder. Diversifying suppliers can also mitigate risks associated with supply chain disruptions and help manage backorders effectively.
Demand planning that incorporates market trends, promotional calendars, and seasonal patterns prevents the most predictable category of backorders: the demand spike that was visible in advance but not reflected in the replenishment plan. Accurately anticipating future demand helps minimize backorders by ensuring inventory levels align with expected sales. Analyzing market insights, such as real-time data and industry trends, can further improve demand planning and reduce the likelihood of backorders.
Frequently Asked Questions
What is a backorder in ecommerce?
A backorder is when a customer places and pays for an order on an item that is not currently in stock, with the expectation that the business will fulfill it once inventory arrives. The sale is recorded immediately, but fulfillment is deferred until the product is available. Backorders work by allowing customers to purchase out-of-stock items, and the business manages these orders by processing them as soon as inventory is replenished.
What is the difference between a backorder and out of stock?
An out-of-stock item cannot be purchased because inventory is zero and no purchase option is offered. A backordered item can still be purchased even though inventory is zero, because the business has committed to fulfilling the order when stock arrives. The key difference is whether a customer commitment is made. With backorders, customers can expect the item to be restocked within a foreseeable future, while out-of-stock items have no such expectation of resupply.
How long do backorders typically last?
Backorder timelines vary depending on the cause and the supplier’s lead time. A demand spike that a supplier can address quickly might resolve in one to two weeks. A supply chain disruption affecting raw materials or manufacturing can extend backorders for months. Communicating a specific, accurate estimated ship date at the point of purchase is more important than the length of the wait.
Do backorders hurt customer satisfaction?
They can, significantly, particularly when the timeline is not communicated clearly or when the promised ship date slips without notice. Customers who are informed proactively and given accurate updates are substantially more likely to wait and remain satisfied. The damage to customer satisfaction is less about the delay itself and more about how the delay is managed.
Should you allow backorders on marketplaces like Amazon?
In most cases, no. Amazon does not formally support backorders and requires that orders ship within the promised delivery window. Accepting orders you cannot fulfill on time on Amazon damages your on-time delivery rate and can trigger account health penalties. Backorders are generally better suited to direct-to-consumer channels where you control the customer experience end to end.
What causes backorders to happen?
Backorders occur when customer demand exceeds available inventory, often due to insufficient stock levels. Demand fluctuations can lead to backorders when the demand for certain products is unpredictable. Supply disruptions can cause delays, leading to backorders. Common causes include low safety stock, inaccurate demand forecasting, supply chain disruptions, supplier delays, and demand spikes driven by promotions or viral attention. Poor reorder point settings relative to actual supplier lead times are a frequent structural cause in growing ecommerce businesses.
How do backorders affect inventory management systems?
Accepted backorders create a recorded sale against zero available inventory, which has to be tracked and reconciled accurately. When an order contains a backordered item, it can’t be packed and shipped immediately due to the lack of physical inventory at the time. This can also create complications with payment processing, especially if payment is only processed at shipping time. In some cases, a partial backorder occurs when only some items in an order are out of stock, requiring inventory management systems to split shipments or postpone fulfillment for those specific items. When new stock arrives, the system must fulfill backorders in sequence before releasing units to new orders. Failures in this process, where new orders fulfill ahead of existing backorders, create customer service problems and operational discrepancies that are difficult to resolve cleanly.
Written By:
Indy Pereira
Indy Pereira helps ecommerce brands optimize their shipping and fulfillment with Cahoot’s technology. With a background in both sales and people operations, she bridges customer needs with strategic solutions that drive growth. Indy works closely with merchants every day and brings real-world insight into what makes logistics efficient and scalable.
Turn Returns Into New Revenue
Related Articles
How to Introduce P2P Returns Without Breaking CX
Introducing peer-to-peer returns without breaking customer experience is mostly a change-management and trust-design problem, not a technology problem.
Why P2P Requires a Different Mental Model
Introduction Most people misunderstand peer-to-peer returns for the same reason: they evaluate the system through warehouse-first assumptions.
When Warehouse Returns Still Make Sense
A serious returns strategy does not pretend one path fits every return.
How to Talk to Your Board About Returns

Returns have quietly become one of the most consequential governance topics in ecommerce, consuming margin, concentrating regulatory risk, and eroding competitive position at a pace that most board materials have yet to accurately reflect. If you are preparing to bring returns into a board conversation for the first time, or trying to elevate it beyond a line item on an operations report, the framing matters as much as the data.
This is not a conversation about warehouse workflows or return portal software. Boards care about margin durability, risk exposure, capital efficiency, and long-term competitiveness. Achieving strategic clarity and alignment between the board level returns strategy and the company’s broader business goals is essential for effective oversight and long-term value creation.
The challenge for any executive walking into that room is reframing returns from something the operations team manages into a structural decision the board needs to make. The board’s primary role is to ensure the returns strategy aligns with the company’s broader business goals.
Why Returns Became a Board-Level Issue
Returns have shifted from an operational detail to a cross-functional strategic issue. That shift did not happen because return volumes spiked in a single quarter. It happened because pressure accumulated across multiple dimensions at once: financial, regulatory, reputational, and competitive.
When the CFO looks at returns, they see silent margin erosion and working capital trapped in slow-moving inventory, recognizing how the ecommerce return rate affects profit margins. When the COO looks at returns, they see inbound congestion, labor volatility, and exception-heavy workflows that overwhelm peak-season capacity. When the CMO looks at returns, they see a customer experience signal that touches loyalty, sustainability perception, and brand trust, all of which can be strengthened through an exceptional returns program that builds loyalty. Understanding customer needs and behaviors is critical for shaping effective return policies, and the underlying corporate culture influences how these policies are developed and implemented. Each lens reveals a different consequence of the same structural problem. Together, they make the case that returns cannot be solved by any single function acting alone.
Alignment across functions is essential, and boards must ensure that marketing-driven lenient return policies are supported by the operations team.
This is the first point worth making in any board conversation: the returns problem is not an operations problem that happened to get big. It is a cross-functional strategic failure that has been misclassified as an operational line item for years.
Make Returns Profitable, Yes!
Cut shipping and processing costs by 70% with our patented peer-to-peer returns solution. 4x faster than traditional returns.
See How It WorksWhat Board Members Are Already Starting to Ask
Some boards are already asking pointed questions about returns, even without a formal agenda item. The questions tend to cluster around three concerns. In these discussions, transparency in board reporting is essential, and it is important to clearly explain complex return cost structures so that all stakeholders understand the underlying drivers and implications.
Why are return costs rising faster than revenue? This is the question that signals a board has started doing the math and recognizes the broader rise of e-commerce return rates. In most ecommerce operations, return volume has grown in lockstep with, or faster than, gross merchandise volume, often tracking with the average ecommerce return rate across categories. But the costs associated with those returns, including inbound freight, warehouse labor, inspection, repackaging, markdown exposure, and fraud, have not been subject to the same operational discipline as outbound fulfillment. The result is a cost line that compounds without a ceiling.
Which portion of this is actually controllable? This is the more sophisticated follow-on question, and it matters because it distinguishes between leadership teams that understand their return economics and those that treat returns as a fixed-cost rounding error. A significant portion of return costs are structural choices, not immutable facts. The routing model, the refund policy, the fraud exposure, the markdown cycle: each of these reflects a decision that can be revisited. Boards that understand this expect executives to have a position.
What happens if regulation moves faster than our systems? This is the question that tends to catch leadership teams off guard, especially as once-standard perks like free ecommerce returns come under pressure. Regulatory pressure on returns is no longer a future consideration for non-US markets only. The EU has already restricted the destruction of unsold goods, required Scope 3 emissions disclosure under the Corporate Sustainability Reporting Directive, and moved toward extended producer responsibility mandates. California is exploring comparable anti-waste rules. The SEC has signaled interest in Scope 3 emissions reporting. Boards that are paying attention to ESG exposure are starting to ask whether returns belong in that conversation, and in most cases the answer is yes.
Anticipating the questions board members might ask can improve the clarity and effectiveness of financial reports.
Preparing for a Board Meeting
Preparing for a board meeting is a crucial step in ensuring that the board can effectively guide the company’s growth strategy and drive long-term value creation. For board members, preparation goes beyond simply reading the agenda—it means engaging deeply with the board materials, understanding the financial model, and identifying the key points that will shape strategic decisions.
The management team plays a critical role in this process by assembling comprehensive, transparent board materials that provide a clear view of the company’s current position, challenges, and opportunities. This includes not only financial metrics and operational data, but also actionable insights that can inform board discussions and support decision making at the highest level. A well-prepared financial model is essential, as it allows directors to evaluate the impact of potential strategic moves on enterprise value and capital allocation.
Board members should approach each meeting with a focus on the company’s strategic priorities, ready to discuss, challenge, and refine the growth strategy. By coming prepared, directors can ask the right questions, provide valuable feedback, and help the management team identify risks and opportunities that may not be immediately apparent. This collaborative approach ensures that the entire board is aligned on the strategic plan and that every decision is grounded in data, insight, and a shared commitment to creating long-term value.
Ultimately, effective preparation transforms board meetings from routine check-ins into high-impact strategy sessions. It empowers both the board and the executive team to make informed, forward-looking decisions that drive progress, strengthen the company’s competitive position, and deliver sustainable growth for all stakeholders.
Convert Returns Into New Sales and Profits
Our peer-to-peer returns system instantly resells returned items—no warehouse processing, and get paid before you refund.
I'm Interested in Peer-to-Peer ReturnsHow to Frame the Board Conversation
The goal is not to give the board a logistics briefing. The goal is to give directors a clear view of a structural risk and a decision to make. The most effective board presentations on returns organize around four sections. Focusing on key areas—such as critical components of the balance sheet or strategic focus points—improves clarity and transparency. Effective board meeting agendas should prioritize strategic topics that drive the company’s long-term vision.
Section One: The Problem Statement
Open with the structural reality, not the operational detail. Returns in ecommerce were never designed for the scale at which they now operate. Policies built for edge cases became default behavior. A warehouse-centric return model that made sense when volumes were low and labor was cheap has become a margin-destroying loop that cannot be optimized into profitability.
The numbers provide context without requiring the board to become logistics experts. Recent research supports these data points: U.S. retail returns hit $890 billion in 2024, the highest level on record. Return fraud grew from $27 billion in 2019 to over $100 billion in 2023. Nearly half of apparel returns never reenter inventory. These are not volatility signals. They reflect structural escalation.
The key message here is simple: the cost trajectory is not correcting itself, and the incremental fixes the industry has deployed, better software, more drop-off locations, stricter policies, have not bent the cost curve, particularly where merchants still rely on broadly advertised free returns in ecommerce. They have made a broken model more comfortable to operate.
Clear and concise summaries in board reports help highlight key points and facilitate better understanding among board members.
Section Two: Financial Impact
Boards respond to numbers framed in strategic terms, not operational averages. The average cost per return across the industry runs roughly $40 when fully loaded for shipping, labor, repackaging, and markdown exposure. That figure represents 17 to 30 percent of the item’s original sale price, before accounting for wasted customer acquisition cost.
The more important framing is capital. Returns trap working capital in slow-moving inventory, generate cash flow volatility that is difficult to model, and create markdown pressure that compounds across seasonal SKUs. For a mid-sized ecommerce operator with meaningful return rates, the aggregate exposure is not a rounding error. It is a material drag on gross margin and a source of unmodeled downside risk that does not appear cleanly in standard financial reporting. In evaluating a board level returns strategy, boards must also consider capital expenditures required for growth initiatives and how equity decisions—such as equity issuance or changes in ownership structure—can affect capital allocation, dilution, and long-term shareholder value.
Boards need to understand that the per-return average is misleading. Returns behave more like tail risk than steady expense. The worst-case scenarios, items that are unsellable, fraudulent, or returned at end of season, destroy value at multiples of the average. That is the risk accumulation the board should be weighing.
Ultimately, the board level returns strategy impacts financial planning by aligning capital expenditure, debt, and operational budgets with long-term growth goals.
Section Three: Strategic Options
There are three honest options to present, and presenting all three is itself a governance act. It signals that the executive team has done the analytical work and is not simply advocating for a predetermined conclusion.
The first option is status quo optimization, which often leans on solutions like Happy Returns’ drop-off return network. This means continuing to invest in returns management software, policy enforcement, carrier consolidation, and fraud detection tools. These investments improve operational efficiency at the margins. They do not change the underlying cost structure. The returns model continues to route all inventory backward through a centralized warehouse before it can move forward again. Cost reduction is incremental at best.
The second option is hybrid adoption, which goes beyond one-size-fits-all policies to resemble a more tailored, perfect e-commerce returns program. This is the most operationally realistic path for most organizations in the near term. It involves rerouting a portion of eligible returns, typically those involving recoverable, high-demand SKUs, directly to the next buyer without passing through a warehouse. The remainder of returns, including damaged, defective, regulated, or end-of-season items, continue through traditional flows. Warehouses remain in operation as exception handlers rather than default endpoints. This approach captures a significant portion of available savings without requiring full infrastructure reinvention. Acquisitions can also be considered as part of a broader strategic approach, allowing the company to integrate new capabilities or technologies that support scalable growth and enhance the returns strategy.
The third option is structural rewrite, which may pair alternative routing with platforms like the ZigZag returns management solution to orchestrate complex flows at scale. This is the long-horizon bet: redesigning return routing as a strategic capability rather than an operational cleanup function. It requires more investment in data infrastructure, SKU eligibility logic, and customer experience design, but it is the path that produces durable competitive advantage as regulatory and cost pressure increases.
The board’s role is to choose the direction of travel. Executives can manage the pace, but the board needs to decide whether this is a business that will lead, follow, or absorb the cost of delay. Developing the organization’s capabilities, especially within the executive team, is essential to ensure the chosen strategy can be executed effectively and sustainably.
Capital allocation priorities include determining whether to reinvest profits into R&D, pursue acquisitions, pay down debt, or return capital to shareholders.
Section Four: Controlled Transition Plan
Boards do not need a full roadmap. They need to know that the executive team has a disciplined, evidence-based approach to change.
The summary version is four steps. First, establish a rigorous baseline: cost per return fully loaded by category, refund cycle time, return rate by SKU, and inventory recovery rate. Without a baseline, every future gain looks anecdotal and ROI cannot be defended. Second, define which SKUs are eligible for alternative routing based on resale stability, packaging durability, return rate, demand signals, and regulatory constraints. Third, run a controlled pilot with a narrow SKU set in a defined geography, and treat it as a live experiment with measurable outcomes. Fourth, build fraud guardrails from the start: photo verification at return initiation, refunds tied to confirmed delivery, and AI-assisted risk scoring for edge cases, supported where appropriate by a returns platform like Return Prime. Guardrails should evolve with the model, not lag behind it.
Effective board level returns strategy requires a focus on strategy execution, ensuring that each step is implemented, monitored, and adjusted as needed. Leadership teams and departments must be held accountable for results, maintaining responsible financial management and compliance throughout the process.
This framing tells the board that change is controlled, not speculative. Execution planning should include setting clear KPIs per initiative, not just company-wide, to provide early indicators of success before lagging results appear.
No More Return Waste
Help the planet and your profits—our award-winning returns tech reduces landfill waste and recycles value. Real savings, No greenwashing!
Learn About Sustainable ReturnsThe Three Scenarios
Boards are responsible for understanding the range of futures the organization might face. On returns, there are three plausible scenarios, and they differ significantly in outcome.
In the best case, widespread adoption of alternative return routing takes hold across the industry. Fifty percent or more of recoverable returns bypass warehouse intake. Return costs shrink materially. Scope 3 emissions decline in measurable ways. Returns become a loyalty and margin lever, with faster refunds driving higher repurchase rates, which drives more sales, which funds further optimization. The business that moved early earns a structural advantage. Investors view this scenario favorably, as it demonstrates the company’s ability to navigate changing market conditions and deliver sustained value through disciplined execution and strategic foresight.
In the middle case, hybrid models dominate. Roughly 30 to 40 percent of returns are rerouted directly, while warehouses handle true exceptions. This scenario still produces significant savings compared to the status quo and reduces regulatory exposure without requiring full infrastructure reinvention. It is the most likely near-term outcome for most organizations, and it is still a material improvement.
In the worst case, regulation outpaces innovation. Stricter return mandates arrive before systems have modernized. Costs rise faster than revenue. Brands face simultaneous compliance risk and margin compression. Returns, which were already a drag, become an acute liability. Late adopters pay the highest price in this scenario because they have normalized inefficiency for the longest period.
The board’s role is to position the organization for the middle case at minimum, while preserving the optionality to reach the best case. Investors want confidence that the company has done the homework, made hard tradeoffs, and can execute effectively across different market cycles.
Why Delay Increases Strategic Risk
This is a point worth making explicitly, and it should be framed as risk accumulation rather than urgency theater.
Every year of delay locks in avoidable cost. The returns model that is in place today will still be in place next year if no structural decision is made. The cost of that inertia compounds. Every year of delay also increases regulatory exposure. The direction of travel on returns regulation is clear, even if the timing is uncertain. Organizations that have not begun modernizing their return infrastructure when regulation arrives will be adapting under pressure rather than on their own terms. Every year of delay normalizes inefficient behavior. Operations teams build workflows, vendor relationships, and muscle memory around a broken model. Unwinding that costs more the longer it runs. And every year of delay weakens competitive position. The brands that begin rerouting returns now will have operational data, fraud models, and customer trust infrastructure that late movers will have to build from scratch under worse cost conditions.
This is not alarmism. It is the compounding effect of structural problems that do not self-correct.
The final step for the board in a board level returns strategy is to act decisively and stress-test the fundamental assumptions on which the strategy is built, ensuring its robustness before execution.
Traditional Returns Are Ending
Ecommerce built a returns system for a smaller internet. Today it’s collapsing under scale. Warehouses can’t absorb the volume, costs keep rising, and retailers are quietly tightening policies. This article explains why the old model is failing and what replaces it.
Read the Returns BibleReturns as a Strategic Lever
The final reframe for any board conversation is this: the trajectory does not have to continue. Returns can shift from a margin killer to a profit lever. That shift is not rhetorical. It follows a specific logic. A shift in corporate culture and a deeper understanding of the returns process can drive this transformation, enabling boards to better oversee and optimize returns strategies.
When return costs decrease because eligible items are rerouted directly to the next buyer without warehouse intake, refund cycles become faster. Faster refunds increase customer satisfaction and reduce churn. Higher loyalty produces more repeat purchases. More sales fund further investment in the infrastructure that makes all of this possible. The flywheel is real, and it is not theoretical: it follows from removing the structural waste that the current model builds in at every step.
The board conversation about returns should end here. Not with a warning about what happens if nothing changes, but with a clear view of what becomes possible when the routing logic is redesigned. Returns are not an inescapable tax on ecommerce growth. They are a system built on an outdated assumption. Change the assumption, and the economics follow. Maximizing value recovery includes prioritizing strategies that refurbish, repair, or resell items to keep them out of landfills.
Frequently Asked Questions
What makes returns a board-level issue rather than an operational one?
Returns now intersect directly with margin durability, regulatory exposure, ESG commitments, and long-term competitiveness. When a single cost category touches finance, operations, marketing, and governance simultaneously, and when it represents a risk that compounds annually without structural intervention, it requires board-level visibility and decision-making authority. Effective board-level approaches focus on strategic oversight, cross-functional alignment, and data-driven accountability to ensure that returns strategy supports overall business objectives.
How should executives frame the financial impact of returns for directors who are not logistics experts?
Focus on capital and risk rather than operational averages. Returns trap working capital in slow-moving inventory, create unmodeled downside risk through tail-case scenarios, and erode gross margin in ways that do not appear clearly in standard financial reporting. The fully loaded cost per return, including shipping, labor, markdown exposure, and fraud, is materially higher than most P&Ls reflect. A board-level returns strategy defines how a company generates, measures, and distributes value to shareholders and stakeholders, serving as a “north star” for FP&A teams.
What are the three strategic options a board should evaluate on returns?
Status quo optimization, which improves operational efficiency at the margins without changing the underlying cost structure. Hybrid adoption, which reroutes 30 to 40 percent of recoverable returns directly to the next buyer while maintaining traditional flows for damaged, defective, or regulated items. And structural rewrite, which redesigns return routing as a long-term strategic capability. Each option carries different cost, risk, and timeline implications. Boards that feel confident about their organization’s financial growth goals typically use a three to five year time horizon to evaluate these opportunities and make decisions.
What is the middle-case scenario for returns, and why does it matter?
The middle case involves hybrid adoption at scale, with roughly 30 to 40 percent of returns bypassing warehouse intake through direct-to-next-buyer routing. This is the most likely near-term outcome for most organizations and still represents a significant improvement over the status quo in both cost and regulatory exposure. Boards should position for this scenario at minimum, making strategic planning and review a top priority for their time spent.
Why does delay on returns strategy increase risk rather than simply deferring it?
Delay locks in avoidable cost, increases regulatory exposure as rules on waste and emissions tighten, normalizes inefficient behavior across operations teams and vendor relationships, and weakens competitive position relative to organizations that begin building alternative routing infrastructure now. Structural problems do not self-correct over time. Robust board oversight can deliver tangible financial benefits, including 20-30% higher profit margins and up to 53% higher Return on Equity (ROE) compared to peers with less effective boards.
How does returns strategy connect to ESG and sustainability commitments?
Every return that passes through traditional warehouse processing doubles the shipping emissions associated with that item. Roughly 44 percent of apparel returns never reenter inventory, ending in liquidation, incineration, or landfill. As Scope 3 emissions reporting becomes a regulatory requirement in more jurisdictions, reverse logistics becomes a reportable liability. Reducing the portion of returns that require full warehouse processing directly reduces the Scope 3 footprint in a measurable, defensible way. As ESG oversight becomes a board priority, returns are increasingly viewed through a sustainability lens.
What does a controlled pilot on alternative return routing look like?
A credible pilot starts with a narrow, well-defined SKU set, typically high-demand apparel or accessories with stable resale value and durable packaging. It runs in a limited geography with a defined measurement period. It tracks cost per return, fraud signals, customer satisfaction, and inventory recovery rate. It includes fraud guardrails from day one: photo verification at initiation, refunds tied to confirmed delivery, and AI-assisted risk scoring. The output is operational evidence, not anecdotes, which is what the board needs to authorize expansion.
Written By:

Manish Chowdhary
Manish Chowdhary is the founder and CEO of Cahoot, the most comprehensive post-purchase suite for ecommerce brands. A serial entrepreneur and industry thought leader, Manish has decades of experience building technologies that simplify ecommerce logistics—from order fulfillment to returns. His insights help brands stay ahead of market shifts and operational challenges.
Turn Returns Into New Revenue
Related Articles
How to Introduce P2P Returns Without Breaking CX
Introducing peer-to-peer returns without breaking customer experience is mostly a change-management and trust-design problem, not a technology problem.
Why P2P Requires a Different Mental Model
Introduction Most people misunderstand peer-to-peer returns for the same reason: they evaluate the system through warehouse-first assumptions.
When Warehouse Returns Still Make Sense
A serious returns strategy does not pretend one path fits every return.
How CFOs Should Evaluate Returns Strategy

In this article
19 minutes
- What Returns Actually Represent on the Income Statement
- The Problem with Average Cost Per Return
- Gross Margin Sensitivity to Return Rate
- Supply Chain Optimization and Its Impact on Returns
- Working Capital and the Cash Conversion Cycle
- Predictability and the Variance Problem
- Scenario Planning for Returns Strategy
- Capital Allocation: The Question That Should Be Asked
- CFO Evaluation Framework
- Skills Required by a CFO in Returns Strategy
- Presenting Returns to the Board
- What Delay Actually Costs
- Conclusion: The CFO’s Role in Shaping Returns Strategy
- Frequently Asked Questions
Returns are no longer a logistics footnote. They are a structural drag on gross margin, working capital, and customer acquisition efficiency that most finance functions are still measuring incorrectly. The question facing CFOs in 2025 is not whether returns are expensive. It is whether the organization is structurally equipped to reduce that expense, or whether it is simply absorbing a growing liability and calling it the cost of doing business.
This article is not about return policy design or customer experience. As the evolving role of the CFO expands beyond traditional finance, CFOs face new challenges in aligning returns strategy with the company’s business model and overall business goals. CFOs enhance ROI by implementing ROI-driven financial leadership, aligning strategy with key metrics, and optimizing capital allocation—making a strategic returns approach essential for the company’s business. It is about financial decision architecture. How should a CFO think about returns? What does a properly constructed cost model look like? Where does capital allocation go wrong? And what does a board-ready framing of the returns problem actually require?
What Returns Actually Represent on the Income Statement
Financial statements provide a key format for presenting detailed returns data to different stakeholders, such as CFOs, department heads, and investors. Enhanced visibility into returns metrics within these financial statements enables better decision-making, streamlined reporting, and strategic insights for scalable growth. Developing a scalable, tailored analytical framework allows CFOs to identify trends, spot opportunities, and mitigate risks, ultimately enhancing ROI. By framing analysis and insights for different stakeholders, CFOs can further enhance decision-making and ensure that each audience receives the most relevant information.
Make Returns Profitable, Yes!
Cut shipping and processing costs by 70% with our patented peer-to-peer returns solution. 4x faster than traditional returns.
See How It WorksThe Problem with Average Cost Per Return
The industry default is to calculate an average cost per return and monitor it as a KPI. This is analytically insufficient for two reasons. A sharper focus on key metrics, rather than relying solely on averages, is essential for strategic clarity. Additionally, optimizing cost structure directly improves margins and creates headroom for strategic reinvestment, which enhances ROI.
First, averages flatten volatility. A blended cost per return of $40 across your SKU portfolio could mask a subset of high-velocity, high-cost returns that are destroying margin disproportionately. The average tells you nothing about distribution, concentration, or tail risk.
Second, the cost layers themselves are often incomplete. A fully loaded cost per return must include all of the following:
- Shipping: inbound return label, plus the original outbound leg that is now unrecoverable
- Labor: receiving, inspection, repackaging, restocking, and system updates at the warehouse
- Markdown: the discount applied when the item eventually sells as open box, refurbished, or through liquidation
- Fraud and shrinkage: wardrobing, item swaps, and empty box claims that result in full refunds against items that were never legitimately returned
When these four cost layers are stacked together, returns routinely cost 17 to 30 percent of the original sale price. For many apparel and consumer goods categories, the math is worse. An item that generates an $18 margin on a clean sale can produce a $54 loss on a returned, unsellable unit.
The financial question is not whether returns are expensive. It is whether the organization has ever looked at its returns P&L with enough granularity to know which returns are catastrophic outliers and which ones are manageable. Aligning financial KPIs with business goals improves decision-making and ensures that each initiative contributes to overall ROI.
Gross Margin Sensitivity to Return Rate
Finance leaders should model returns as a margin sensitivity variable, not a fixed assumption.
A useful scenario modeling approach examines what happens to contribution margin across three return rate assumptions: current rate, a 20 percent increase, and a 40 percent increase. For many ecommerce businesses, a return rate spike of 20 percent during peak season is not an edge case. It is a planning scenario.
The variables that amplify margin compression under volume spikes include:
- Markdown depth: as more returns enter the resale pipeline simultaneously, liquidation pricing deteriorates and discount rates increase
- Labor cost volatility: warehouse intake operations do not scale linearly; beyond capacity thresholds, overtime and temp labor costs accelerate
- Inventory days impact: when large return volumes arrive, inspection backlogs grow, extending the time items are unavailable for resale and pushing out revenue recognition
The point of this modeling exercise is not to produce a precise number. It is to demonstrate that returns are not a flat-rate cost. They are a variable with non-linear behavior under stress conditions. Boards and finance committees need to understand that the downside of returns is not well-captured by averages.
Convert Returns Into New Sales and Profits
Our peer-to-peer returns system instantly resells returned items—no warehouse processing, and get paid before you refund.
I'm Interested in Peer-to-Peer ReturnsSupply Chain Optimization and Its Impact on Returns
Supply chain optimization is a critical pillar of any robust financial strategy, directly influencing a company’s bottom line and overall enterprise value. For finance leaders and strategic CFOs, the supply chain is not just an operational concern—it is a lever for cost management, gross margin improvement, and long-term business performance. By streamlining logistics, reducing inefficiencies, and leveraging data to improve forecast accuracy, CFOs can drive significant reductions in both direct and indirect costs associated with returns.
A strategic CFO will analyze customer acquisition cost and gross margin at a granular level to pinpoint where supply chain processes may be eroding value. This approach enables finance leaders to identify and address bottlenecks, minimize waste, and ensure that capital allocation decisions reinforce financial discipline and capital efficiency. Effective supply chain management also mitigates risk exposure, ensuring business continuity even during periods of volatility or disruption.
Moreover, optimizing the supply chain demonstrates a company’s commitment to financial discipline and operational excellence, which can enhance investor relations and support long-term success. As regulatory and market pressures mount, companies with agile, efficient supply chains are better positioned to adapt, protect margins, and sustain enterprise value. Ultimately, supply chain optimization is not just about reducing cost—it is about building a resilient foundation for strategic growth and superior business performance.
Working Capital and the Cash Conversion Cycle
Returns introduce a specific form of working capital distortion that deserves its own treatment in financial planning.
When a return is initiated, three things happen simultaneously: a refund liability is created, the physical item enters a processing queue, and the inventory record remains in limbo until inspection is complete and the item is restocked or written down. Depending on warehouse throughput, this cycle can take anywhere from several days to several weeks.
The financial consequences:
- Refund cycle time directly extends the period between cash outflow (refund issued) and cash inflow recovery (resale of returned item)
- Recovery rate, the percentage of returned items successfully restocked or resold at meaningful price, determines whether that cash inflow materializes at all
- Inventory days impacted by returns are inventory days not generating revenue, which distorts working capital metrics and misleads cash flow forecasting
Alternative routing approaches that eliminate warehouse intake can compress this timeline materially. When a returned item moves directly to the next buyer without entering a warehouse queue, refund settlement is tied to delivery confirmation rather than inspection completion. The gap between refund outflow and resale recovery narrows from weeks to days.
For CFOs who are actively managing cash conversion cycles, the difference is not trivial. It affects short-term liquidity planning, credit facility utilization, and the accuracy of rolling cash flow forecasts.
Predictability and the Variance Problem
Finance leaders are trained to manage not just expected outcomes but variance around those outcomes. Returns present a specific variance challenge that most returns cost models do not address. Organizations face increasing challenges in managing returns variance, especially as market disruptions and strategic hurdles become more frequent.
Return rates are correlated with external events: promotional intensity, seasonal patterns, product category trends, and consumer sentiment shifts. This means the distribution of return costs across a fiscal year is not smooth. There are periods of significantly elevated cost followed by periods of relative calm.
A finance function that models returns as a stable monthly expense will systematically misforecast gross margin during high-return periods. The miss is not random noise. It is a predictable consequence of treating a volatile input as a fixed one.
The appropriate financial discipline here is variance reduction as a parallel objective to mean reduction. Predictability in return-related cash flows has real value, particularly for businesses with thin gross margins, high seasonal concentration, or active investor relations obligations. Forecast accuracy is a finance function output, and returns are one of the inputs that most erodes it.
Establishing accountability through detailed planning ensures that all teams are working towards the same goals, which can improve ROI.
Scenario Planning for Returns Strategy
Scenario planning is an essential tool for finance leaders seeking to future-proof their returns strategy and safeguard business performance. By developing multiple scenarios, a strategic CFO can stress-test financial plans against a range of potential risks and opportunities, from sudden spikes in return rates to shifts in consumer behavior or regulatory changes. This proactive approach enables companies to anticipate risk exposure and make informed, strategic decisions about resource allocation across business units.
Through scenario planning, finance leaders can foster collaboration between departments, ensuring that all stakeholders—from operations to marketing—are aligned on the company’s strategy and prepared to respond to evolving market conditions. This process not only strengthens risk management but also uncovers opportunities for market expansion, new investments, and business development. By integrating scenario planning into the financial planning cycle, CFOs can drive more accurate forecasting, support strategic decisions, and position the company for sustained growth and improved financial results.
Ultimately, scenario planning empowers decision makers to navigate uncertainty with confidence, ensuring that the company’s returns strategy remains agile, resilient, and aligned with long-term business objectives.
Capital Allocation: The Question That Should Be Asked
Here is a question that most ecommerce finance teams have never formally posed: if your returns operation were a standalone business unit, would you invest in its current structure?
That question reframes the capital allocation problem in useful terms.
Every dollar spent optimizing a warehouse-centric returns loop, whether on better software, expanded warehouse capacity, or more labor, is capital reinforcing a cost structure that has demonstrated consistent inability to reduce per-return expense. The market has run this experiment at scale. More warehouses did not reduce per-return cost. Carrier consolidation did not remove labor. Better software accelerated volume into the same expensive reverse flow.
Capital that eliminates entire cost layers behaves differently than capital that optimizes existing cost layers. When the underlying routing logic changes and items stop traveling backward through the supply chain before reaching the next buyer, shipping legs, inspection labor, and markdown decay disappear structurally rather than being managed more efficiently.
Sale-leasebacks serve as a strategic capital allocation tool to fund both internal and external growth in all market conditions, and can be tailored to the company’s specific industry to address unique operational requirements and asset types. Transactions such as sale-leasebacks are significant business events that impact growth strategies, capital allocation, and long-term planning.
The capital allocation question worth asking is not “how do we make this process cheaper?” It is “do we continue investing in a structure with demonstrated return-on-capital limitations, or do we redirect that capital toward an architecture that removes the cost entirely for a meaningful portion of eligible returns?”
This is not an argument for radical disruption. It is an argument for applying standard capital efficiency thinking to a cost center that has historically been treated as fixed infrastructure rather than an investment decision.
No More Return Waste
Help the planet and your profits—our award-winning returns tech reduces landfill waste and recycles value. Real savings, No greenwashing!
Learn About Sustainable ReturnsCFO Evaluation Framework
Before any strategic decision on returns can be defended to a board or investment committee, the following baseline questions need documented answers. Finance leaders who cannot answer these questions with specificity do not yet have the data to make a capital allocation decision, in either direction.
Do we know our fully loaded cost per return? Not an average. A distribution. Cost broken down by shipping, labor, markdown, and fraud. By category. By season. By channel.
What is our current return rate by SKU, and what is its trend? Is return rate rising, flat, or declining? What is driving the change? Are high-return SKUs concentrated in specific categories where margin compression is already a concern?
What percentage of returns are structurally eligible for alternative routing? Not all returns require warehouse processing. Identifying the portion of recoverable, non-defective, non-regulated inventory that could bypass centralized intake is the starting point for any investment case.
What is the capital required to modernize returns routing? This requires a vendor or build assessment. The relevant number is not the sticker price of a new platform. It is the fully loaded cost of implementation, integration, and change management against a baseline of current annual returns spend.
What is the payback period on that capital? Using the fully loaded cost per return as the baseline and a conservative estimate of the eligible return volume, what is the margin recovery within 12 and 24 months? Finance leaders should require a payback period analysis before approving any returns modernization investment.
What is the downside risk of doing nothing? This question is often skipped. Returns compound. Regulatory exposure increases as sustainability disclosure requirements expand. Return volume tends to grow with revenue. The cost of inaction is not zero. It is the present value of a worsening cost structure plus the optionality lost by being a late adopter when market standards shift.
CFOs can unify the organization around a consistent set of financial and operational metrics, ensuring alignment across departments and improving decision-making. Leveraging shared services to support finance transformation enables scalable, integrated FP&A solutions, helping CFOs drive efficiency and create long-term value as part of their returns strategy.
Skills Required by a CFO in Returns Strategy
Developing and executing an effective returns strategy requires a CFO to possess a diverse and evolving skill set. Beyond traditional financial planning and cash flow management, a strategic CFO must excel in data analytics, leveraging insights to drive business performance and optimize working capital. The ability to interpret complex data and translate it into actionable strategies is essential for managing returns in large organizations with intricate systems and processes.
A modern CFO also needs strong communication skills to articulate financial concepts and strategic issues to business leaders and non-financial stakeholders. As the CFO role continues to evolve, advising CEOs and guiding business units on both short-term and long-term strategy has become increasingly important. Balancing immediate cost management with investments in growth and strategic assets requires both financial discipline and a forward-looking mindset.
In today’s dynamic business environment, a CFO must be adept at integrating financial systems with broader business operations, ensuring that processes and assets are aligned to support the company’s strategy and growth objectives. Ultimately, the CFO’s ability to drive business performance, maintain capital efficiency, and support enterprise-wide transformation is critical to the long-term success of the organization.
Presenting Returns to the Board
CFOs who need to bring returns into a board-level conversation should organize the discussion around four dimensions. Advising CFOs and the chief financial officer is critical in guiding board-level discussions, ensuring that financial leadership is aligned with strategic business outcomes.
Margin durability is the starting point. The question is whether gross margin guidance is reliable if the returns cost model is incomplete or based on averages that mask volatility. Boards focused on margin durability need to understand that returns are not a stable cost; they are a variable with significant downside potential that is not fully captured in current reporting.
Regulatory exposure is an increasingly relevant disclosure consideration. Sustainability reporting requirements are expanding across jurisdictions. Scope 3 emissions, which include reverse logistics, are moving from voluntary disclosure toward mandatory frameworks in multiple markets. The financial exposure of a returns operation that generates outsized emissions or routes significant volumes to liquidation or destruction is not purely reputational. It carries emerging compliance risk.
ESG risk connects to investor expectations as much as to regulatory requirements. Institutional investors are asking harder questions about the sustainability of reverse logistics operations. A returns program that sends 44 percent of apparel returns to liquidation or disposal is an ESG liability that will eventually surface in investor relations conversations.
Competitive positioning is the forward-looking dimension. The companies currently rethinking returns architecture will have a structural cost advantage over those that delay. That advantage compounds over time. For boards focused on long-term enterprise value, returns modernization is not a cost reduction project. It is a strategic positioning decision about where the company wants to be when market standards shift. Modern CFOs must be prepared to adapt and course correct in response to changing market conditions. CFOs are increasingly involved in complex and cross-functional projects, including business transformation and digital initiatives.
Traditional Returns Are Ending
Ecommerce built a returns system for a smaller internet. Today it’s collapsing under scale. Warehouses can’t absorb the volume, costs keep rising, and retailers are quietly tightening policies. This article explains why the old model is failing and what replaces it.
Read the Returns BibleWhat Delay Actually Costs
There is a tendency in finance to treat the decision not to act as a neutral outcome. It is not. Many organizations face CFO transitions unprepared, often appointing interim CFOs during these transitions.
Returns compound. Every year the current structure remains in place locks in avoidable cost, increases exposure to regulatory requirements that are moving in one direction, and normalizes inefficient behavior across operations, procurement, and customer expectations. The organization adapts to a broken system and calls the adaptation competency.
The financial case for acting early on returns modernization is not speculative. The fully loaded cost of the current model is measurable. The portion of that cost that is structurally eliminable, rather than merely optimizable, is identifiable through SKU eligibility analysis. The capital required to modernize is quotable. The payback period is calculable.
What is not calculable with precision is the cost of waiting. But finance leaders know from first principles that structural problems do not self-correct. They get priced into the business over time, until the cost of change exceeds the comfort of inertia.
That is the point at which late adopters discover what early movers already knew: returns strategy is a capital allocation decision, not a logistics problem.
Investing in the current CFO and their successors is crucial for maintaining a healthy future CFO candidate pipeline.
Conclusion: The CFO’s Role in Shaping Returns Strategy
In summary, the CFO’s role in shaping a company’s returns strategy is both critical and multifaceted. From optimizing the supply chain to implementing scenario planning and cultivating essential skills, a strategic CFO is at the forefront of driving business performance and long-term value creation. By leveraging financial planning, data analytics, and cross-functional collaboration, CFOs can ensure that the company’s returns strategy supports future growth, market expansion, and enterprise value.
Investing in finance transformation and the ongoing development of the CFO and their team is essential for sustaining success in an increasingly complex business landscape. The CFO’s influence extends beyond financial management to strategic leadership, business development, and the alignment of resources with the company’s mission and objectives. As the demands on the finance function continue to evolve, companies that prioritize the strategic role of the CFO will be best positioned to achieve long-term growth, maximize value, and maintain a competitive edge in the market.
Frequently Asked Questions
What is the right way to measure cost per return for a CFO audience?
Cost per return should be broken into four components: shipping, labor, markdown, and fraud. Each should be tracked separately rather than blended into a single average. The distribution across SKU categories and seasons matters as much as the mean, because returns are a variable cost with significant volatility around the average. CFOs who rely on blended averages will systematically misforecast gross margin impact during high-return periods.
How should returns be modeled in a gross margin sensitivity analysis?
Returns should be treated as a sensitivity variable, not a fixed assumption. The most useful approach is to model contribution margin under three scenarios: current return rate, a moderate increase of 20 percent, and a stress scenario of 40 percent. This surfaces how margin behaves non-linearly under volume spikes due to markdown depth deterioration, labor cost escalation, and inventory day extension. The goal is not precision but understanding the shape of the downside.
How do returns affect the cash conversion cycle?
Returns create a gap between refund outflow and resale recovery that can extend from several days to several weeks depending on warehouse throughput and inspection capacity. During this period, refund liabilities are live, inventory is unavailable for resale, and cash flow forecasting is impaired. Alternative routing models that eliminate warehouse intake can compress this gap significantly by tying refund settlement to delivery confirmation rather than inspection completion.
Why does capital allocation for returns optimization often produce limited results?
Most returns technology investment optimizes the front end of an existing warehouse-centric loop. It improves the customer experience and policy enforcement but does not change where inventory flows. The structural costs of inbound freight, inspection labor, and markdown exposure remain intact. Capital that reduces cost at the margin within the existing architecture produces marginal results. Capital that changes the routing logic for a meaningful portion of eligible returns eliminates entire cost categories rather than managing them.
What should CFOs present to the board about returns?
The board framing should address four dimensions: margin durability (are current gross margin assumptions reliable given returns volatility?), regulatory exposure (what is the emerging compliance risk from sustainability disclosure requirements?), ESG risk (what is the long-term investor relations exposure of the current returns footprint?), and competitive positioning (what is the cost of being a late mover when returns architecture standards shift?). Returns should be presented as a capital allocation decision with strategic implications, not as an operational cost management item.
Is there a point at which doing nothing on returns becomes a competitive disadvantage?
Yes, and that point tends to arrive before it is visible in the income statement. The companies that redesign returns architecture early build a structural cost advantage that compounds over time. That advantage shows up in gross margin, working capital efficiency, and the ability to absorb volume growth without proportional cost escalation. The companies that wait inherit the industry standard on worse terms, because by the time they act, the gap between their cost structure and early movers has already widened.
Written By:
Manish Chowdhary
Manish Chowdhary is the founder and CEO of Cahoot, the most comprehensive post-purchase suite for ecommerce brands. A serial entrepreneur and industry thought leader, Manish has decades of experience building technologies that simplify ecommerce logistics—from order fulfillment to returns. His insights help brands stay ahead of market shifts and operational challenges.
Turn Returns Into New Revenue
Related Articles
How to Introduce P2P Returns Without Breaking CX
Introducing peer-to-peer returns without breaking customer experience is mostly a change-management and trust-design problem, not a technology problem.
Why P2P Requires a Different Mental Model
Introduction Most people misunderstand peer-to-peer returns for the same reason: they evaluate the system through warehouse-first assumptions.
When Warehouse Returns Still Make Sense
A serious returns strategy does not pretend one path fits every return.
What Is MOQ? Minimum Order Quantity Explained for Ecommerce

In this article
18 minutes
- Introduction to MOQ
- How Minimum Order Quantity Works in Practice
- Types of MOQs
- The Real Cost of a High MOQ
- Low Minimum Order Quantities
- Break Even Point
- MOQ and Dead Stock: A Direct Line
- Inventory Management Software
- Calculating MOQ Fit Before You Commit
- How to Negotiate MOQ With Suppliers
- Managing MOQ Across a Multi-SKU Catalog
- Frequently Asked Questions
MOQ, or minimum order quantity, is the smallest number of units a supplier will let you order at once. For ecommerce brands, it is one of the most consequential variables in inventory planning because it determines not just how much you buy, but how much capital you expose per SKU before a single unit sells.
Most operators encounter MOQ as a supplier constraint and treat it like a fixed rule. The more useful frame is to treat it as a risk variable. Both the seller and the buyer must consider MOQ in their inventory and supply chain planning. Every time you accept a supplier’s MOQ without stress-testing it against your demand data, you are making a bet on sell-through. Get that bet wrong often enough, and the result is dead stock, locked cash, and margin erosion that compounds quietly until it becomes a real problem.
Suppliers implement minimum order quantities to ensure production efficiency and profitability by covering fixed costs associated with production runs and administrative processes. MOQs are used to ensure production runs are economically viable. Suppliers set their own MOQs based on their business needs, production costs, inventory constraints, profit margins, and administration costs. Setting an MOQ helps optimize the supply chain, reduce costs, improve production efficiency, and strengthen supplier relationships.
Introduction to MOQ
Minimum Order Quantity (MOQ) is a foundational concept in both business and supply chain management. At its core, MOQ refers to the smallest number of units a supplier is willing to sell in a single transaction. For ecommerce businesses, understanding minimum order quantity moq is essential for effective inventory management and maintaining a healthy supply chain. The MOQ set by a supplier directly impacts how much inventory you need to purchase, how you allocate your capital, and how you plan your inventory replenishment cycles.
A well-managed MOQ helps businesses avoid overstocking, reduce storage costs, and ensure that inventory levels align with actual customer demand. On the supplier side, MOQs are used to ensure that production runs are economically viable, covering the costs of raw materials, labor, and logistics. For buyers, knowing how minimum order quantity works is key to negotiating favorable terms, optimizing order quantities, and building strong supplier relationships. In the following sections, we’ll explore the different types of MOQs and how they affect your business operations.
Slash Your Fulfillment Costs by Up to 30%
Cut shipping expenses by 30% and boost profit with Cahoot's AI-optimized fulfillment services and modern tech —no overheads and no humans required!
I'm Interested in Saving Time and MoneyHow Minimum Order Quantity Works in Practice
Suppliers set MOQs to protect their own economics. Running a production batch has fixed costs regardless of volume: machine setup, raw materials procurement, labor scheduling, and quality control. The supplier’s minimum order quantity is often determined by the minimum amount needed to cover production and administration costs. Below a certain order size, those fixed costs make the transaction unprofitable for the manufacturer. The MOQ is the floor where production still makes sense for them.
From the buyer’s side, that floor becomes your ceiling for flexibility. You cannot order less than the MOQ, which means that if your projected demand sits below it, you are overbuying by definition.
Consider a straightforward example. A brand sells a seasonal candle variant that moves about 400 units per quarter. The supplier’s MOQ is 1,000 units—a high minimum order quantity. This high MOQ can create challenges for inventory turnover and demand forecasting, as the brand must buy 2.5 quarters of supply in a single purchase. If the variant underperforms, sells through slowly, or gets discontinued, 600 units sit in a warehouse generating holding costs and tying up working capital that could fund a better-performing SKU.
Both parties often negotiate MOQs based on demand forecasts, historical sales data, and purchasing power to achieve mutually beneficial terms.
That gap between the MOQ and your realistic demand forecast is where inventory risk lives.
Types of MOQs
MOQs come in two main forms: simple and complex. A simple MOQ is straightforward—it might require you to order a minimum quantity of a single product or reach a minimum dollar amount per order. For example, a supplier may require a minimum quantity of 100 units or a $500 minimum order before processing your request.
Complex MOQs, on the other hand, involve multiple conditions. These could include combinations of minimum quantities across several SKUs, minimum dollar values, or even specific packaging requirements. For instance, a supplier might require you to order at least 50 units of each color variant, or a total of 200 units across a product line, or meet a certain spend threshold.
Suppliers set these minimums to manage their production costs and maintain efficient inventory levels. By establishing MOQs, they can ensure that each production run is cost-effective, administrative tasks are streamlined, and inventory turnover remains healthy. For buyers, understanding the type of MOQ in place is crucial for planning purchases and managing inventory efficiently.
The Real Cost of a High MOQ
The sticker price of an MOQ order is not the full cost. The full cost includes everything that happens after the inventory arrives.
Inventory holding costs accumulate the moment product hits your warehouse. Storage fees, insurance, shrinkage, and the labor required to manage stock all run on the clock. For brands using third-party logistics providers or Amazon FBA, those costs are explicit and itemized. For brands running their own warehouse space, they are often underestimated because they blend into general overhead. Ordering large quantities due to a high minimum order quantity can require businesses to possibly warehouse large quantities of stock, impacting warehouse capacity and storage space.
Cash flow is the more acute problem. A high MOQ order pulls a large amount of working capital forward, often weeks or months before the inventory starts generating revenue. For a growing ecommerce brand managing multiple SKUs, stacking several high-MOQ purchases in the same period can create serious cash pressure, limiting the ability to fund marketing, new product development, or operations. High MOQs can create cash flow constraints for smaller businesses and may serve as a barrier to entry for those unable to commit to such a large volume.
Dead stock is the downstream consequence. When MOQ-driven purchases outpace actual customer demand, excess inventory does not just cost money to store. It eventually forces a decision: run a discount to clear it, write it down, or liquidate it. Each option destroys margin. The brands most vulnerable are those with broad SKU catalogs, seasonal products, trend-sensitive items, or multiple variants (sizes, colors, configurations) where demand per variant is naturally fragmented. High minimum order quantities can lead to increased carrying costs, higher average stock levels, and a greater risk of excess inventory or obsolescence if demand does not meet expectations.
Ecommerce businesses on Amazon and Walmart marketplace face an amplified version of this problem because storage fees, Inventory Performance Index (IPI)-driven storage limits, and aging penalties make excess inventory progressively more expensive the longer it sits. Sellers must proactively manage Amazon inventory performance and storage limits to avoid tying up capital in slow-moving FBA stock.
High MOQs help suppliers protect their operations from the administrative burden and reduced profitability associated with processing numerous small orders, resulting in lower administrative costs.
Bulk orders often mean lower shipping and logistics costs per item.
Low Minimum Order Quantities
Low minimum order quantities (low MOQs) offer significant advantages, especially for startups and small businesses with limited resources. With a low MOQ, businesses can test new products, respond quickly to market trends, and enter new markets without committing to large inventory purchases. This flexibility is particularly valuable for companies operating in niche or seasonal markets, where customer demand can be unpredictable.
Low MOQs also allow businesses to maintain a diverse product range without tying up too much capital or exceeding their storage capacity. However, there are trade-offs: ordering in smaller quantities can lead to higher administrative costs per unit and may reduce the cost efficiency gained from bulk purchasing. To address these challenges, businesses can negotiate with suppliers for better terms, leverage inventory management software to optimize order quantities, and implement just-in-time inventory systems to keep inventory levels lean. Many brands also revisit their broader ecommerce supply chain efficiency strategy to reduce unstable costs and process bottlenecks. By balancing the benefits and drawbacks, companies can use low MOQs to support growth while managing risk and operational costs.
Break Even Point
The break-even point (BEP) is a vital metric when determining the right MOQ for your business. It represents the point at which your total revenue matches your total costs—including both fixed and variable production costs. Understanding your break-even point helps you calculate the minimum order quantity that will cover your expenses and start generating profit.
To find your BEP, use the formula: BEP = Fixed Costs / (Selling Price – Variable Costs). This calculation allows you to see how many units you need to sell at a given price to cover all your costs. By factoring in your MOQ requirements, you can determine whether your planned order size will help you reach profitability or if you need to adjust your MOQ strategy. Analyzing the break-even point ensures that your inventory levels are aligned with your business goals, minimizes total inventory costs, and supports healthy profit margins. This approach helps you make informed decisions about production, purchasing, and inventory management, ensuring your business remains financially sustainable while also creating room to optimize overall order fulfillment costs.
Looking for a New 3PL? Start with this Free RFP Template
Cut weeks off your selection process. Avoid pitfalls. Get the only 3PL RFP checklist built for ecommerce brands, absolutely free.
Get My Free 3PL RFPMOQ and Dead Stock: A Direct Line
Dead stock does not appear suddenly. It accumulates gradually, SKU by SKU, order by order, every time the MOQ accepted at purchase exceeds the demand that actually materializes.
Monitoring inventory turnover rates and regularly reviewing sales data can help identify low-demand or slow-turnover items, allowing businesses to optimize MOQs and negotiate better terms.
The pattern typically looks like this: a brand sources a new product and accepts the supplier’s MOQ to secure a competitive unit cost. Initial sales are promising. The next reorder goes through at the same MOQ. Demand softens slightly, but the order is already placed. By the third cycle, a portion of the inventory is aging. By the fourth, storage costs are eating into the margin the bulk pricing was supposed to protect.
Historical sales data can expose this dynamic early. If your weeks-of-supply metric consistently runs far above your target after each replenishment, your MOQ is structurally higher than your demand justifies. That is the signal to act, either by renegotiating the MOQ, adjusting order frequency, or rationalizing the SKU before dead stock compounds further.
For brands with large catalogs, this analysis matters at the variant level, not just the product level. A top-level SKU may appear healthy while a specific size or colorway quietly accumulates excess stock because the MOQ was set against aggregate demand, not variant-level demand.
Effective management of minimum order quantities can significantly impact cash flow, storage requirements, and overall operational efficiency and market competitiveness.
Inventory Management Software
Inventory management software (IMS) is an essential tool for businesses looking to manage their minimum order quantity moq effectively. IMS enables you to track inventory levels in real time, monitor supplier lead times, and optimize order quantities based on actual customer demand. By automating key processes, IMS helps reduce inventory costs, minimize stockouts, and improve overall operational efficiency.
With features like automated ordering, demand forecasting, and supplier performance tracking, inventory management software empowers businesses to make data-driven decisions about their MOQ strategy. IMS can also help calculate your economic order quantity (EOQ)—the optimal order quantity that minimizes total inventory costs by balancing ordering and holding costs. The EOQ formula is: EOQ = √((2 * Demand * Ordering Cost) / Holding Cost). By leveraging IMS to calculate EOQ and manage order quantities, businesses can ensure they are meeting customer demand without overstocking, reducing administrative costs, and maintaining optimal inventory levels. Ultimately, effective use of IMS supports strategic inventory management, cost savings, and a more agile, responsive supply chain, especially when paired with a thoughtful ecommerce order fulfillment profit strategy that treats fulfillment as a lever for growth rather than a pure cost center.
Calculating MOQ Fit Before You Commit
Before accepting any supplier MOQ, the calculation worth running is simple: divide the MOQ by your average monthly unit sales for that SKU. The result is the number of months of supply you are committing to in a single order. It is important to use demand forecasts to calculate minimum order quantity and ensure that your order size aligns with sales expectations, helping to avoid excess stock or stockouts.
If that number is two or three months, the risk is manageable for a stable product. If it stretches to six months or beyond, you are making a high-stakes forecast. For new products without sales history, any MOQ that requires months of supply is speculative by nature.
The economic order quantity (EOQ) framework offers a more rigorous version of this analysis. EOQ calculates the order size that minimizes total inventory costs by balancing ordering costs against holding costs. Businesses should calculate minimum cost order quantity by considering factors such as demand forecast, storage capacity, budget constraints, and lead times. Inventory management software and technology tools can help calculate minimum order quantity more precisely. If your EOQ sits below the supplier’s MOQ, you will structurally carry excess inventory on every cycle. The gap between your EOQ and the MOQ is a direct measure of the inefficiency you are accepting and a signal to evaluate more efficient ecommerce order fulfillment services that can support better inventory placement.
For products with proven demand and stable velocity, a high MOQ is often manageable. For long-tail SKUs, new variants, or seasonal items, even a moderate MOQ can create excess inventory risk that accumulates over time.
How to Negotiate MOQ With Suppliers
MOQ is a starting position, not an immovable policy. Suppliers set MOQs to protect their economics, but they may adjust MOQs based on market conditions, production efficiency, and customer relationships. This means there is usually room to negotiate when you can offer something in return.
Several approaches tend to work in practice:
- Commit to volume over time rather than in a single order. A supplier who sets an MOQ of 1,000 units may accept 500 units per order if you can demonstrate a reliable ordering cadence and annual purchase volume that covers their margin requirements.
- Consolidate SKUs into a single order. If you source multiple products from the same supplier, bundling orders can help you meet an aggregate MOQ threshold while distributing the quantity across items with stronger demand coverage.
- Start with a pilot order framing. For new products, presenting the first order as a market validation run with a firm commitment to scale can give a supplier confidence in the long-term relationship without requiring you to over-buy upfront.
- Offer favorable payment terms. Paying earlier, or in full at order, reduces supplier risk and often provides leverage to negotiate lower minimum quantities. Pairing this with the right warehousing and fulfillment services partner ensures that once inventory lands, it’s stored and processed efficiently.
- Ask about tiered pricing structures. Sometimes the unit economics at a lower order quantity are acceptable when you factor in reduced holding costs and eliminated dead stock risk. The bulk savings at the full MOQ may not justify the inventory carrying cost and write-down exposure.
- Engage in transparent discussions with suppliers about your business needs and sales projections. Clearly communicating your operational requirements and expected demand can help negotiate lower MOQs that better align with your business strategy.
- Consider offering volume discounts or other incentives. Providing tiered pricing or free shipping can encourage customers to place larger orders and help you meet supplier MOQs more efficiently.
- Time negotiations during slower seasons and propose bundling multiple SKUs. Suppliers may be more flexible with MOQs during off-peak periods, and bundling different products can help you reach the required MOQ while diversifying your inventory.
Maintaining healthy supplier relationships is the foundation for any of this to work. Suppliers who trust the buyer’s business and forecasts are more willing to flex on MOQ terms, particularly as order history builds. Maintaining open communication with suppliers is essential for negotiating flexible MOQ terms.
Scale Faster with the World’s First Peer-to-Peer Fulfillment Network
Tap into a nationwide network of high-performance partner warehouses — expand capacity, cut shipping costs, and reach customers 1–2 days faster.
Explore Fulfillment NetworkManaging MOQ Across a Multi-SKU Catalog
At scale, MOQ management becomes a portfolio problem. Each SKU in your catalog has its own demand profile, its own supplier MOQ, and its own risk exposure. Managing them individually is operationally intensive and tends to produce inconsistent outcomes.
Effective inventory management at this level requires demand-driven replenishment logic that compares each SKU’s forecasted consumption against its MOQ before the order is placed, not after. When forecasted demand falls below the MOQ threshold, the system should flag it for review rather than auto-reorder at the minimum. Regularly reviewing inventory levels and adjusting MOQ strategies according to changes in market demand is essential to ensure optimal stock levels and reduce unnecessary costs.
Inventory management software that surfaces weeks-of-supply, sell-through rate, and MOQ gap metrics per SKU gives operations teams the visibility to make those calls systematically. Using technology to automate inventory management helps businesses continuously monitor demand patterns and adjust MOQs as needed. Without that visibility, MOQ decisions default to manual judgment, which scales poorly and tends to favor over-ordering to avoid stockouts. Many operators supplement these tools with ongoing ecommerce logistics and fulfillment webinars to stay ahead of marketplace rule changes and best practices.
The broader strategic objective is a catalog where the MOQ-to-demand ratio stays within a manageable range across active SKUs. That often means pruning low-velocity variants, consolidating suppliers where possible, and setting explicit thresholds for when a SKU’s demand no longer justifies its supplier’s minimum. For marketplace sellers, diversifying beyond FBA with options like Merchant Fulfilled Prime and other FBA alternatives can also change how aggressively you need to buy against each MOQ. Balancing your own inventory and only holding as much inventory as needed helps optimize carrying costs and reduces risk.
Frequently Asked Questions
What does MOQ mean in ecommerce?
MOQ stands for minimum order quantity. It is the smallest number of units a supplier will sell in a single order. In ecommerce, it directly affects how much inventory you purchase per cycle, how much capital you commit upfront, and how much excess stock risk you carry per SKU.
How does minimum order quantity affect cash flow?
A high MOQ forces you to purchase more inventory than you may need in the near term, pulling working capital forward before that inventory generates revenue. For brands managing multiple SKUs simultaneously, stacking high-MOQ orders can significantly reduce cash flow flexibility and limit investment in other areas of the business, especially when layered on top of rising Amazon FBA fees and storage charges.
What is the difference between MOQ and economic order quantity?
MOQ is the minimum a supplier will accept. Economic order quantity (EOQ) is the order size that minimizes your total inventory costs, balancing ordering costs against holding costs. When your EOQ falls below a supplier’s MOQ, you will carry excess inventory on every replenishment cycle, increasing holding costs and dead stock risk.
Can you negotiate a supplier’s MOQ?
Yes. MOQ is often negotiable, particularly when you can offer a reliable order cadence, consolidated purchasing across multiple SKUs, or favorable payment terms. Suppliers set MOQs to protect their margins, so any negotiation that addresses their underlying economics gives you room to move.
How does a high MOQ lead to dead stock?
When the MOQ exceeds your actual demand for a SKU, every order cycle produces more inventory than you can sell in a reasonable timeframe. That excess accumulates as dead stock, incurring storage costs, tying up capital, and eventually forcing markdown or liquidation decisions that erode margin.
How do you calculate whether an MOQ is too high for your business?
Divide the MOQ by your average monthly unit sales for that SKU. The result tells you how many months of supply you are committing to in a single order. For stable, fast-moving products, several months of supply may be acceptable. For new, seasonal, or low-velocity SKUs, anything beyond a few weeks of supply represents meaningful inventory risk.
Written By:
Indy Pereira
Indy Pereira helps ecommerce brands optimize their shipping and fulfillment with Cahoot’s technology. With a background in both sales and people operations, she bridges customer needs with strategic solutions that drive growth. Indy works closely with merchants every day and brings real-world insight into what makes logistics efficient and scalable.
Turn Returns Into New Revenue
Related Articles
How to Introduce P2P Returns Without Breaking CX
Introducing peer-to-peer returns without breaking customer experience is mostly a change-management and trust-design problem, not a technology problem.
Why P2P Requires a Different Mental Model
Introduction Most people misunderstand peer-to-peer returns for the same reason: they evaluate the system through warehouse-first assumptions.
When Warehouse Returns Still Make Sense
A serious returns strategy does not pretend one path fits every return.
Where Peer-to-Peer Returns Don’t Work And Why That’s Fine
Peer-to-peer returns are not a silver bullet, and any system claiming universal applicability in retail logistics is not serious. The credibility of P2P as a model rests precisely on knowing where it stops, which SKUs belong in it, and which ones still belong in a warehouse. That boundary is not a weakness. It is what makes the model implementable. Peer-to-peer returns operate by bypassing traditional financial institutions or intermediaries, enabling direct transactions between buyers and sellers.
For ecommerce operators who have spent years watching reverse logistics costs compound in the face of rising e-commerce return rates, the appeal of P2P is obvious. Eliminate the warehouse intake. Remove the redundant shipping leg. Stop the markdown spiral. The economics are compelling, and the structural logic holds. Peer-to-peer (P2P) returns in e-commerce allow items to be shipped directly from the original buyer to a new buyer instead of returning to a warehouse. But none of that changes the reality that a meaningful share of every return catalog will always require centralized handling. The retailers who understand that distinction early are the ones who will deploy P2P confidently and scale it without operational fragility. Sustainability benefits of P2P returns include reduced packaging waste and lower carbon emissions from shipping, aligning closely with broader initiatives to support eco-friendly returns.
This article is about scope. Where P2P works, where it does not, and what the realistic operating model actually looks like in a landscape where free returns are increasingly under pressure.
Why Boundaries Make a Model Stronger
Most operations problems get pitched as universal solutions. Returns software will fix your cost structure. Carrier consolidation will bend the curve. Scale will eventually solve the economics. These promises share a common flaw: they avoid acknowledging the conditions under which they fail.
P2P returns are built differently. The model is not designed to handle everything. It is designed to handle the right things, which in practice means the majority of recoverable, resalable inventory that currently gets routed backward through the supply chain for no structural reason. Specialized online platforms facilitate these returns by managing the process securely and efficiently.
When a system defines its own limits, it becomes more trustworthy, not less. The constraints below are not edge cases to be footnoted. They are load-bearing parts of how P2P gets deployed correctly.
P2P returns can reduce reverse logistics costs by roughly 70% by eliminating the need to return items to a warehouse, changing the underlying math of the cost of so-called “free” returns.
Make Returns Profitable, Yes!
Cut shipping and processing costs by 70% with our patented peer-to-peer returns solution. 4x faster than traditional returns.
See How It WorksWhere Peer-to-Peer Returns Do Not Work
Fragile Goods
Some products simply cannot reliably survive a second customer-initiated shipment. Glassware, ceramics, fragile electronics, and items requiring specialized cushioning fall into this category. When a customer packs a returned item for forwarding, they are not a trained warehouse associate. They do not have standardized materials, controlled processes, or inspection checklists.
For these SKUs, controlled inspection and professional repackaging still matter. A warehouse provides:
- Standardized outbound protection
- Condition verification before items move again
- Accountability if something arrives damaged
Routing fragile goods through P2P is not a cost-saving move. It is a customer experience liability. These items belong in traditional handling, and a well-configured P2P system routes them there automatically based on SKU flags and category rules.
Regulatory Constraints
Certain product categories face legal and compliance barriers that limit or prohibit resale or re-routing without centralized oversight. Cosmetics, personal care products, medical devices, consumables, and items with tamper-evident packaging requirements all fall into this zone.
The issue is not policy preference. It is chain-of-custody.
In these verticals:
- Resale may be prohibited outright by regulation
- Inspection requirements are non-negotiable and must be documented
- The condition of the item cannot be verified without a controlled process
P2P adoption in regulated categories is limited until regulatory frameworks evolve to accommodate forward-routing models. Until then, routing these returns through traditional inspection is not a workaround. It is the only legally defensible path.
Damaged or Defective Items
Not all returns are created equal. A customer returning a defective item out of the box is not the same as a customer returning an item that does not fit. P2P is designed for the latter, not the former.
Items that are defective out of the box, damaged in transit, or missing components require:
- Verification and root-cause analysis
- Vendor or carrier claims processing
- Controlled disposition, whether that means repair, replacement, or write-off
Forwarding a defective item directly to the next buyer is not P2P. It is a customer service failure waiting to happen. The distinction matters operationally: P2P eligibility checks should include return reason as a primary filter, routing defect and damage returns into traditional flows before they ever enter the P2P pipeline.
P2P is for recoverable inventory. Failure cases are not recoverable inventory.
Seasonality and Edge Cases
Timing creates a category of its own. End-of-season apparel, event-driven merchandise, and SKUs with expiring demand are not good P2P candidates, even if the items themselves are in perfect condition.
The logic is simple: if there is no downstream buyer, forwarding has no value. A P2P system routes items toward demand. When demand no longer exists for a given SKU, there is no one to route toward.
For these items, liquidation or recycling may still be the optimal path, ideally within a broader strategy for supporting eco-friendly returns. That is not a failure of P2P. It is the system working correctly by identifying that centralized disposition is the better outcome in that specific case.
Understanding Credit Risk
Credit risk sits at the heart of peer to peer lending. Simply put, it’s the risk that a borrower will fail to repay their loan, directly impacting the returns investors hope to earn. Unlike traditional financial institutions, where layers of regulation and established underwriting processes help manage this risk, peer to peer lending platforms must build their own systems for evaluating and pricing credit risk—often with more transparency and flexibility, but also with greater responsibility placed on both the platform and the investor.
Peer to peer lending platforms tackle credit risk through a combination of rigorous borrower assessments, income and employment verification, and detailed credit history checks. These steps help platforms assign risk grades and set appropriate interest rates, giving investors the information they need to make informed decisions. However, the responsibility doesn’t end there. Investors themselves play a crucial role in managing risk by spreading their investments across multiple loans—a strategy known as portfolio diversification. By lending money directly to a diverse group of borrowers, investors can reduce the impact of any single borrower default, smoothing out returns over time.
By bypassing traditional intermediaries, peer to peer lending offers the potential for higher returns than most traditional loans or savings products. But these higher returns come with inherent risks, including the possibility of borrower default and platform insolvency. That’s why careful consideration is essential. Investors should thoroughly research each platform, understand the loan term and credit risk associated with every investment, and take advantage of tools that support proper diversification. Many platforms now offer auto-invest features and risk management products, providing a safety net in the event of default and helping investors reduce risk.
Regulatory oversight is another key factor. As the peer to peer lending industry matures, platforms that prioritize compliance and transparency are better positioned to protect both investors and borrowers. Staying informed about regulatory changes and choosing platforms with strong governance can further reduce potential risks.
Ultimately, peer to peer lending empowers investors to participate directly in the lending market, offering a fast growing market with the potential for higher returns. By understanding credit risk, diversifying across multiple loans, and selecting reliable platforms, investors can navigate the inherent risks and position themselves to earn returns that outpace those available from traditional financial institutions. As the industry evolves, peer to peer lending is set to play an increasingly important role in the future of finance—rewarding those who approach it with research, discipline, and a clear understanding of risk.
Platform Stability and Security
When it comes to peer to peer lending, platform stability and security are not just technical details—they are the foundation of trust and the safety net for your investments. Unlike traditional financial institutions, where regulatory oversight and established processes provide a built-in layer of protection, peer to peer platforms must prove their reliability every day to both lenders and borrowers. Platform-related risks, such as potential bankruptcy, technical failures, and cybersecurity threats, can directly impact your investments.
Platform stability in peer to peer lending means more than just uptime or a slick interface. It’s about the platform’s ability to manage loans efficiently, handle repayments even during economic downturns, and maintain operations without exposing investors to unnecessary risk. Security, meanwhile, covers everything from safeguarding your personal data to preventing fraud and ensuring that every transaction is conducted with transparency and integrity. Cybercrime poses a significant threat to P2P lending platforms, with risks including data breaches and financial fraud.
For investors, choosing a reliable platform is the first and most important step. This means doing your research: look for platforms with a proven track record, read reviews from other investors, and dig into how the platform manages default risk and borrower vetting. A trustworthy peer to peer lending platform will be upfront about its risk management strategies, provide clear information on loan performance, and communicate openly about any issues that arise. Fraud or negligence by the platform or borrowers can cause significant financial losses. Additionally, P2P platforms often operate with limited credit evaluation tools and typically offer unsecured loans, which increases the potential for losses.
One of the main attractions of peer to peer lending is the potential for higher returns compared to traditional financial institutions. By bypassing traditional intermediaries, investors can often earn returns that outpace those of savings accounts or even some traditional loans. Interest rates and return rates are typically fixed and set upfront, providing predictable income for investors. However, these higher returns come with inherent risks—most notably, the risk of borrower default. Investors can lose both their principal investment and anticipated returns if borrowers fail to repay. To reduce risk, it’s essential to spread your investments across multiple loans and take advantage of portfolio diversification tools offered by the platform. Many platforms now provide auto-invest features and detailed loan listings, making it easier to lend money directly to a range of borrowers and minimize exposure to any single default.
Liquidity risk in P2P lending stems from the difficulty in accessing invested funds before the loan term ends. Investors may not be able to sell loans easily before the loan term ends, as secondary markets for selling loans can be limited or illiquid, affecting access to funds.
Regulatory oversight is another critical factor. The peer to peer lending industry is evolving rapidly, and platforms that prioritize compliance with relevant laws and regulations offer a safer environment for investors. Look for platforms that are transparent about their regulatory status and proactive in adapting to new rules—this is a sign of a company committed to sustainable growth and investor protection.
Market dynamics, valuation uncertainty, and the potential for economic downturns all play a role in the performance of peer to peer loans. A robust platform will help investors navigate these challenges by offering a wide range of loan options, providing detailed performance data, and implementing strong risk assessment techniques. Understanding the fee structure of a P2P lending platform is crucial for evaluating its overall cost-effectiveness. Regular updates on loan statuses and overall platform performance are indispensable for investors. Proper diversification and ongoing research are key to staying ahead in this fast growing market.
In summary, platform stability and security are essential for anyone considering peer to peer lending. By selecting a reliable platform that emphasizes stability, security, and regulatory compliance, investors can reduce risk and position themselves to earn higher returns. Peer to peer lending offers a compelling alternative to traditional financial institutions, with the advantages of lower interest rates for borrowers and attractive returns for investors—but only when approached with careful consideration of the inherent risks and a commitment to proper diversification.
The Hybrid Reality
Understanding where P2P does not work leads directly to the model that actually wins in practice: the hybrid.
No retailer will ever route 100% of returns peer-to-peer, and they should not try. Across most ecommerce operations, a realistic view of the return catalog looks like this:
- Roughly 60% of returns are viable P2P candidates: recoverable items in good condition with active downstream demand, primarily apparel, footwear, accessories, and durable home goods
- Roughly 40% of returns will continue to require traditional handling: defective items, regulated categories, fragile goods, and end-of-season inventory
That 40% is expected. It is not a gap in the model. It is the model working correctly.
The shift that matters is how warehouses are repositioned in this framework. In a P2P-enabled operation, a warehouse is no longer the default endpoint for every return that comes in. It becomes a specialized exception handler for the items that genuinely need centralized processing. That reframing changes the labor equation, the space equation, and the cost-per-return equation in ways that compound meaningfully at scale.
The visual that captures this well is a staged funnel: Quick Setup at the top, Hybrid Model in the middle, Effortless Scale at the base. Adoption is not a disruptive overhaul. It is a staged progression where eligibility rules are established, a pilot cohort is selected, and the system expands as evidence accumulates. That structure is what makes P2P scalable without requiring a full operational transformation upfront.
Why Hybrid Models Outperform Extremes
There is a tendency in operational strategy to prefer clean solutions. Either stay with the warehouse model or move everything to P2P. Neither extreme is operationally sound.
A pure warehouse model maximizes cost. Every return, regardless of whether it needs centralized handling, absorbs the full stack: inbound freight, inspection labor, repackaging, restocking delays, and markdown exposure, even when using convenience-focused solutions such as Happy Returns’ drop-off network. The economics are brutal on recoverable inventory that never needed to travel backward in the first place.
A pure P2P model is impractical. Fragile goods break. Defective items get forwarded to the wrong place. Regulated categories create liability. And the operational overhead of enforcing 100% routing compliance would eliminate much of the efficiency the model was meant to create.
The hybrid captures the upside of both without the fragility of either. Recoverable inventory moves forward efficiently. Items that need careful handling get it. The cost curve bends on the portion of returns where it can actually bend, which is where most of the margin damage was occurring anyway.
This is not a compromise position. It is the correct architecture for how returns actually behave across a real catalog.
Convert Returns Into New Sales and Profits
Our peer-to-peer returns system instantly resells returned items—no warehouse processing, and get paid before you refund.
I'm Interested in Peer-to-Peer ReturnsAddressing the Objections
Skepticism toward P2P tends to cluster around four objections. Each one misunderstands what the model is actually trying to do.
Customers won’t accept this
Customer behavior has already shifted. Return fees are now common across major apparel retailers. Open box and like-new goods are normalized on every major marketplace. Sustainability awareness is rising among the consumer segments that drive ecommerce growth.
Acceptance hinges on outcomes, not routing diagrams. Customers do not care how an item gets to the next buyer. They care whether their refund arrives quickly, whether the process was clear, and whether the experience felt fair—the same pillars that underpin an exceptional returns program that builds loyalty. When P2P delivers faster refunds and transparent condition standards, the experience improves. The routing is invisible.
This adds friction
Compared to what? Traditional returns involve repackaging, printing labels, waiting weeks for warehouse processing, and receiving refunds only after inspection clears. P2P can reduce the number of steps, accelerate the refund timeline, and eliminate warehouse delays entirely for eligible items. The friction argument assumes that warehouse handling is somehow frictionless to customers. It is not.
We already have returns software
Returns management systems optimize requests, not routes. They improve the customer experience at the front end of a return, automate policy enforcement, generate labels, and provide analytics, and the right returns management software can make those front-end processes significantly more efficient. What they do not change is where inventory flows after the return is initiated. P2P complements RMS. It addresses the routing decision that RMS was never designed to make. These are not competing capabilities.
Scale will fix it
This has already been tested. Carrier consolidation, mega-warehouses, drop-off network expansion, none of these interventions have reduced per-return cost in any structural way. Scale optimizes throughput. It does not remove the underlying waste: the redundant shipping leg, the inspection labor, the markdown risk while inventory sits. Volume amplifies those costs rather than dissolving them. P2P changes direction. Scale does not.
Traditional Returns Are Ending
Ecommerce built a returns system for a smaller internet. Today it’s collapsing under scale. Warehouses can’t absorb the volume, costs keep rising, and retailers are quietly tightening policies. This article explains why the old model is failing and what replaces it.
Read the Returns BibleWhat These Limits Prove
The limitations of peer-to-peer returns do not undermine the model. They define its realistic operating envelope, and that definition is precisely what makes it credible to finance leaders, operations teams, and executive buyers who have watched too many logistics innovations overpromise and underdeliver.
A system that claims to solve everything for every SKU in every category should be treated with skepticism. A system that says here is where it works, here is where it does not, and here is how the two paths coexist is a system that can actually be deployed.
The 60/40 split is not a concession. It is an honest representation of where the return losses are concentrated and where they can be structurally reduced. In most cases, most of the margin damage in returns flows from recoverable inventory that never needed to enter a warehouse in the first place. That is the portion P2P addresses. The rest continues exactly as it always has.
Credibility comes from boundaries.
The question for retailers is not whether peer-to-peer returns replace everything. The question is whether they can afford to keep routing the portion of returns that clearly should not go back at all through a system that was never designed to handle them efficiently in the first place.
For more on the full structural case for rethinking returns, see the canonical piece: The End of Traditional Returns.
Frequently Asked Questions
What are the main limitations of peer-to-peer returns?
Peer-to-peer returns are not suited for fragile goods that cannot survive customer-packed shipments, regulated product categories such as cosmetics and medical devices, items that are defective or damaged, and end-of-season SKUs with no remaining downstream demand—or for abuse patterns like wardrobing and similar return fraud. For these cases, traditional warehouse handling or a rules-driven platform like ZigZag’s returns management solution remains the appropriate path.
Does a P2P returns model mean eliminating warehouses entirely?
No. In a hybrid model, roughly 40% of returns still require centralized handling for defective, damaged, fragile, or regulated items. Warehouses shift from being the default endpoint for every return to being specialized exception handlers for the items that genuinely need them.
What percentage of returns are typically viable P2P candidates?
Across most ecommerce operations, approximately 60% of returns represent viable peer-to-peer candidates. These are recoverable items in good condition with active downstream demand, primarily apparel, footwear, accessories, and durable home goods. The remaining 40% continues through traditional reverse logistics.
Is peer-to-peer returns compatible with existing returns management software?
Yes. Returns management systems handle the customer-facing policy experience, approvals, and analytics. Peer-to-peer returns address routing, specifically where eligible inventory flows after a return is initiated. The two capabilities are complementary, not competing, and can be layered on top of solutions like Return Prime’s returns platform.
How does a hybrid returns model perform compared to a fully warehouse-centric model?
A hybrid model captures the cost reduction available on recoverable inventory, which is where most margin damage occurs, without requiring a disruptive overhaul of existing infrastructure. Purely warehouse-centric models absorb full reverse logistics cost on every return. Pure P2P models are impractical. Hybrid models capture the upside without the operational fragility of either extreme.
How should retailers start transitioning toward a hybrid P2P model?
The practical path is staged. Establish a baseline cost per return by category, define SKU eligibility based on condition, demand, and regulatory constraints, run a controlled pilot on a narrow product set, and expand based on evidence. Adoption does not require a full operational transformation upfront. It scales in proportion to the data it generates.
Written By:
Manish Chowdhary
Manish Chowdhary is the founder and CEO of Cahoot, the most comprehensive post-purchase suite for ecommerce brands. A serial entrepreneur and industry thought leader, Manish has decades of experience building technologies that simplify ecommerce logistics—from order fulfillment to returns. His insights help brands stay ahead of market shifts and operational challenges.
Turn Returns Into New Revenue
Related Articles
How to Introduce P2P Returns Without Breaking CX
Introducing peer-to-peer returns without breaking customer experience is mostly a change-management and trust-design problem, not a technology problem.
Why P2P Requires a Different Mental Model
Introduction Most people misunderstand peer-to-peer returns for the same reason: they evaluate the system through warehouse-first assumptions.
When Warehouse Returns Still Make Sense
A serious returns strategy does not pretend one path fits every return.
A Pragmatic Roadmap for Redesigning Returns

In this article
24 minutes
- Starting From Where the Evidence Actually Lands
- Why This Decision Belongs in the Boardroom
- Crafting a Clear Returns Policy
- Implementing a Returns Management System
- Managing Returned Items Effectively
- Product Roadmap Alignment
- The Five-Step Returns Process Adoption Roadmap
- Three Scenarios for the Future of Reverse Logistics and Returns
- Returns as a Growth Loop
- Frequently Asked Questions
The future of returns will not be defined by bold declarations. It will be defined by disciplined execution. Most conversations about redesigning returns stall at the diagnosis stage, cycling through the same data points without ever reaching a question that executives actually need answered: what do we do, in what order, and how do we measure whether it is working? Creating effective roadmaps as dynamic, strategic tools is essential for guiding your returns strategy and aligning stakeholders toward measurable results.
This article is an answer to that question. It is grounded in one core conviction: measurable progress with controlled risk is more valuable than radical reinvention that never ships. Making the mindset shift from diagnosis to execution is crucial for teams to implement change and achieve results. If your organization is ready to move from awareness to action, this is your returns strategy roadmap—a guide to navigating the broader world of returns strategy and its impact.
Starting From Where the Evidence Actually Lands
Before any roadmap makes sense, three facts need to be in the room. Not debated. Not relitigated. Accepted.
First, returns are structurally broken. The warehouse-centric model was built for a retail environment that no longer exists. Low volumes, cheap labor, patient customers, and invisible waste were the conditions under which “return everything to a DC” made economic sense. None of those conditions apply today. Customers’ expectations have evolved, and unmet expectations often lead to returns, making it crucial to optimize product listings and align with what customers anticipate. Most retailers implement return policies as a strategy to reduce customer risk and encourage purchases, carefully balancing customer satisfaction and business protection.
Second, incremental fixes have failed. Better portals, more drop-off locations, smarter fraud scoring, carrier consolidation — these investments have improved parts of the experience without changing the underlying cost structure. The per-return loss has not materially declined. The fraud exposure has not closed, and unchecked returns fraud and refund fraud can silently erode profit at a scale many retailers underestimate. The sustainability footprint has not shrunk. Tools got better. Economics did not. In fact, 67% of shoppers check the return policy before making a purchase, and a well-crafted return policy can build trust and reduce hesitation among customers.
Third, peer-to-peer returns represent a credible structural alternative. By rerouting eligible returned items directly to the next buyer rather than backward through a warehouse, entire cost categories are removed rather than managed. This is not optimization. It is a different routing assumption built into the same operational infrastructure you already have.
These three facts position what follows not as a new thesis, but as a logical continuation. The argument has been made. This article is about execution.
Make Returns Profitable, Yes!
Cut shipping and processing costs by 70% with our patented peer-to-peer returns solution. 4x faster than traditional returns.
See How It WorksWhy This Decision Belongs in the Boardroom
Returns have lived too long in operations. They are not an operations problem. They are a cross-functional strategic issue that now carries implications for finance, operations, marketing, and governance simultaneously. Any returns strategy roadmap must address all four dimensions and clearly communicate strategic initiatives that require cross-functional alignment to ensure buy-in and effective execution.
When designing adaptable returns processes, it is essential to create environments that support efficient decision making, especially in areas such as returns storage, sorting, inspection, and routing. Effective decision making in these processes streamlines operations, reduces processing times, and improves overall returns management.
If returns are not addressed as a strategic issue, there is a significant risk of misaligned priorities, where teams may work on conflicting or unfocused initiatives, leading to wasted resources and friction with stakeholders.
The CFO Lens: Margin Protection and Capital Efficiency
Finance leaders feel returns as margin erosion and capital drag. The cost of a return is not what most companies are measuring. Averaged figures obscure the real structure of the loss. What a CFO actually needs to understand is the fully loaded cost per return, broken down into its components: shipping, labor, markdown, and fraud. Each category behaves differently and responds to different interventions.
Beyond the per-return figure, the CFO concerns that matter most are the gross margin impact of elevated return rates, the recovery rate of returned inventory once it enters the reverse logistics flow, the predictability of return-related cash flows across seasonal cycles, and the amount of working capital sitting idle in slow-moving returned inventory that has not been inspected, restocked, or resold.
Peer-to-peer returns reframe this entire picture. They do not make returns cheaper to process. They eliminate entire processing stages for eligible items. That distinction matters to a finance leader because it changes the shape of the cost curve, not just the height of a single data point.
The COO Lens: Operational Resilience
Operations teams experience returns as friction that compounds under pressure. The specific pain points are familiar: inbound congestion at receiving docks during peak season, labor volatility tied to unpredictable return volumes, exception-heavy workflows that require human judgment at every step, peak-season bottlenecks that force tradeoffs between outbound fulfillment and inbound returns processing, and the broader warehouse throughput pressure that makes the returns flow feel like it is always competing with forward operations for the same resources. To handle returns efficiently, whether through in-house processes or by outsourcing to third-party providers, is essential for minimizing these operational disruptions.
The warehouse-centric model does not scale gracefully. It scales expensively. More volume means more congestion, more labor, more errors, and more exceptions. A returns strategy roadmap that shifts a meaningful share of returns away from the inbound dock entirely does not just reduce cost. It protects the operational capacity that outbound fulfillment depends on. Automated reverse logistics processes are vital for efficiently receiving, inspecting, and processing items back into inventory. Standardized inspection protocols should categorize returns quickly for either restock, refurbish, recycle, or dispose.
For COOs, the case for peer-to-peer is not about technology. It is about protecting the core operation from being overwhelmed by an exception-handling workflow that was never designed to absorb this much volume. To manage returns effectively is now a core operational capability, and the ultimate goal is to create a well oiled machine in returns management.
Convert Returns Into New Sales and Profits
Our peer-to-peer returns system instantly resells returned items—no warehouse processing, and get paid before you refund.
I'm Interested in Peer-to-Peer ReturnsThe CMO Lens: Trust, Customer Satisfaction, and Loyalty
Marketing leaders are increasingly accountable for the post-purchase experience, even though they rarely control it. Returns are where brand promises get tested, and improving customer satisfaction is a key marketing goal. A customer who receives a fast refund with clear communication is far more likely to purchase again. A transparent returns process can build customer trust and encourage repeat purchases—92% of customers will buy from a brand again if the returns process is easy, and an exceptional returns program that prioritizes loyalty turns every return interaction into a chance to deepen the relationship. A customer who waits three weeks for a refund while tracking a package in reverse logistics limbo is quietly disengaging.
The specific pressures marketing leaders face include rising expectations for faster refunds, growing scrutiny on sustainability claims (particularly as younger consumers actively evaluate whether brands are responsible or performative), transparency expectations across the full return journey, and Gen Z value alignment, which increasingly connects brand loyalty to how a company handles its environmental and ethical commitments.
Peer-to-peer supports all of these. Faster refunds become structurally easier when items do not wait in warehouse queues, and issuing a credit to a customer’s account can streamline the refund process, improve transparency, and enhance customer experience. Sustainability narratives become credible when fewer items travel redundant miles and fewer items enter liquidation. And a returns experience framed as forward-moving rather than bureaucratic lands differently with a generation that has already normalized secondhand markets.
Giving customers clear options and incentives in the returns process—such as a well-defined exchange policy or offering store credit instead of refunds—can improve customer experience, keep money within the business, and encourage future purchases. The importance of a clear exchange policy as part of the returns strategy cannot be overstated, as it provides structure and incentives for both the customer and the business.
For the CMO, the risk is not changing how returns work. The risk is defending outdated return policies that feel misaligned with what the brand claims to stand for.
Board-Level Implications for Returns Strategy
At the governance level, returns intersect with four areas that boards now scrutinize directly: margin durability, regulatory exposure, ESG commitments, and long-term competitiveness. Boards are increasingly interested in how a returns strategy can generate new customer leads and drive business growth, making returns management a key lever for strategic advantage.
Boards are asking why return costs are rising faster than revenue. They are asking which portion of that cost is actually controllable and what the operational plan is if regulation moves faster than internal systems can adapt. They are asking whether sustainability disclosures are backed by measurable operational changes or just positioned as marketing.
Returns sit at the intersection of all of these questions. A returns strategy roadmap that reaches the board level is not a logistics proposal. It is an answer to how the business intends to remain competitive, compliant, and financially sound as the environment around it continues to shift. Defining and measuring success for stakeholders is essential to ensure alignment and to track progress toward strategic goals. Optimizing returns can also create new opportunities for the business, enabling continuous improvement and growth.
Crafting a Clear Returns Policy
A clear returns policy is the foundation of a trustworthy customer relationship and a critical component of an effective returns process. Customers expect transparency and simplicity when it comes to returning products, and a well-communicated policy can make all the difference in their purchase decisions. To build trust and reduce the likelihood of unnecessary returns, your returns policy should be easy to locate—featured prominently on your website, product pages, order confirmation emails, packaging, and in-store signage.
The policy itself should provide a clear understanding of the return window, outline any restocking fees, and detail the step-by-step process for initiating a return. It’s equally important to specify which items are final sale and non-returnable, so customers know exactly what to expect before making a purchase. By setting clear expectations, you empower customers to make informed decisions, which can reduce returns and improve overall customer satisfaction.
Offering free returns where feasible can further enhance customer loyalty, but even when that’s not possible, clarity and fairness in your returns policy will help build long-term trust while also helping you manage the rise of e-commerce return rates driven by changing shopper behavior. Ultimately, a transparent and accessible returns policy not only streamlines the returns process but also encourages repeat business, turning a potential pain point into a competitive advantage.
No More Return Waste
Help the planet and your profits—our award-winning returns tech reduces landfill waste and recycles value. Real savings, No greenwashing!
Learn About Sustainable ReturnsImplementing a Returns Management System
A robust returns management system is essential for transforming returns from a costly necessity into a strategic asset. By leveraging returns management software to automate and streamline the returns process, businesses can significantly reduce associated costs and improve customer satisfaction. Key features of an effective returns management system include online return initiation, automated return shipping label generation, and real-time tracking of returned items.
Beyond operational efficiency, a well-oiled returns management system provides valuable insights into return rates, reasons for returns, and customer behavior, especially when you implement best-in-class returns management software that centralizes data and workflows. These insights can inform business strategy, helping you identify patterns, address root causes, and refine your approach to returns management. With the right system in place, your team can focus on delivering a superior customer experience rather than getting bogged down in manual processes.
The result is a smoother, faster returns process that enhances customer loyalty, boosts conversion rates, and drives revenue growth. By treating returns management as a core business function—rather than an afterthought—you position your company to respond proactively to customer needs and market changes, turning returns into a source of competitive strength.
Managing Returned Items Effectively
Effectively managing returned items is key to minimizing waste and protecting your bottom line. Every returned item represents both a cost and an opportunity. By implementing a structured process for inspecting returned items, businesses can determine whether products can be restocked, refurbished, or resold, reducing losses and supporting sustainability goals as part of a broader effort to optimize reverse logistics end-to-end.
Offering store credit or exchanges instead of automatic refunds can further reduce the financial impact of returns and encourage customers to make another purchase, strengthening customer relationships and retention. For example, if a customer returns a product due to sizing issues, providing an easy exchange process or store credit can turn a potentially negative experience into a positive one.
Analyzing data on returned items also enables businesses to spot trends—such as high return rates for specific products or categories—and make targeted improvements to product descriptions, sizing guides, or quality control. By proactively addressing these issues, you can reduce returns over time and enhance the overall customer experience.
Product Roadmap Alignment
Aligning your product roadmap with your returns strategy is a powerful tool for driving customer satisfaction and achieving business goals. By prioritizing initiatives that address customer pain points—such as enhancing product descriptions, simplifying the returns process, and offering multiple return options—you create a clear understanding of your objectives and ensure that resources are allocated where they will have the greatest impact, especially when crafting the perfect e-commerce returns program to balance cost and loyalty.
A customer-centric product roadmap not only improves the returns process but also strengthens the overall customer experience, leading to higher conversion rates, increased loyalty, and greater revenue. For example, investing in more accurate product descriptions can reduce the likelihood of returns, while providing flexible return options can meet diverse customer expectations and build trust.
Ultimately, a well-aligned product roadmap enables your business to adapt to changing market conditions, respond to customer feedback, and maintain a competitive edge. By making returns management a strategic priority within your product development process, you turn a traditional pain point into a driver of growth and customer retention.
The Five-Step Returns Process Adoption Roadmap
The goal is not disruption. The goal is measurable progress with controlled risk. Creating a returns strategy roadmap is a 6–12 month iterative process focused on reducing return rates and accelerating the speed of restocking. The following five steps are not theoretical. They are the sequence that turns a structural argument into an operational reality.
After completing these five steps, quarterly reviews of the returns strategy roadmap should assess KPIs like return rates and customer satisfaction scores. Collecting and analyzing returns data can unveil patterns, highlight issues, and guide ongoing strategic decisions.
Step 1: Baseline Measurement
Nothing that follows is defensible without this step. Before any routing changes, eligibility decisions, or pilot designs, the organization must establish a clear and honest baseline.
That baseline includes cost per return broken down by its actual components: shipping costs in and out, labor for intake, inspection, repackaging, and restocking, markdown exposure for items that lose value during the return cycle, and fraud-related losses that are currently being absorbed without clean attribution. It also includes refund cycle time from initiation to settlement, return rate by SKU category, and the recovery rate of returned inventory once it enters the warehouse.
Without a baseline, gains appear anecdotal. ROI cannot be defended in a board presentation or a budget conversation. Scaling decisions lack credibility because there is no before-and-after to point to. Baseline measurement is not a finance exercise. It is the foundation of every decision that follows.
Step 2: SKU Eligibility Definition
Not all products should follow the same return path. This step is where discipline matters more than enthusiasm. The temptation is to identify P2P as the new default and push as many SKUs into it as possible. That is the wrong instinct. Eligibility definition is about finding the right cohort, not the largest one.
Organizations can reverse engineer their reverse logistics processes to optimize SKU routing, analyzing existing returns data and workflows to systematically plan which SKUs are best suited for each return path.
High-fit P2P candidates typically share a set of characteristics: stable resale value that does not decay quickly, durable packaging that can support a second shipment without professional repackaging, higher return rates that make demand signals easier to match, predictable buyer demand for the item in a like-new condition, and lower regulatory constraints that do not restrict resale or require chain-of-custody documentation.
Low-fit SKUs remain in traditional flows. Fragile items that require controlled inspection and professional repackaging belong in the warehouse. Regulated goods with resale restrictions, custom or made-to-order items, and perishable or consumable products are all natural exceptions. These SKUs do not undermine the model. They define its realistic operating envelope.
Discipline in eligibility protects customer trust and prevents the kind of overreach that creates a bad experience in the early days of a pilot, when the program is most vulnerable to internal skepticism.
Step 3: Pilot Design
Successful adoption starts small. A pilot that tries to cover too many SKUs, too many markets, or too many customer segments at once will not produce clean evidence. It will produce noise.
Best practice is to select a narrow SKU set or limit by geography or customer segment, then track three categories of signal closely: the economics (cost per return, recovery rate, refund cycle time), the customer experience (feedback, repeat purchase behavior, satisfaction signals), and the fraud indicators (abuse patterns, condition disputes, delivery exceptions), ideally supported by a flexible platform like the Return Prime returns solution for test-and-learn pilots.
As part of the pilot, consider including an onboarding flow specifically designed for new users. Designing a new onboarding flow should focus on outcome-based metrics, such as increasing user retention or engagement, rather than just launching a feature. It is important to track the experience of new users during the pilot to measure the effectiveness of the onboarding process and its impact on overall returns strategy roadmap outcomes.
The framing matters. A pilot is not a rollout. It is a live experiment designed to produce evidence. Executives who commission a pilot looking for confirmation rather than data will misread the results. The evidence a disciplined pilot produces is the currency needed to expand confidently and defend the decision at every level of the organization.
Step 4: Guardrails and Controls
Peer-to-peer changes where risk occurs. It does not eliminate risk. Any returns strategy roadmap that presents P2P as a fraud-free system is either uninformed or overselling. The honest framing is that risk shifts, and guardrails must be built to match the new risk profile from the beginning.
Effective guardrails for a P2P returns system include photo or condition proof required at the point of return initiation, AI-assisted risk scoring for orders that fall outside normal parameters, refunds tied to confirmed delivery to the next buyer rather than to the moment of shipment, incentives for proper preparation (clear packaging, accurate condition representation), and defined penalties for abuse to prevent the system from being gamed once it becomes familiar. Offering flexible return options, such as drop-off locations, carrier pickup, or in-store returns, or leveraging networks like Happy Returns drop-off Return Bars, can also serve as a guardrail by increasing customer convenience and reducing friction. Additionally, implementing self-service portals empowers customers to manage their own returns and can significantly reduce customer service inquiries related to returns.
These guardrails should evolve alongside adoption. The risk profile in a narrow pilot is different from the risk profile at scale. Controls that are appropriate in month three may need to be recalibrated in month twelve. Building the governance infrastructure to monitor and adjust is as important as building the routing logic itself.
Step 5: Expansion and Normalization
Once a pilot has produced real evidence of economics, experience, and fraud performance, expansion becomes a structured decision rather than a leap of faith. SKU coverage expands to include more of the high-fit cohort. Geographic scope widens based on where demand signals and logistics infrastructure align. P2P becomes integrated into standard returns policy rather than operating as a parallel track. As part of a comprehensive returns strategy roadmap, brands can also offer exchanges and in store returns, providing customers with flexible options such as store credit and alternative to refunds. Competitor return policies often span return windows from 30 to 90 days, and studying leaders like Amazon’s returns policy can help benchmark expectations, while speed to resale aims to make returned items available for resale within 24 hours of receipt to minimize depreciation.
At scale, the objective is for P2P to function as an invisible routing decision. The customer does not need to know which path their return takes. The operations team does not need to treat it as a special program with its own set of exceptions. It becomes a default path for eligible items, a structural advantage embedded in the policy and infrastructure, and a routine outcome rather than a celebrated experiment.
This is what normalization looks like. Not a press release. A well-functioning system operating quietly in the background.
Traditional Returns Are Ending
Ecommerce built a returns system for a smaller internet. Today it’s collapsing under scale. Warehouses can’t absorb the volume, costs keep rising, and retailers are quietly tightening policies. This article explains why the old model is failing and what replaces it.
Read the Returns BibleThree Scenarios for the Future of Reverse Logistics and Returns
Returns will evolve. The question is not whether the system will change. It is who is positioned to shape that change and who will be reacting to it under pressure. Brands that proactively develop a returns strategy roadmap can turn returns into strategic opportunities for business growth, customer satisfaction, and competitive advantage by optimizing returns management and leveraging flexible storage solutions.
In the best-case scenario, peer-to-peer adoption becomes widespread across the industry. More than half of recoverable returns bypass warehouse processing. Return costs decline materially. Scope 3 emissions drop measurably. Returns evolve from a cost center into a loyalty and margin lever for brands that implement the model well.
The middle-case scenario is more likely in the near term, and it is still a significant improvement over the status quo. Hybrid models dominate. Somewhere between 30 and 40 percent of returns route peer-to-peer, with warehouses handling the genuine exceptions: defective items, regulated categories, and end-of-cycle inventory with no downstream buyer. Brands that reach this level of adoption achieve meaningful savings without requiring full operational reinvention. This is not a consolation prize. It is a material shift in the economics of returns for companies willing to do the work.
In the worst-case scenario, regulation moves faster than internal systems. Return restrictions increase before companies have modernized their routing. Costs rise faster than revenue. Brands face compliance risk and margin compression at the same time. In this scenario, returns remain a growing liability, and the brands that delayed adaptation pay the highest price in capital, reputation, and competitive position.
The cost of delay is not abstract. Every year without a returns strategy roadmap locks in avoidable cost that compounds. It increases regulatory exposure as the gap between current operations and emerging compliance requirements widens. It normalizes inefficient behavior inside operations teams that come to treat the broken model as the natural state of things. It also creates operational constraints, as the majority of reverse logistics partners have long contracts, making it vital to sort out existing contracts before making changes. And it weakens competitive position relative to brands that have already begun building a structural advantage.
Structural problems do not self-correct.
Returns as a Growth Loop
The final reframe is the most important one, and it is the one most often lost in the operational detail.
Returns have been treated as a necessary evil for so long that most organizations have stopped asking whether that framing is still accurate or useful. It is neither. Aligning your returns strategy roadmap with broader product goals ensures that your approach supports not just operational efficiency, but also the achievement of key business objectives.
When returns are redesigned with the right routing logic, they generate a compounding effect. Lower costs free up margin. Faster refunds improve the customer experience, especially at first glance—when customers initially evaluate your returns process, a clear and hassle-free policy can make a strong positive impression. Better customer experience drives higher loyalty. Higher loyalty produces more sales. More sales produce more data on return patterns, which improves eligibility decisions and routing logic. The loop reinforces itself.
This is not a diagram that needs to be overengineered. The logic is straightforward: lower costs lead to faster refunds, faster refunds drive higher loyalty, and higher loyalty creates more sales. What matters is that this loop exists, that it is measurable, and that it requires a deliberate returns strategy to set it in motion.
The brands that recognize returns as a strategic capability rather than an operational cost center will build this loop. Those that continue to treat returns as a back-office cleanup function will continue absorbing losses that are, at this point, largely avoidable.
The question facing every retailer is no longer whether the returns system needs to change. That question has been answered. The question now is whether the organization is ready to move from understanding the problem to executing against it.
The companies that act now will define the standard. Those that wait will inherit it on worse terms.
Frequently Asked Questions
What does a returns strategy roadmap actually include?
A returns strategy roadmap includes five core phases: establishing a cost baseline broken down by shipping, labor, markdown, and fraud; defining SKU eligibility for peer-to-peer routing versus traditional warehouse handling; designing and running a controlled pilot with clear economic and experience metrics; building guardrails and controls to manage shifted risk; and expanding peer-to-peer to normalized policy at scale. Each step is sequential and builds on the evidence produced by the prior one.
Why do CFOs need to be involved in a returns redesign initiative?
Returns carry direct implications for gross margin, working capital, and cash flow predictability. The fully loaded cost per return is rarely visible in averaged reporting, and the recovery rate of returned inventory affects inventory planning and capital efficiency. CFOs who are not involved in returns strategy tend to inherit the cost without the tools to address it structurally.
What is the most realistic near-term outcome for peer-to-peer returns adoption?
Based on current industry conditions, the most likely near-term outcome is a hybrid model where 30 to 40 percent of returns route peer-to-peer and warehouses handle genuine exceptions. This level of adoption still produces material savings in shipping, labor, and markdown exposure without requiring full operational reinvention.
How does a returns strategy roadmap connect to sustainability goals?
Every return routed directly to the next buyer rather than backward through a warehouse eliminates at least one shipping leg, reduces packaging waste, and removes warehouse handling energy from the equation. At scale, this produces measurable reductions in Scope 3 emissions and provides defensible data for ESG disclosures and regulatory reporting requirements that are increasingly mandatory in major markets.
What guardrails are needed when implementing peer-to-peer returns?
Effective controls include requiring photo proof at the point of return initiation, applying AI-assisted risk scoring for flagged orders, tying refunds to confirmed delivery rather than shipment, offering incentives for customers who prepare returns correctly, and enforcing penalties for abuse. Risk in a peer-to-peer system does not disappear; it shifts, and guardrails must be designed to match the new exposure profile from the start.
What happens operationally if a company delays building a returns strategy?
Delay locks in avoidable costs that compound annually, increases exposure to regulatory requirements that are already in motion in international markets and trending toward the U.S., normalizes inefficient warehouse-centric behavior that becomes harder to change the longer it persists, and weakens competitive position relative to brands that begin capturing the structural advantages of forward-moving returns models earlier.
Written By:
Manish Chowdhary
Manish Chowdhary is the founder and CEO of Cahoot, the most comprehensive post-purchase suite for ecommerce brands. A serial entrepreneur and industry thought leader, Manish has decades of experience building technologies that simplify ecommerce logistics—from order fulfillment to returns. His insights help brands stay ahead of market shifts and operational challenges.
Turn Returns Into New Revenue
Related Articles
How to Introduce P2P Returns Without Breaking CX
Introducing peer-to-peer returns without breaking customer experience is mostly a change-management and trust-design problem, not a technology problem.
Why P2P Requires a Different Mental Model
Introduction Most people misunderstand peer-to-peer returns for the same reason: they evaluate the system through warehouse-first assumptions.
When Warehouse Returns Still Make Sense
A serious returns strategy does not pretend one path fits every return.